The Best Five Sectors This Week #81
Key Takeaways
- Tech drove portfolio gains with a 1.2% contribution, despite weakening momentum.
- Industrials are showing more weakness, moving toward the lagging quadrant on RRG.
- Energy crossed into the improving quadrant, showing strong upward momentum.
- The portfolio lags the S&P 500 by nearly 8%, with tech and financials key to recovery.
Technology Leads, Industrials Lag
After a week in which the S&P 500 ($SPX) gained 30 basis points, our portfolio of the top five sectors outperformed slightly, picking up 0.72 basis points. This was largely driven by the Technology sector, which contributed 1.2% to the portfolio’s performance. Energy and Financials also added positive, though minimal, returns, while Industrials and Health Care detracted from overall results.
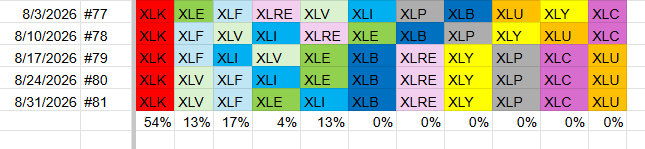
The portfolio composition remains mostly unchanged, with only one swap: Energy moved up from fifth to fourth place, pushing Industrials down to fifth. The top five sectors are now Technology, Health Care, Financials, Energy, and Industrials. The bottom half includes Materials, Real Estate, Discretionary, Staples, Communication Services, and Utilities.
- (1) Technology - XLK [52%]
- (2) Health Care - XLV [13%]
- (3) Financials - XLF [19%]
- (5) Energy - XLE [4%]*
- (4) Industrials - XLI [12%]*
- (6) Materials - XLB
- (7) Real Estate - XLRE
- (8) Consumer Discretionary - XLY
- (9) Consumer Staples - XLP
- (10) Communication Services - XLC
- (11) Utilities - XLU
Weekly RRG
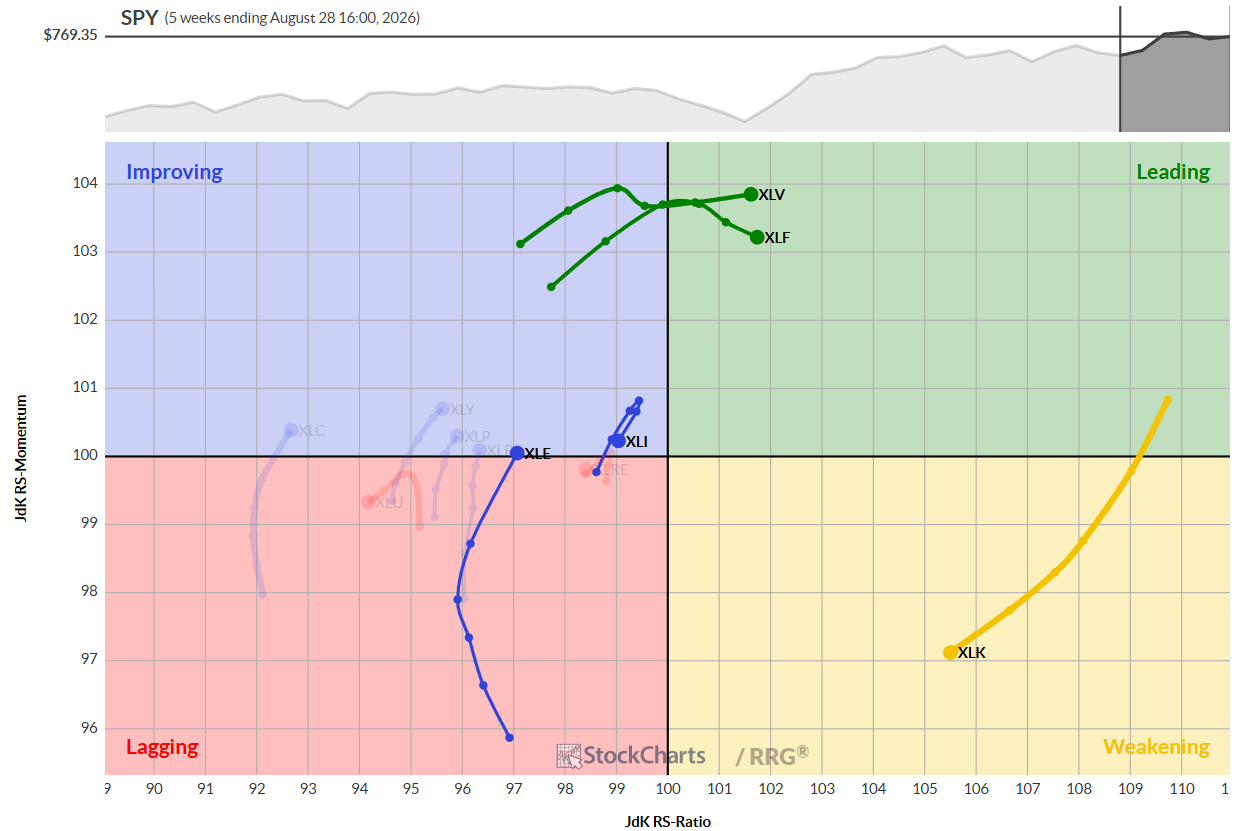
On the weekly Relative Rotation Graph (RRG), Technology continues its rotation through the weakening quadrant. Despite losing momentum over recent months, it still holds the highest reading on the RS-Ratio scale. Health Care and Financials remain in the leading quadrant, with Health Care maintaining a positive trajectory and financials beginning to lose momentum, though still moving higher on the RS-Ratio scale.
Energy has rotated through the lagging quadrant and is now crossing into the improving quadrant, showing strong RRG velocity, especially in the latest segment. Industrials, however, are the weakest among the top five, showing a sharp rotation lower within the improving quadrant and now heading back toward lagging.
Daily RRG
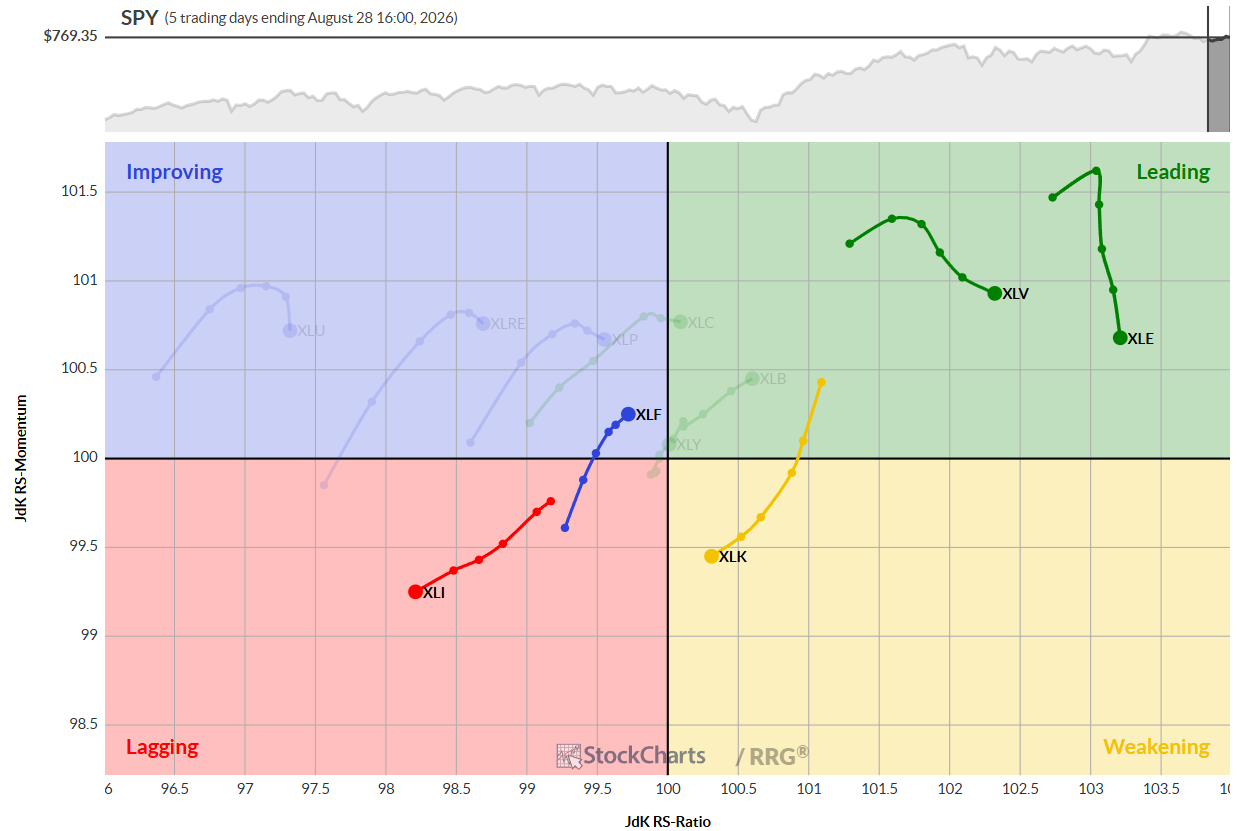
The daily RRG presents a slightly different picture. Energy and Health Care are well inside the leading quadrant, though both have started to lose relative momentum at high RS-Ratio readings. Technology’s tail is inside the weakening quadrant, moving at a negative heading and nearing the lagging quadrant. This combination of weekly and daily RRG tails suggests further weakness in Technology's relative momentum in the coming weeks.
Financials confirm their weekly strength with a tail inside the improving quadrant, moving positively and closing in on the leading quadrant. Industrials are deep in the lagging quadrant on the daily RRG, confirming their weak rotation on the weekly RRG and putting them at risk of dropping out of the top five unless a strong recovery occurs, which seems unlikely given the current sector positions.
Sector Highlights
Technology
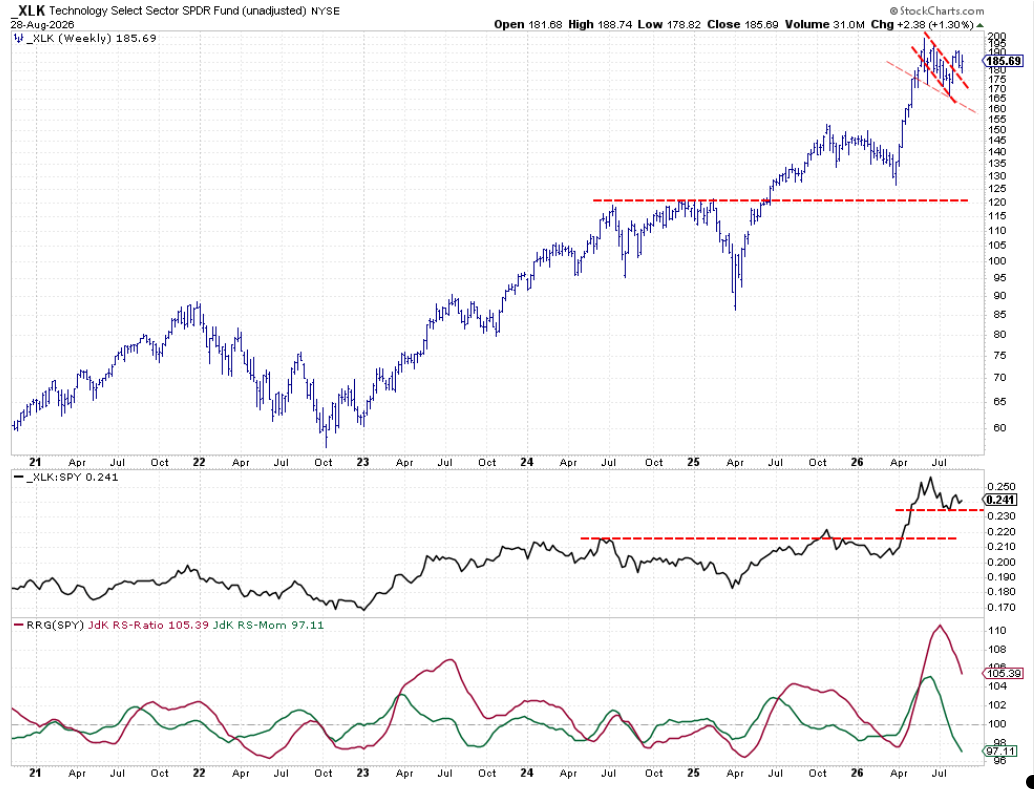
The Technology sector has started to move sideways, as seen in the last three bars on the weekly chart. It remains above the breakout level, which, for now, helps stave off further weakness. The raw RS line is hovering above the recent low, allowing the RRG lines to correct without a strong negative signal for now. The price chart needs to hold at current levels to maintain the longer-term relative uptrend.
Health Care
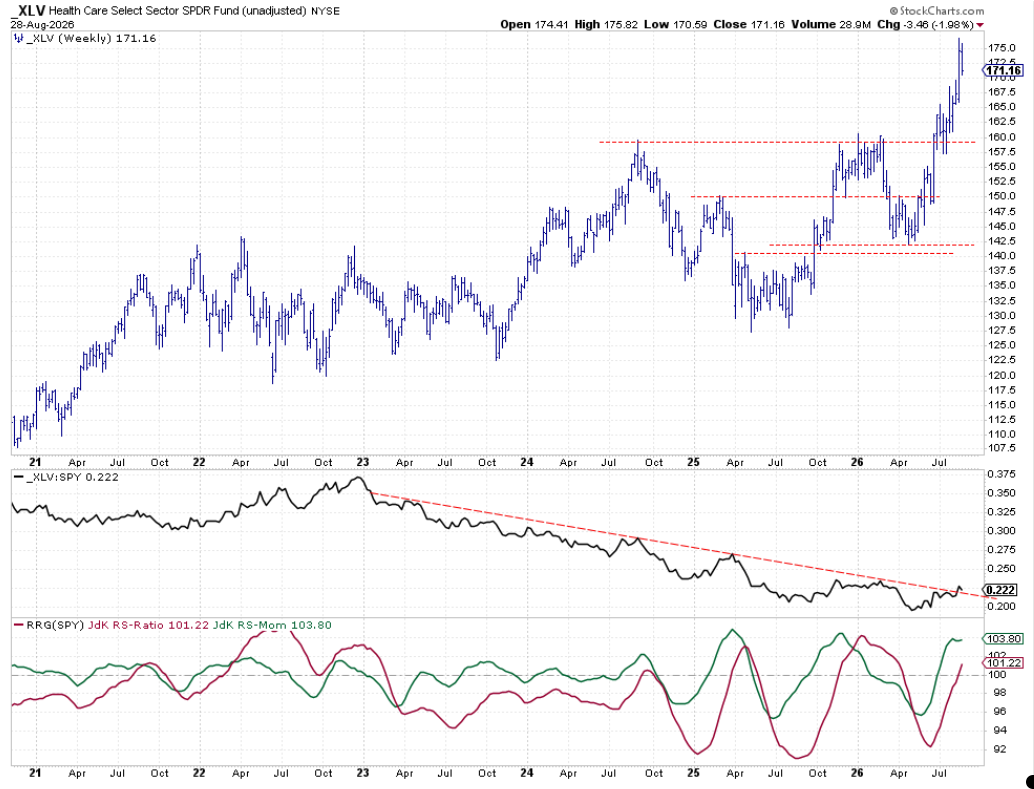
Health Care is performing well after its breakout, maintaining a rhythm of higher highs and higher lows. The raw RS line, after a multi-year decline, is holding up, and the RRG lines are comfortably above 100, though the RS-momentum line is losing some steam.
Financials
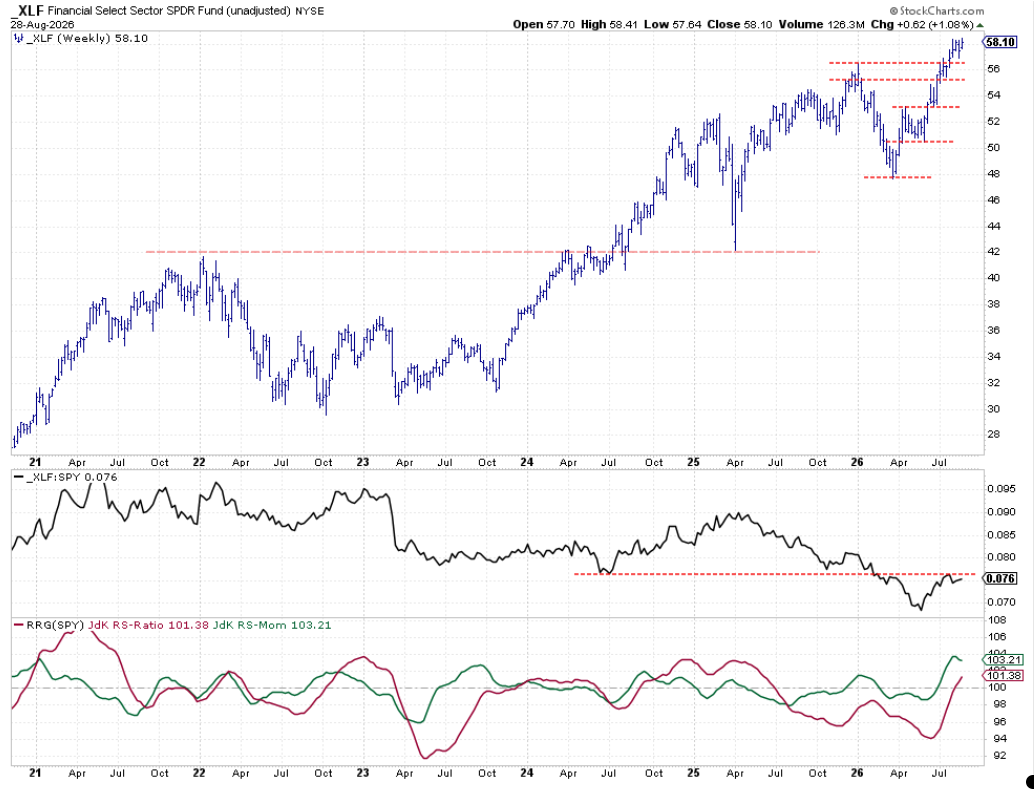
Financials are holding above the breakout level, with the previous peak around 56.5 now acting as support. If the sector can establish a new low and attempt to move higher, ideally surpassing the 59 mark, it could pull the raw RS line above resistance. Both RRG lines remain above 100, but the RS-momentum line is rolling over. Only a move beyond the previous high will keep financials in the top five and in a relative uptrend.
Energy
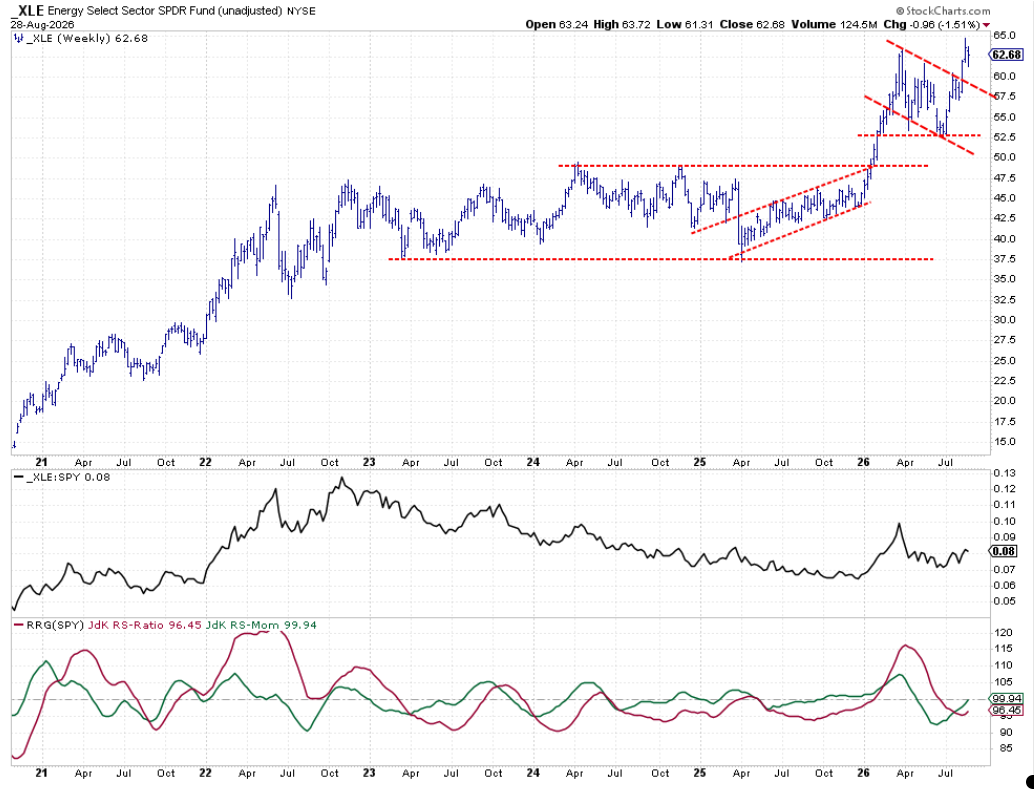
Energy continues to improve, pushing toward another new high this week. The low in the raw RS line is now visible, and a new series of higher highs and lows is emerging. This is driving the RRG lines higher, with the RS-momentum line already above 100, positioning energy in the improving quadrant.
Industrials
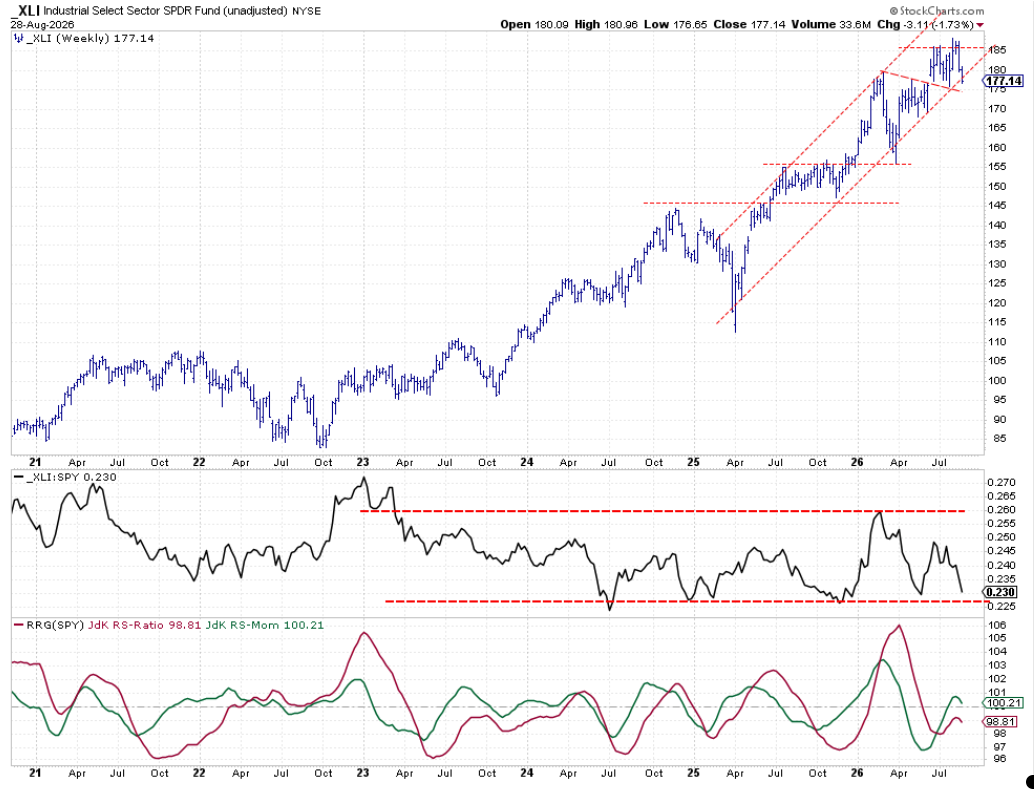
Weakness in Industrials is becoming more evident on the price chart. XLI is threatening to break out of its rising channel, and the raw RS line continues to decline towards the lower boundary of its trading range. A break below that lower boundary will likely accelerate this sector's relative weakness. Both RRG lines have already rolled over, pushing the XLI tail into the lagging quadrant on the weekly RRG.
Portfolio Performance
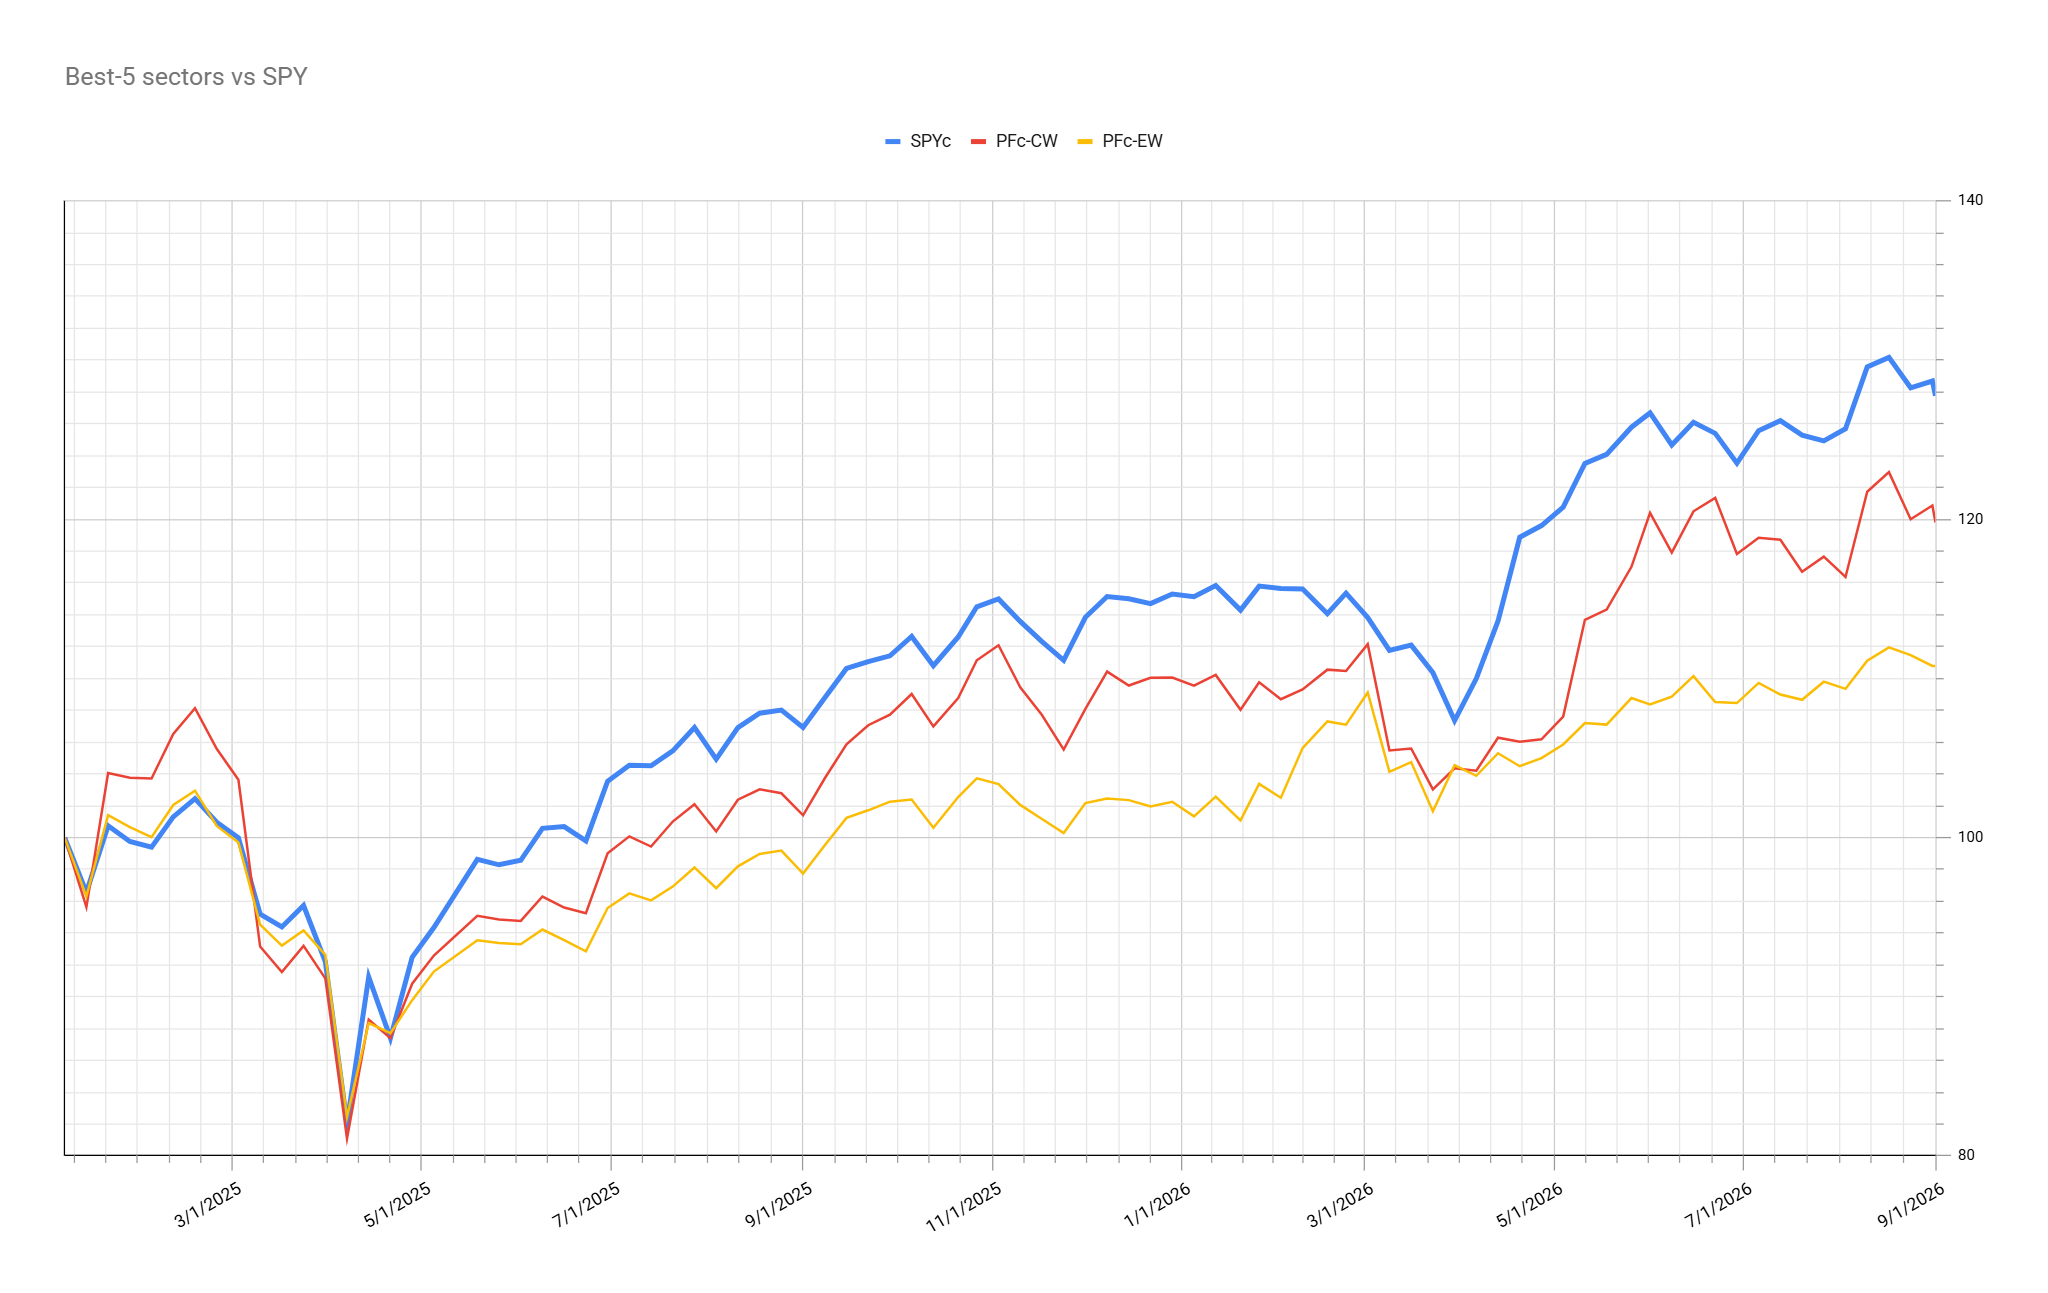
The top five portfolio is now just under 8% behind the S&P 500. Technology remains the sector with the largest impact, followed by Financials, which carry almost a 20% weight. For the portfolio to catch up to the S&P 500, both Technology and Financials need to hold up well, especially on a relative basis.
#StayAlert, --Julius