MACD vs. RSI: When Should You Use Each Indicator?

On a recent mailbag episode of CHART THIS with Dave Keller, a viewer asked this fantastic question comparing two commonly used technical indicators:
In what situations would you use MACD over RSI? What are the relative advantages of each indicator?
To answer, let's discuss the different types of technical indicators and their benefits to our decision-making process. Using multiple indicators that are too similar adds little to your investment approach, because you’re basically duplicating signals. The good news is that MACD and RSI are very different indicators; by combining them in a meaningful way, you can effectively track how charts rotate from bullish to bearish and back again.
Leading Indicators Anticipate Momentum Shifts
I consider Welles Wilder’s Relative Strength Index (RSI) to be a leading indicator, as overbought and oversold conditions often occur earlier in a trending market. On the chart of Amazon.com (AMZN), we can see how the stock became oversold in early February, soon after the price gapped lower.
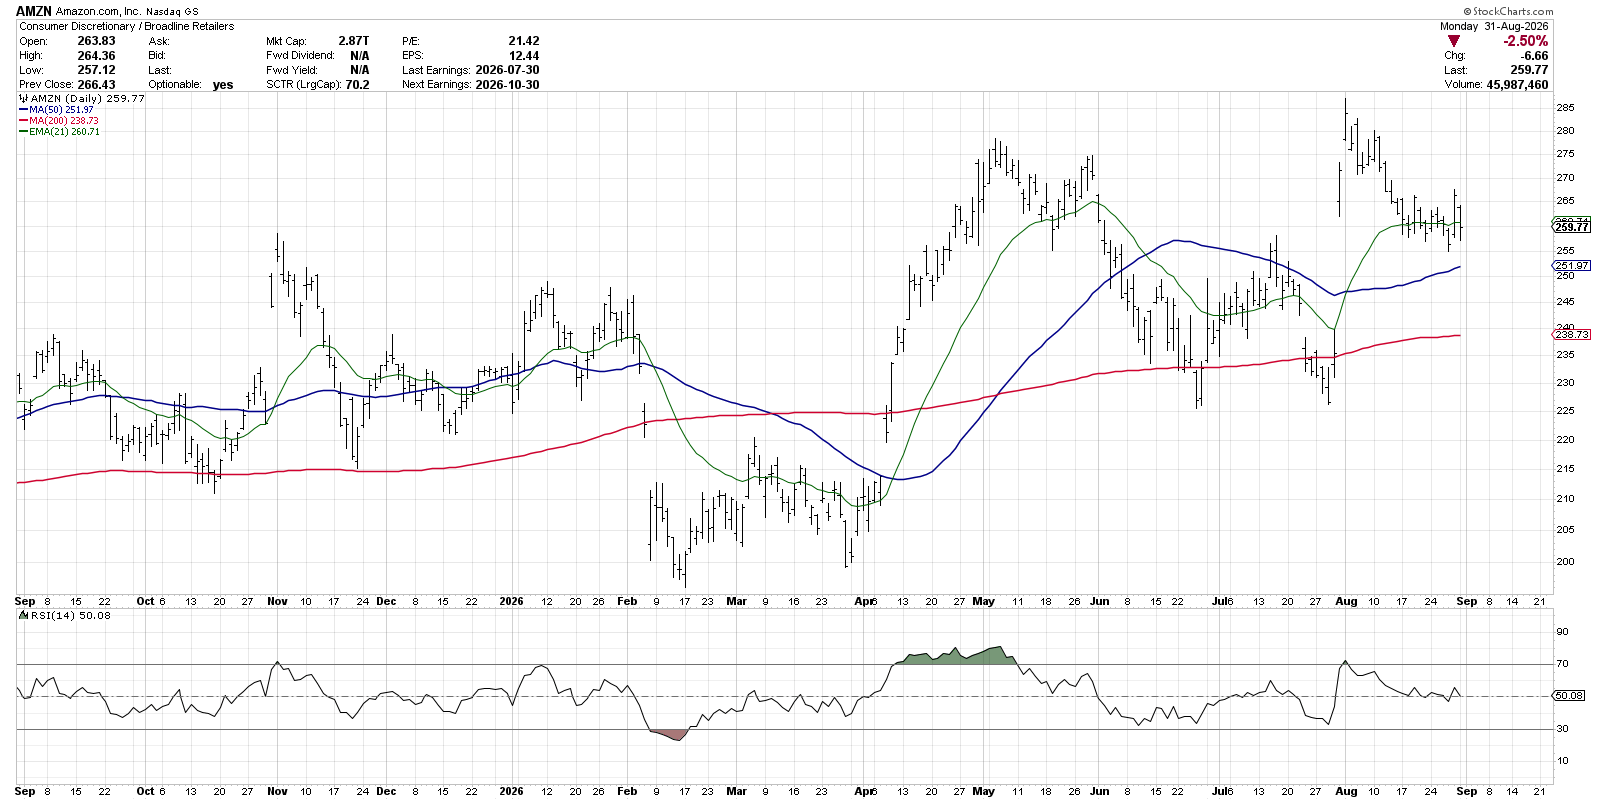
When the RSI came out of the oversold region in mid-February, that suggested a waning of downside pressure and a potential bottoming pattern. In early April, AMZN moved to overbought conditions as the stock powered above its 200-day moving average. The RSI exited the overbought region about a month later, signaling a lack of upside momentum and a potential topping pattern.
We can see from this example that overbought and oversold conditions often confirm the strength of the underlying trend. When the RSI exits the extreme range, or we observe a divergence between price and RSI, then we can assume a potential change in trend.
Lagging Indicators Can Confirm Change In Trend
While RSI often provides an early warning system for a change in price trend, other indicators are designed to lag behind the price action to confirm a change has already occurred. Focusing on those same two time periods, we can see how the Moving Average Convergence/Divergence (MACD) indicator usually provides a reversal well after the actual turning point.
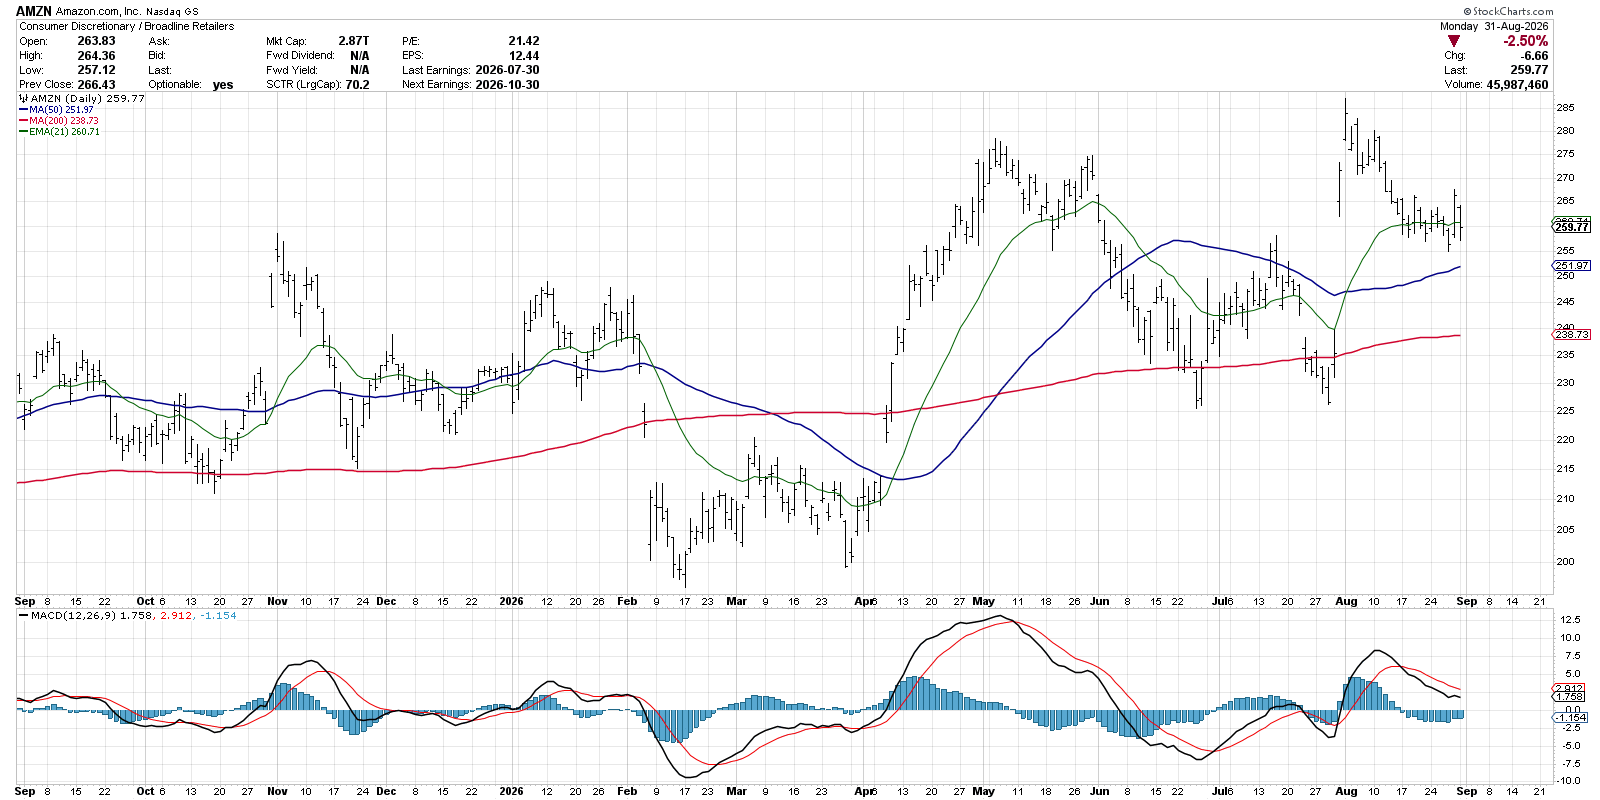
While the RSI became oversold in February after the gap lower, and exited the oversold region about a week and a half later, the MACD indicator finally generated a bullish signal about eight sessions later.
Is this a malfunction of the MACD indicator? Absolutely not. MACD is based on moving averages, designed to lag behind changes in trend and only signaling when a new trend is confirmed. We can see this play out more recently off the August high, as it took the MACD a couple of weeks to register a downturn in price action.
Different Indicator Types Paint a More Complete Picture
By combining a leading indicator like RSI with a lagging indicator such as MACD, we can use the series of signals to validate trends and more accurately define trend changes.
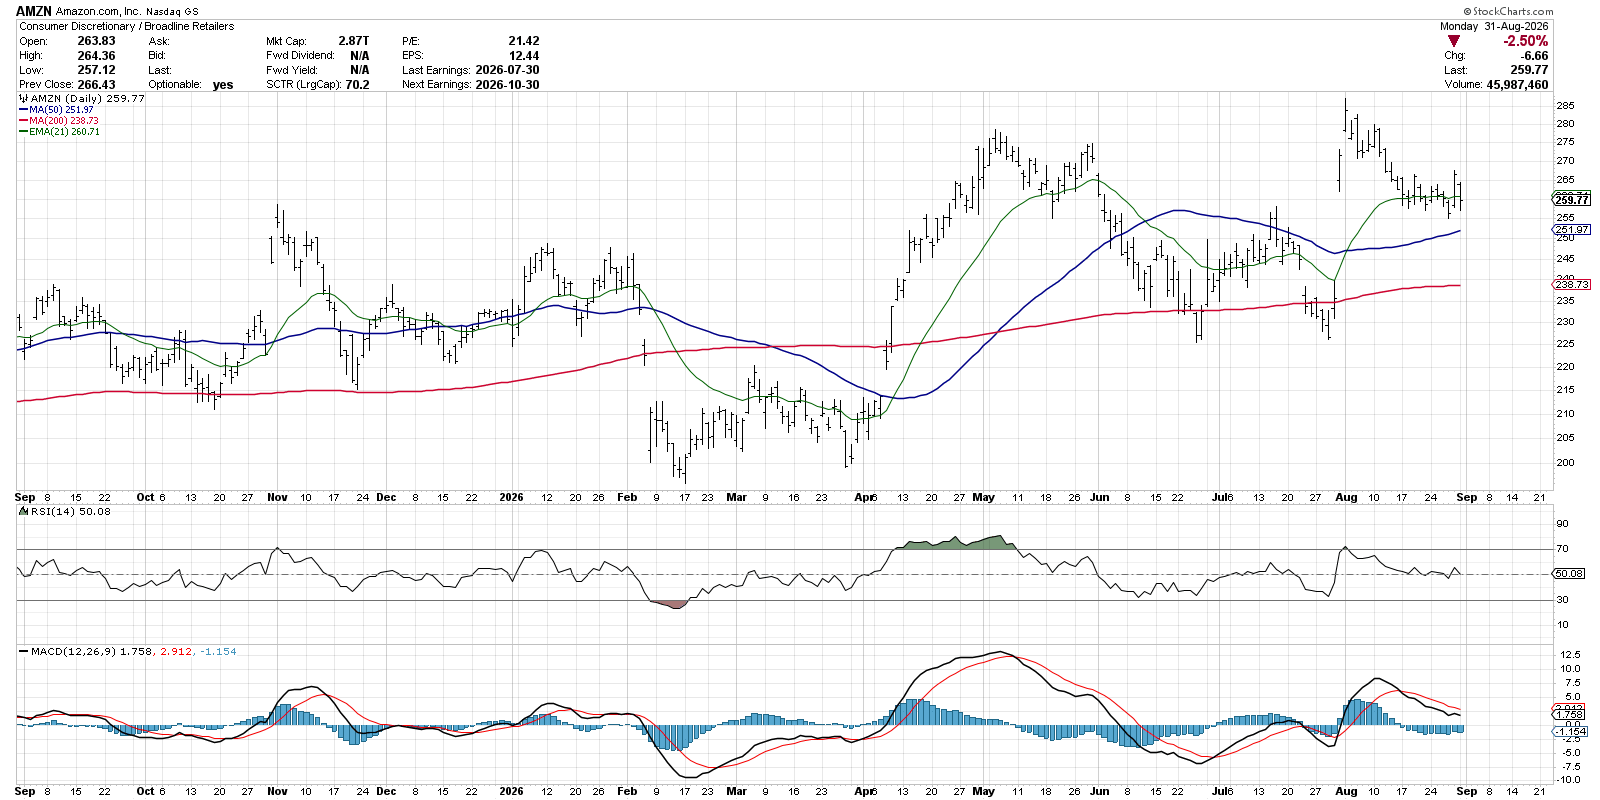
In an uptrend, the RSI will usually become overbought early in the uptrend phase. When the RSI exits the overbought condition and the MACD flashes a bearish reversal, then the uptrend is most likely ended. We can use a similar process for downtrends, using oversold conditions and bullish reversals to confirm the end of the downward phase.
In my experience, technical analysis is not about predicting the future, but rather about observing changes in market dynamics. By combining leading and lagging indicators effectively, mindful investors can anticipate shifts and confirm reversals, bringing more discipline and accuracy to buy and sell decisions.
This question was featured on a recent episode of my daily market recap show, which you can find on my YouTube channel!
RR#6,
Dave
P.S. Ready to upgrade your investment process? Check out my free behavioral investing course!
David Keller, CMT
President and Chief Strategist
Sierra Alpha Research LLC
marketmisbehavior.com
https://www.youtube.com/c/MarketMisbehavior
Disclaimer: This blog is for educational purposes only and should not be construed as financial advice. The ideas and strategies should never be used without first assessing your own personal and financial situation, or without consulting a financial professional.
The author does not have a position in mentioned securities at the time of publication. Any opinions expressed herein are solely those of the author and do not in any way represent the views or opinions of any other person or entity.