Record Momentum: What MTUM’s Surge Says About Today’s Market

Key Takeaways
- MTUM’s historic outperformance suggests renewed risk appetite and strengthening market leadership trends.
- Semiconductor-driven gains highlight narrow leadership, but broader participation signals a healthier bull market.
- Momentum’s backward-looking nature offers opportunity, though rapid reversals remain a key risk.
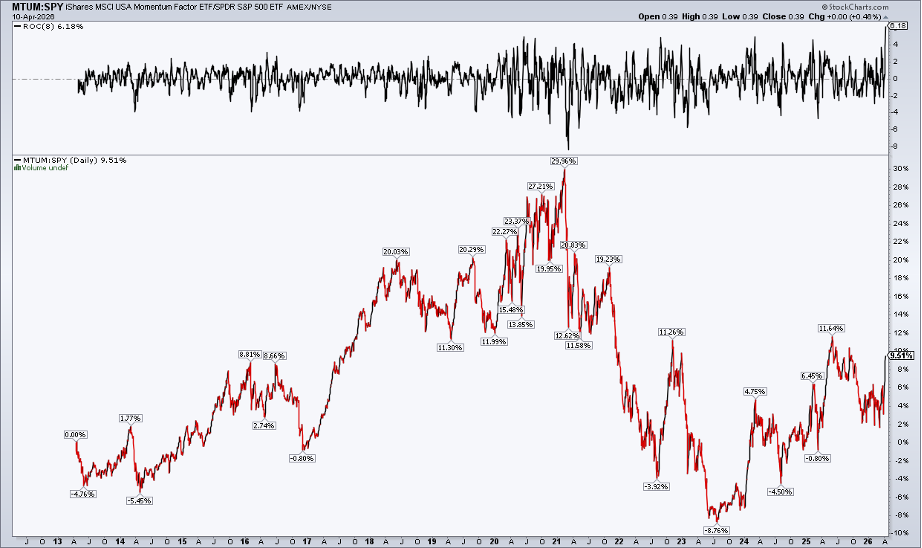
The momentum factor is back. The iShares MSCI USA Momentum Factor ETF (MTUM) just scored its best eight-day relative winning streak versus the S&P 500 in its history (since 2013). The 6.2-percentage-point alpha burst comes as geopolitical tensions eased in early April. Recall that the S&P 500 notched both an intraday and closing low on Monday, March 30.
So, should you hop on board the momentum train now, or wait for the next stop? After all, oil is back on the rise this week amid renewed hostilities between the U.S. and Iran. I’m not about making geopolitical predictions but, rather, examining how MTUM’s current makeup, historical trends, and other indicators support a more well-rounded trading thesis. Let’s unpack those.
A Surge Fueled by Semiconductors
First, MTUM (like many factor funds) is routinely rejiggered. Each May and November, the momentum portfolio adds to the most recent uptrending stocks while removing or reducing those that have lost steam. Today, the ETF holds almost 40% in Technology, Media, and Telecom (TMT).
Of course, the current tech composition matters more than ever, with massive gains in memory/storage and generational losses in software. MTUM’s top 10 positions include mainly chip companies: Broadcom (AVGO), Micron (MU), NVIDIA (NVDA), Lam Research (LRCX), and AMD (AMD). No doubt, last week’s 11% semiconductor rise was the primary MTUM tailwind.
Know What You Own (And That It Will Change)
Peter Lynch says, “Know what you own, and why you own it.” Indeed, MTUM is a decent HALO (heavy-asset, low-obsolescence) product at the moment. The factor itself also provides insights into the S&P 500’s direction.
I want to guide you to StockCharts’ Market Summary page, which offers a wealth of information to help traders make more informed investing decisions. Scroll down about a third of the way to the “Key Ratios” section, where you’ll find tabs for Market Cap, Offense vs. Defense, U.S. Factors, and Global. Select U.S. Factors, then click Momentum vs. Core (S&P 500).
Reading the MTUM:SPY Signal
Below, I took the MTUM:SPY chart back five years and noticed a few revealing features.
First, the latest outperformance stretch brings the factor closer to its multi-year high range from late 2022 to the middle part of last year. This thrust rhymes with the liftoff from March through May 2025, a time when geopolitical uncertainty kept volatility elevated. The relative chart peaked well before even tech stocks’ October high. Could it be a leading indicator today? Perhaps. At the very least, MTUM:SPY is a performance chart to bookmark.
Second, going back further in time, MTUM:SPY rallied sharply to begin 2024. That was in the middle of the rally that began in late 2022 (and before the tariff-induced selloff in March-April 2025). Once again, the AI megatrend played an important role in the spurt.
The Risk of Looking Backward
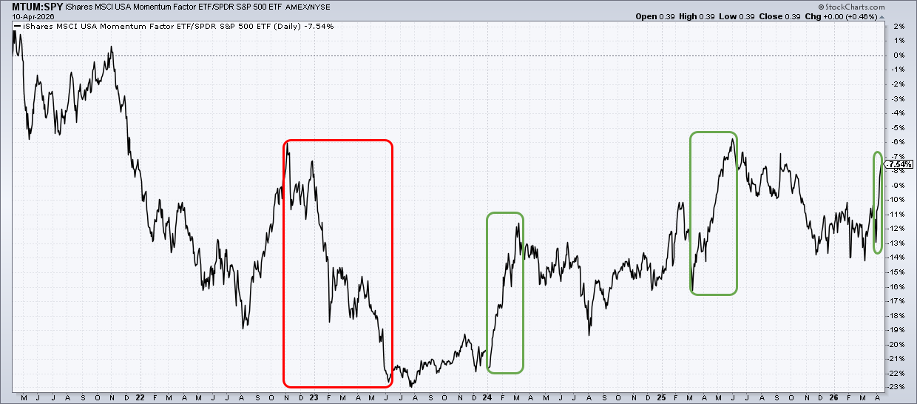
For the third feature, I want to flag a cautionary tale with a backward-looking factor such as momentum. Alpha can quickly be erased when trends change. While the factor can help spot market inflections during corrections, periods like late 2022 can be perilous for active investors.
The 2022 bear market’s climactic ending came about a month before MTUM began its rebalancing process. As a result, its portfolio shifted into defensive areas just as the S&P 500’s bullish reversal began. For now, MTUM:SPY boasts higher highs and higher lows dating back to mid-2023. So it’s reasonable to assert that the June 2025 peak will be eclipsed.
Beyond Momentum: Confirming Indicators
Finally, what are those “other indicators” I mentioned? There are many, but StockCharts built something to capture the biggest U.S. stock market X-factors. It’s called the “Ultimate S&P 500 Chart,” and you can find it by clicking the Charts button on the right side of the “Key Ratios” panel in the Market Summary page.
At the top is a two-year S&P 500 zoom, with the 50-day and 200-day moving averages plotted (notice last Friday’s weekly close above both trend-indicator lines). Below are market-internal gauges and key ETF ratio charts. Each tells its own part of the market’s story, serving as a guide for traders to assess trends and manage risk.
A Broader Market Endures
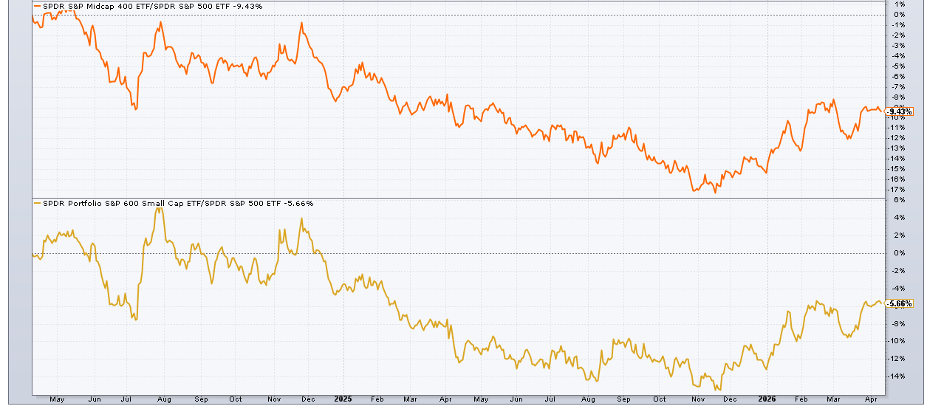
Two of those charts stand out: MDY:SPY and SPSM:SPY (mid-caps vs. large-caps and small-caps vs. large-caps). They bottomed last November, with MDY:SPY just below its March 1 high and SPSM:SPY roughly matching its February peak last week. Although we like to see a few large-cap themes lead a bull market, it’s a clear risk-on signal when SMIDs outperform. Quietly, the broadening trade has been working once again, albeit with a modest late-Q1 stumble.
I encourage traders to revisit the Ultimate S&P 500 Chart periodically, perhaps weekly or at each month’s close.
Momentum in a Volatile World
For now, MTUM leans on the semiconductor trade. Amid all the chaos and uncertainty in the Middle East, volatility in the oil patch, and choppy interest rate swings, the bull market's leading theme remains resilient.
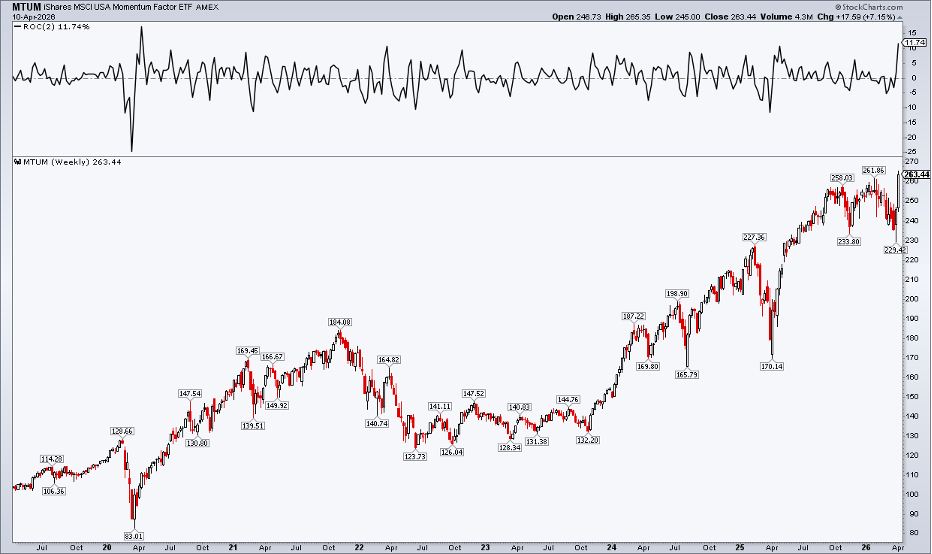
As such, MTUM settled at a new all-time high last Friday, soaring 11.7% over the previous two weeks (its best rally since April 2020).
The Bottom Line
Momentum steadily climbed the S&P 500 equity factor leaderboard in March and early April. The ETF entered this week at a record high, with intense near-term absolute and relative returns.
I take it as a bullish sign, but no indicator should be used in isolation. Combining MTUM:SPY with other technical signals is a better way to navigate today’s volatility and high intra-market dispersion.
Disclaimer: This blog is for educational purposes only and should not be construed as financial advice. The ideas and strategies should never be used without first assessing your own personal and financial situation, or without consulting a financial professional.