SPX 7000: Evaluating the Past, Present, and Future

The S&P 500’s dramatic break above the 7000 level represents a resurgence in optimism and an impressive recovery off the March low. This push above the previous peak from January and February was significant enough to cause me to play a trumpet fanfare on my daily market recap show!
With encouraging news out of the Middle East, along with a likely new uptrend phase for risk assets, investors are left to question the sustainability of this new uptrend. Today, we're going to talk about the upside gap in early April that set the stage for this week's breakout, discuss how we can measure the strength of this trend using our Market Trend Model, and review some of the key breadth indicators that could help evaluate whether this uptrend has staying power.
The Past: An Upside Gap Above a Key Fibonacci Level
Before breaking down this week’s risk-on move for stocks, we need to first understand the importance of the upside gap from earlier in April. Once an initial ceasefire between the U.S. and Iran was announced, the S&P 500 understandably spiked higher to push above 6750. This upside gap was meaningful because it also completed a move above the final Fibonacci retracement level.
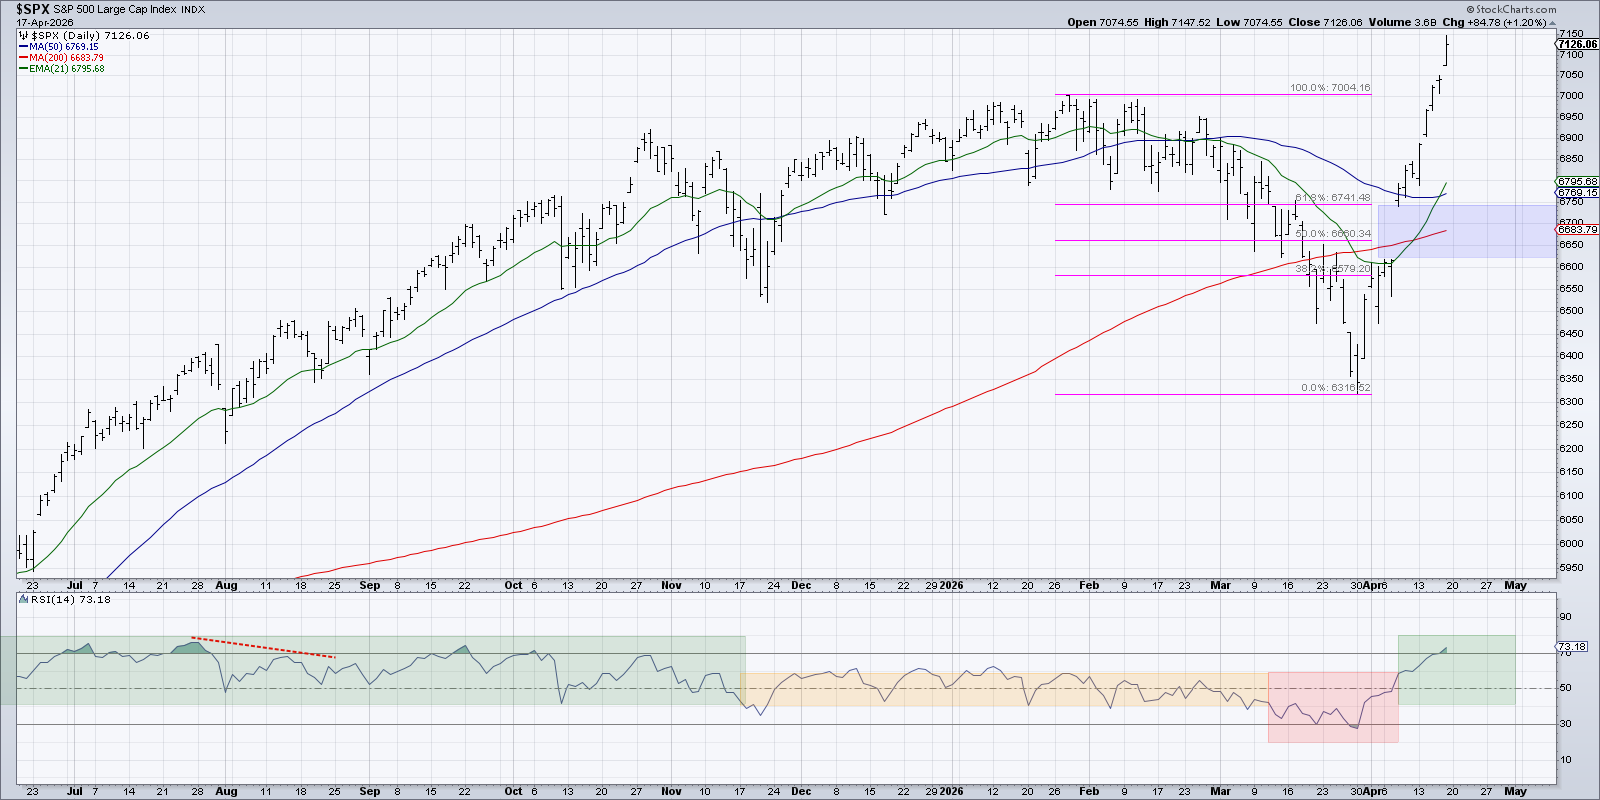
A Fibonacci framework using the January high and the March low will find a 61.8% retracement level around 6741. As the S&P 500 was moving higher into April, we saw the 200-day moving average, along with that Fibonacci level, as the most important resistance levels to overcome.
Following the gap to 6750, the S&P 500 continued to experience further upside, driven primarily by large-cap growth stocks resuming their uptrends. The RSI moved above 60, suggesting a new accumulation phase driven by renewed investor optimism.
The Present: A Breakout with Strong Trend Characteristics
This week’s breakout was significant in our work not just because of the move to new all-time highs, but also because it caused our Market Trend Model to turn bullish on the medium-term time frame. This implies that the current move is potentially part of a larger move higher for risk assets.
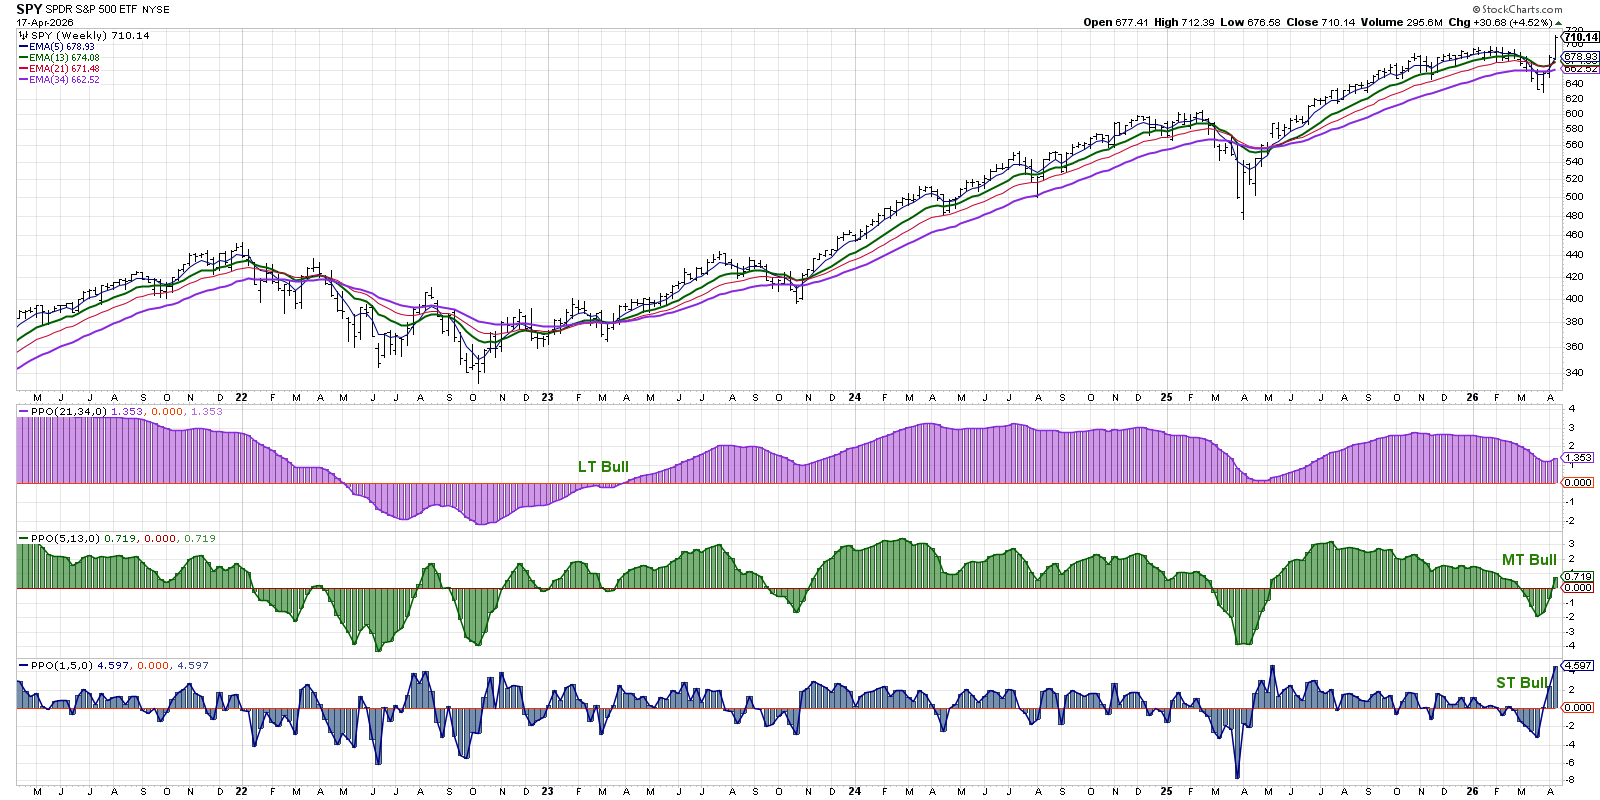
Our Market Trend Model uses weekly S&P 500 data to measure the market trend on three time frames. The medium-term model had turned negative at the end of February, acknowledging the severity of the price drop due largely to events in the Middle East. We’ve found that when the medium-term model is negative, it’s better to focus more on capital preservation than capital growth.
Our short-term model turned positive two weeks ago on the initial rally off the March low. This week’s strong uptrend in the S&P 500 was enough to finally turn the medium-term model back to a positive signal. A quick glance to the left on this chart shows the two most recent bullish reversals in the medium-term model, in May 2025 and November 2024. In both cases, that positive signal correctly implied further upside potential for equities.
The Future: Will Breadth Confirm the Recent Breakout?
Given the strength of this week’s price action, what would we need to see to help validate the breakout and confirm a bullish setup here? Generally speaking, it often comes down to breadth support. Are enough stocks participating in the uptrend phase to indicate broad investor optimism?
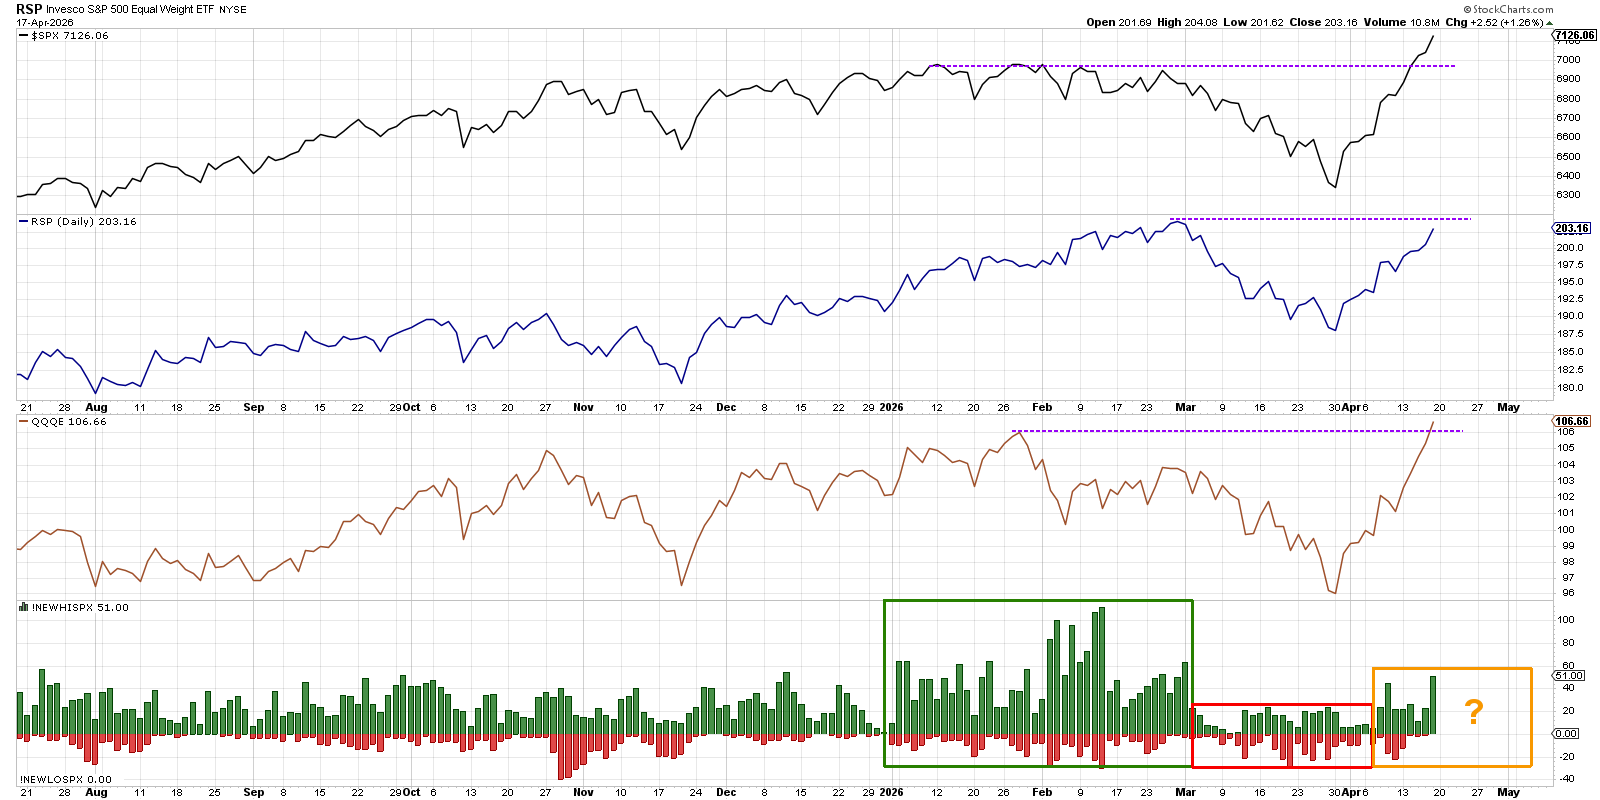
We’re showing the S&P 500 in the top panel, followed by the equal-weighted S&P 500 and the equal-weighted Nasdaq 100. Equal-weighted indexes and ETFs can be super valuable, as they remove the mega-cap and growth overweight that is present in the regular cap-weighted S&P 500.
While the S&P 500 established a new closing high earlier in the week, it wasn’t until Friday’s close that the equal-weighted Nasdaq confirmed its own breakout. Going into next week, we’ll be watching to see if the equal-weighted S&P 500 will follow suit, which would serve as an important confirmation to the bullish thesis.
In the bottom panel, we’re tracking the number of new 52-week highs for the S&P 500 members. Back in January and February, we observed a generally positive structure with plenty of new highs and very few new lows. In March, we tracked a more bearish configuration, formed by a fairly small number of both new highs and new lows. So far in April, we’re noting an increasing number of new highs, with about 10% of the S&P 500 members achieving a new 52-week high on Friday’s session.
This week’s breakout above SPX 7000 represents a strong continuation of the upside gap we observed earlier this month. Our Market Trend Model appears to confirm the significance of this breakout, flashing a similar signal to previous bullish phases. Now it’s all about confirmation, where equal-weighted indexes and other breadth indicators could give us even further confidence of market upside as we progress through Q2.
For a review of these as well as others to watch as we track the S&P 500’s dramatic move above 7000, check out my weekly show on StockCharts TV!
RR#6,
Dave
P.S. Ready to upgrade your investment process? Check out my free behavioral investing course!
David Keller, CMT
President and Chief Strategist
Sierra Alpha Research LLC
marketmisbehavior.com
https://www.youtube.com/c/MarketMisbehavior
Disclaimer: This blog is for educational purposes only and should not be construed as financial advice. The ideas and strategies should never be used without first assessing your own personal and financial situation, or without consulting a financial professional.
The author does not have a position in mentioned securities at the time of publication. Any opinions expressed herein are solely those of the author and do not in any way represent the views or opinions of any other person or entity.