How to Spot Opportunity After a Sharp Market Rebound
April is Financial Literacy Month, and if there’s one thing this month has reminded us, it’s that the stock market can throw a curveball when you least expect it.
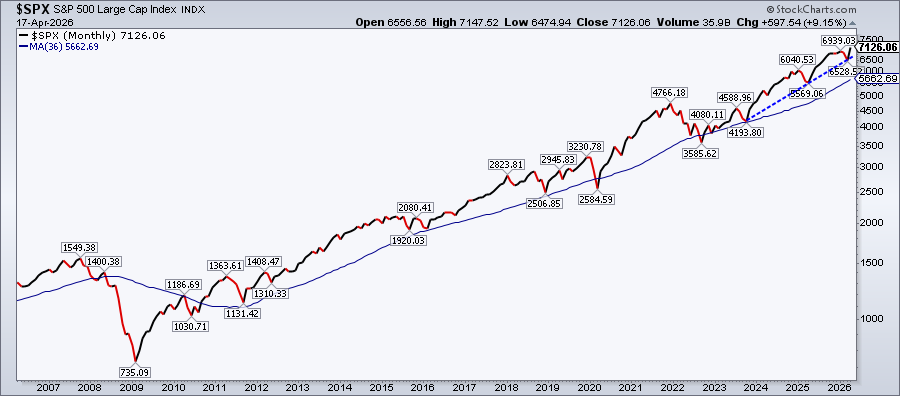
After hitting a low on March 30, the stock market mostly moved higher. There was still plenty of uncertainty early on as the S&P 500 struggled to break above its 200-day moving average, but, on April 8, the index gapped above it and never looked back. By Friday, the S&P 500 ($SPX) and Nasdaq Composite ($COMPQ) posted record closes on Friday, and small- and mid-cap stocks joined the rally as well.
There’s a lot we can take away from such a sharp move, but one lesson stands out: never lose sight of the long-term trend.
In the 20-year monthly chart of the S&P 500, if you look at where it touched the 36-month moving average in October 2023, you can draw an upward-sloping trendline that connects the two significant lows. We’ll need to see if a third significant low touches this trendline but, in the meantime, the long-term trend is still up. And when the broader trend is rising, pullbacks can be opportunities to pick up some long positions at more attractive prices.
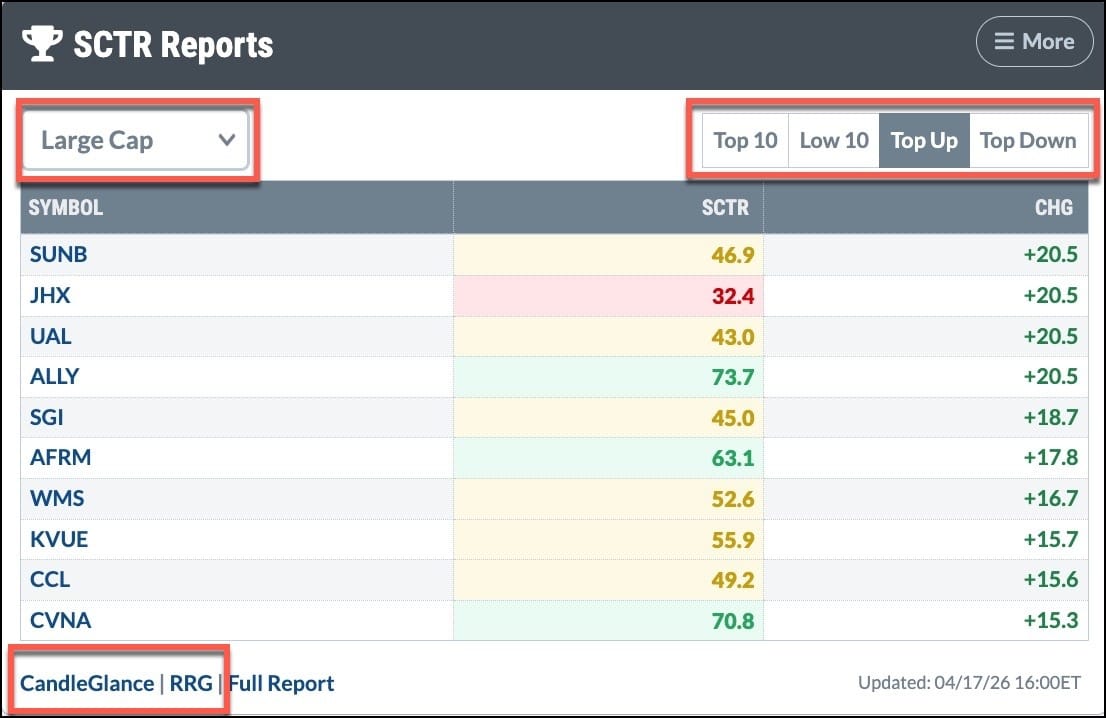
So, which stocks should you be considering? When the market moves up this quickly and the large-cap growth stocks have already surged, it can feel like you’ve missed out on the move. But not all stocks have fully recovered pre-war losses. One way to spot those that still have room to run is to view the SCTR Reports panel on your Dashboard.
Instead of looking at the default Large Cap, Top 10 tabs, switch to the Top Up tab. Here you’ll find stocks that are starting to make big moves.
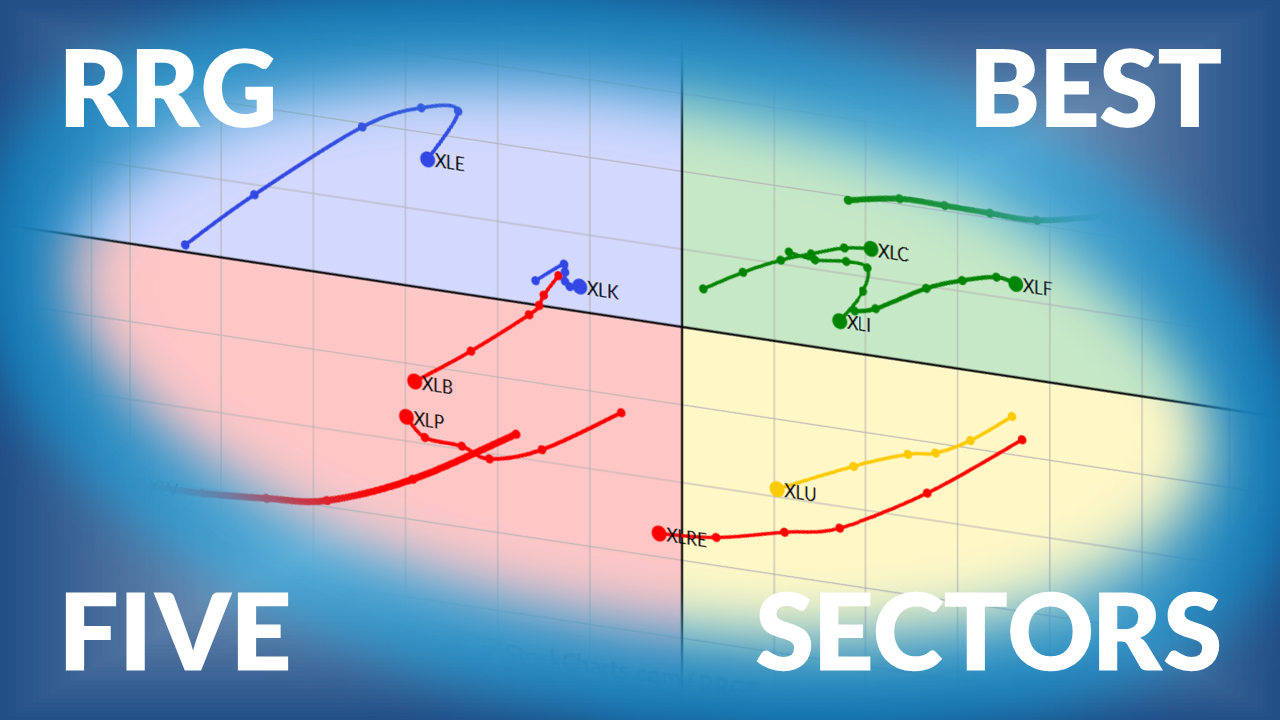
From there, select CandleGlance to see the charts for all stocks on the list. Then look at the RRG chart to see which of the stocks are leading, improving, lagging, or weakening. Used together, these views give you a clearer picture of which stocks are worth analyzing further.
Try this exercise with other asset groups, such as small- or mid-caps, which have also been showing strength. There’s more to these reports than numbers. A deeper look can give you valuable insight into what’s really going on beneath the surface of the price action.
With more than a week still left in April, I encourage you to focus on one tool in the StockCharts platform and really get to know it. Use our AI search feature in ChartSchool and the Support Center pages to learn everything you can about that tool. Financial Literacy Month is a great time to sharpen your financial knowledge. A small step can turn into a lifelong investing journey.
Before we let you go, here’s a little secret.
Our Spring Special officially launches on April 20, but as a ChartWatchers subscriber, you get a VIP sneak peek and early access.
👉 Go ahead, click here and grab your special rate while it's still hush-hush.
Have a wonderful weekend!