SPY & QQQ Get Headlines, But Small- & Mid-Caps Lead + A Master ChartList Offer

SPY and QQQ may be grabbing the headlines, but don't be fooled. Small- and mid-caps are leading the way, having held up better during the March decline and now trading near new highs after the April breakouts.
Today's report will compare performance for the major index ETFs and analyze the Russell 2000 ETF. Read until the end to see our offer for a Master ETF ChartList to jump-start your analysis process.
Small-Caps and Mid-Caps Outperforming SPY and QQQ
The summary table below shows performance for SPY, QQQ, and seven other major index ETFs. This table is sorted by the SMA(200) column, which shows the percentage above the 200-day SMA. The Russell Microcap ETF (IWC) is leading because it is 11.91% above its 200-day moving average. Small-caps are next, with the Russell 2000 ETF (IWM) and S&P SmallCap 600 SPDR (IJR) over 10% above their 200-day SMAs. SPY and QQQ, in contrast, are less than 5% above their 200-day SMAs.
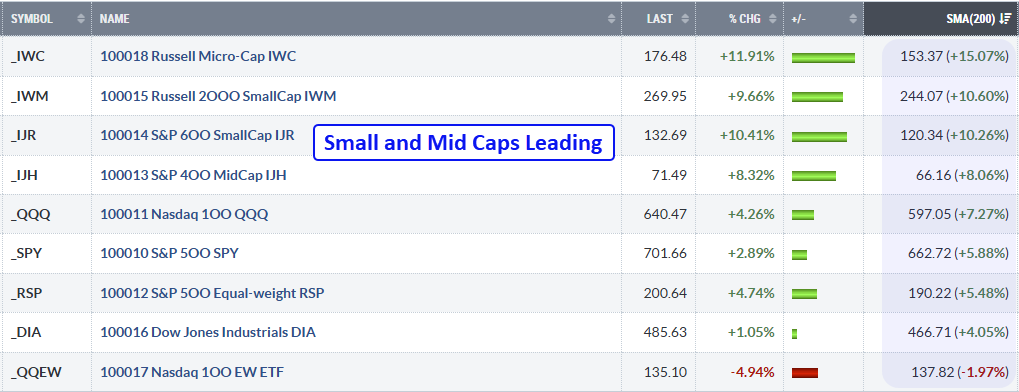
The %Chg column shows the year-to-date percentage gain/loss for each ETF. Again, the small- and mid-cap ETFs show much bigger gains. Note that the Nasdaq 100 Equal-Weight ETF (QQEW) is down around 5% year-to-date.
IWM Follows Through on Breakout Surge
The Russell 2000 ETF (IWM) held up better than SPY and QQQ in March. On the chart below, IWM fell to its 200-day SMA and closed below this key average for one day. The next day, it was back above it. SPY and QQQ, in contrast, clearly broke their 200-day SMAs and their November lows. Chartists can use the November lows to gauge relative chart performance. ETFs that held above their November lows performed better during the March declines. IWM held above its November low, and this showed relative chart strength.
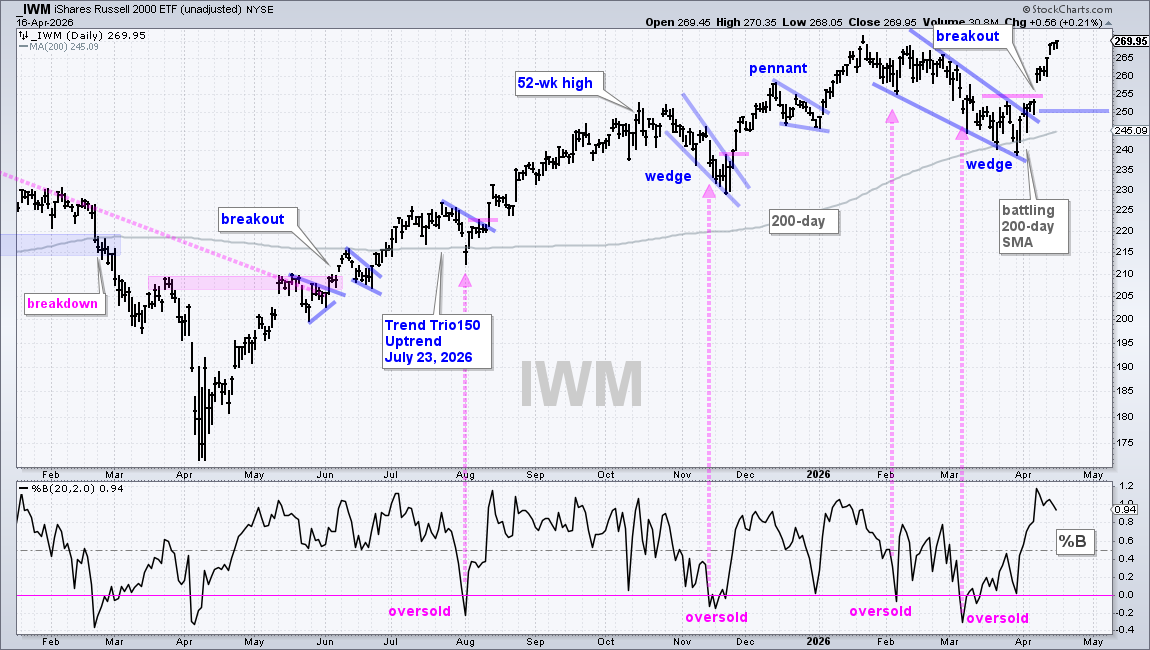
Not only did IWM show relative strength, but a bullish continuation pattern also formed on the price chart. TrendInvestorPro featured this setup in our report on April 7th. The falling wedge is typical for a correction within an uptrend. As long as the bigger trend is up, a pullback is considered a correction within the uptrend. %B became oversold in early March, but broad market weakness weighed as the correction extended. This downswing reversed with the gap-breakout on April 8th. Strong followthrough further validates the breakout.
It is now important that the breakout holds. A close below 250 would fill the gap, negate the breakout, and call for a re-evaluation.
Get the Analytical Edge with Our Master ETF ChartList
A robust analysis process starts with an organized and comprehensive ChartList. This is where we run scans, view performance tables, browse CandleGlance charts and perform detailed chart analysis. TrendInvestorPro subscribers get access to our Master ETF Chartlist, which has over 290 ETFs organized in a logical top-down manner. Sections include broad index ETFs, sectors, industry groups, bonds, commodities, crypto, currencies, and alternatives. Below is a screen shot showing some of the ETFs and groups covered.
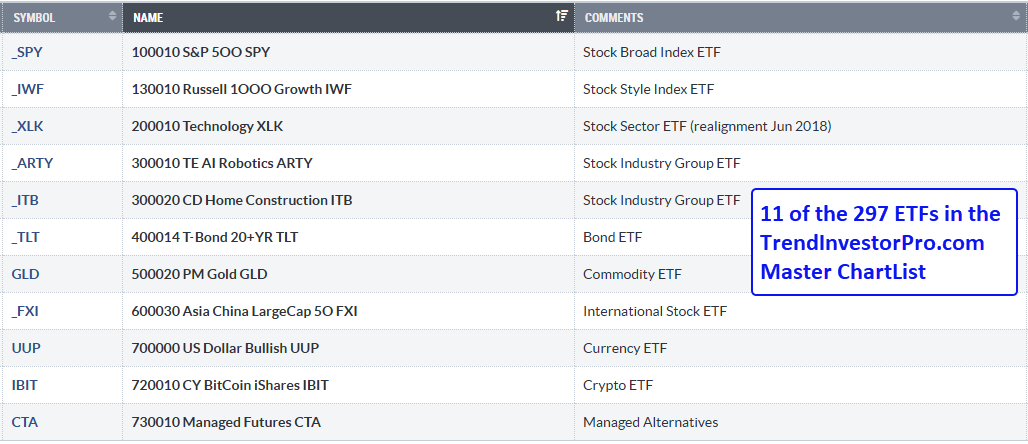
Click here to take a trial to TrendInvestorPro and get this list. Note that you must be a StockCharts member with a Extra subscription to receive the ChartList.