S&P 500 at a Crossroads: Four Scenarios for Year-End

This week has surfaced a strong inverse relationship between technology and basically all the other economic sectors. Either tech is up and everything else is down, or tech is down and everything else is up!
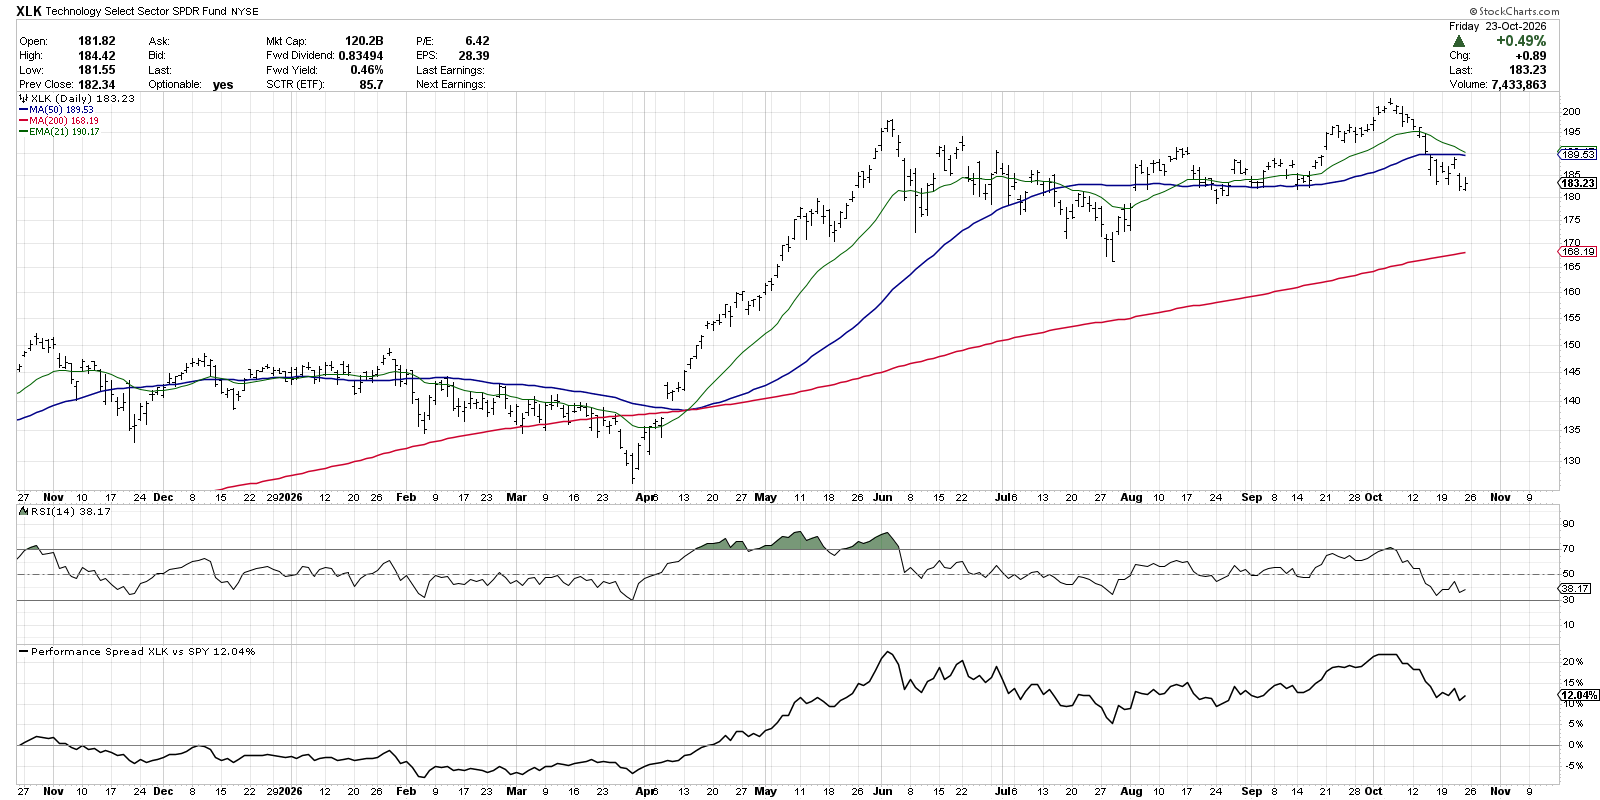
But despite the volatility that we’ve observed in the daily action on the Market Summary page, the Technology Select Sector SPDR Fund (XLK) appears to be in a confirmed distribution phase. The XLK is now below its 50-day moving average, and the momentum is definitely on the bearish side.
Right now, investors are grappling with seemingly opposing market forces. On the bullish side, we have the ever-present AI euphoria and seasonal strength which often occurs in Q4 of a midterm election year. On the bearish side, interest rates and inflation remain elevated, and volatility is beginning to bubble above the crucial 20 level.
So which side will take control between now and year end?
Today we’re going to discuss four different scenarios for the S&P 500 ($SPX) over the next six weeks, describe the conditions that would help us validate each of the four scenarios, and then assign probabilities to each potential outcome.
The daily chart of the S&P 500 index has been decidedly sideways for the last three months. The main equity benchmark reached 7800 in early August and achieved the 7850 level in early October. But every push to a new high has been followed by a retrenchment back in the trading range between 7600 and 7800.
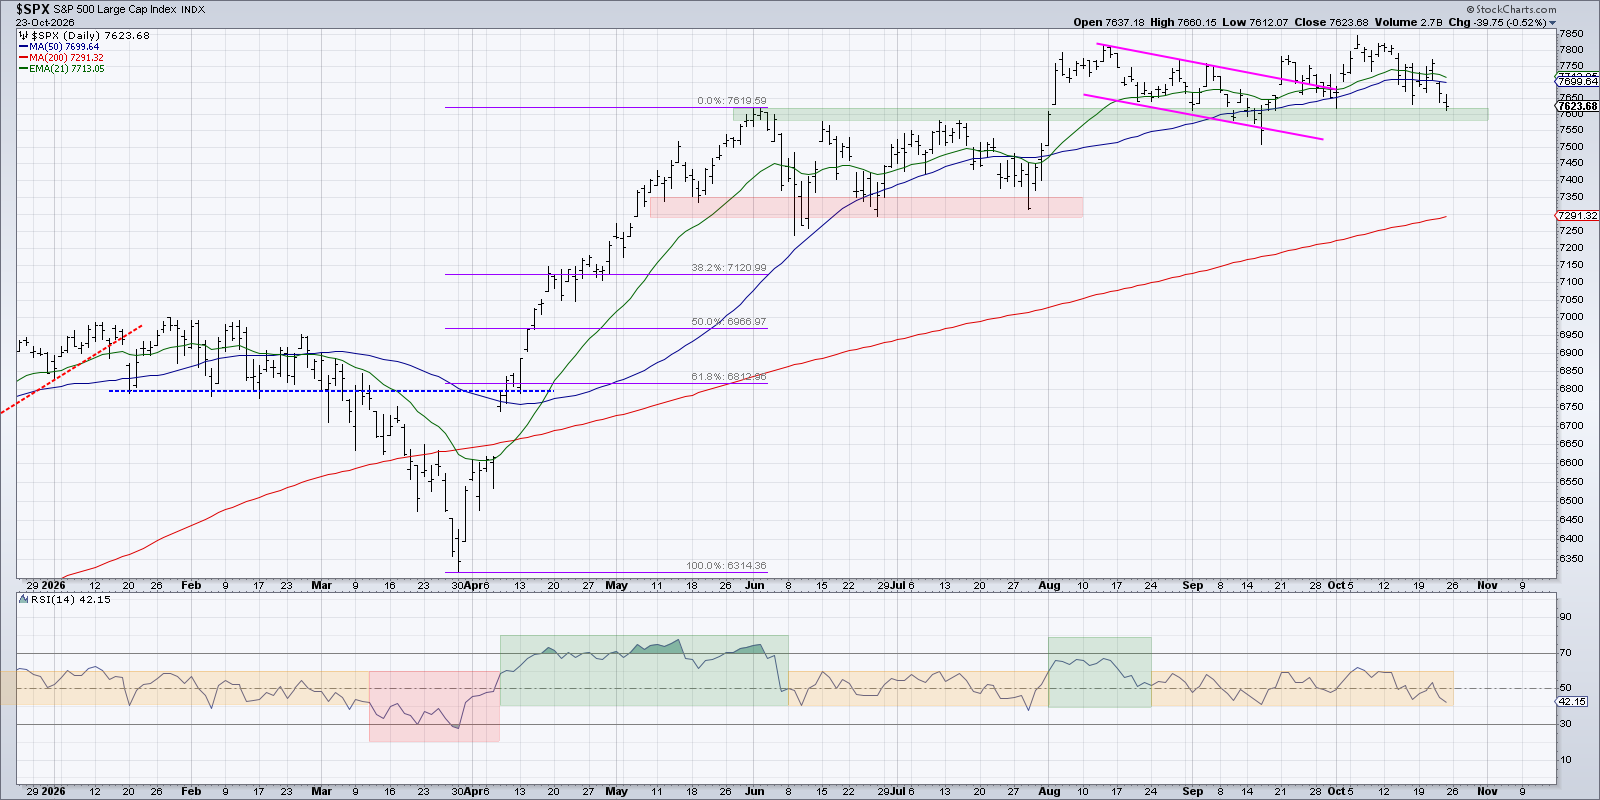
Going into next week, with a bunch of earnings queued up for key growth stocks, the S&P 500 is actively testing our “line in the sand” at 7600. The RSI, which has remained neutral between 40 and 60 since August, is once again threatening the lower end of that neutral range. With that in mind, let’s review the four scenarios for the S&P 500 between now and mid-December 2026.
If this is your first time with this exercise in “probabilistic analysis”, here’s what we’re trying to do together:
- Consider all four potential future paths for the index, think about what would cause each scenario to unfold in terms of the macro drivers, and reflect on what signals/patterns/indicators would confirm the scenario.
- Decide which scenario you feel is most likely, and why you think that's the case.
- Think about how each of the four scenarios would impact your current portfolio. How would you manage risk in each case? How and when would you take action to adapt to this new reality?
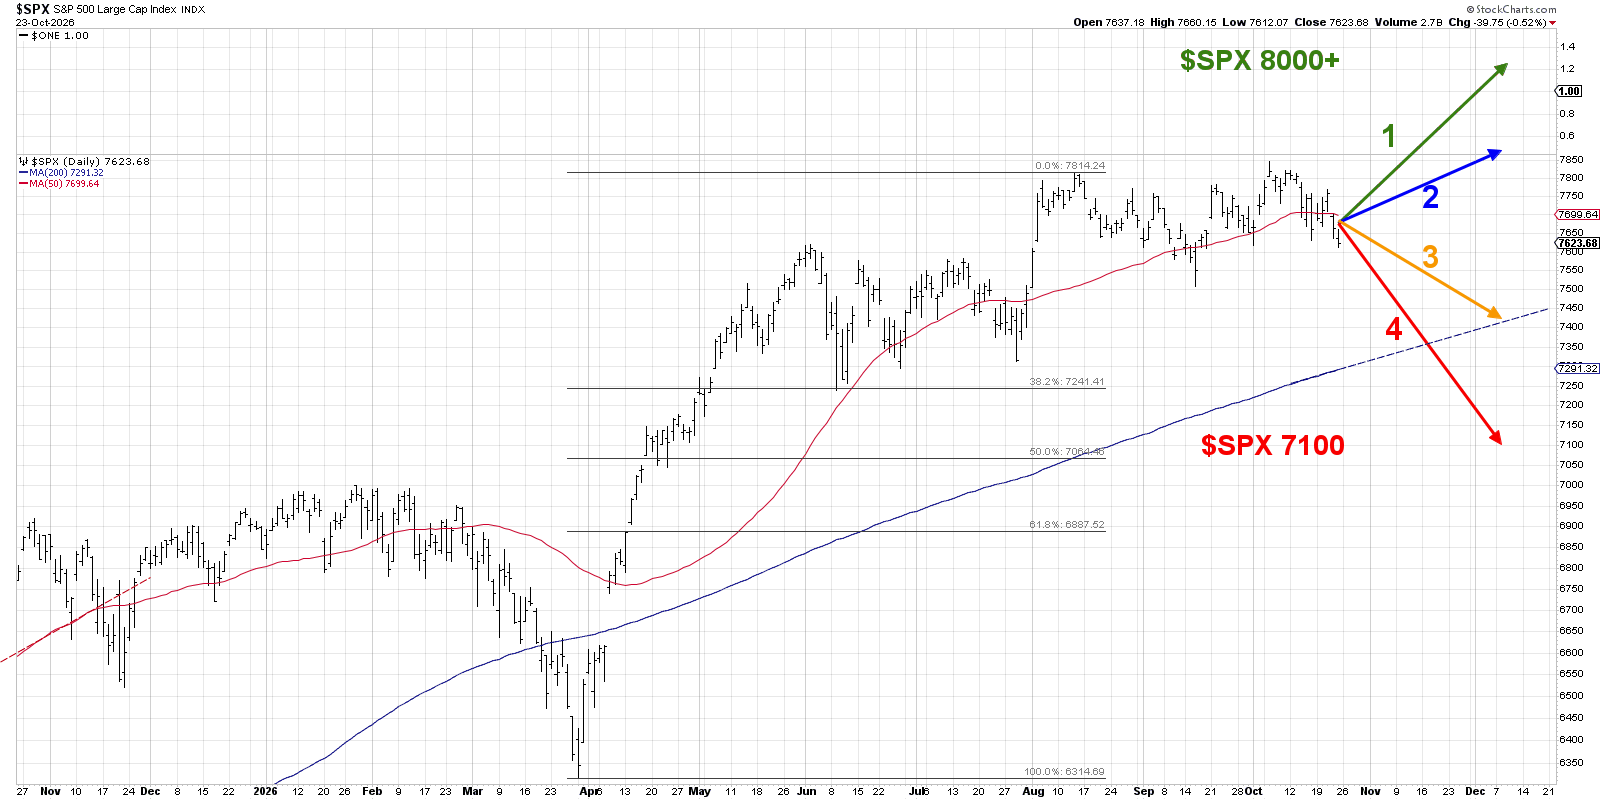
Here’s the chart we’ve created to illustrate the four scenarios. You’ll find a breakdown of each scenario below, along with the probability I’ve assigned for each scenario. Disagree with me? Jump over to my YouTube channel and drop a comment to tell me why I’m wrong!
Let’s start with a super bullish outcome, where the SPX resumes a strong uptrend phase to achieve fresh new all time highs into December.
Scenario 1: The Super Bullish Scenario
The S&P 500 breaks out of its recent consolidation and resumes a powerful uptrend, pushing above 8000 to new all-time highs by mid-December. This scenario would require a significant resurgence in technology leadership, particularly semiconductors and AI-related stocks, along with an expansion in the number of stocks making new 52-week highs.
Stronger earnings, renewed investor optimism, or a more supportive Fed could provide the catalyst. We'd likely see cryptocurrencies rally, Treasury yields move higher, and growth stocks reclaim their leadership role as the bull market accelerates into year-end.
Dave’s Vote: 10%
Scenario 2: The Mildly Bullish Scenario
The S&P 500 continues its gradual advance, maintaining the pattern of higher highs and higher lows that developed in September and early October. Technology stocks don't necessarily need to lead, but the recent breakdowns in AI-related names would need to stabilize. Meanwhile, improving trends in health care, financials, industrials, and consumer staples could provide enough broader market participation to keep the index moving higher.
This scenario would feature relatively healthy market breadth, with value and defensive sectors potentially outperforming growth, allowing the S&P 500 to grind higher without the explosive upside momentum of Scenario 1.
Dave’s vote: 25%
Scenario 3: The Mildly Bearish Scenario
The recent deterioration in technology stocks continues, with key growth names breaking additional support levels and dragging the major averages lower. The S&P 500 gradually declines toward its 200-day moving average, potentially around 7400 by early December.
In this scenario, we'd expect the VIX to rise above 20, credit spreads to widen, and Treasury bonds to rally as investors reduce exposure to growth stocks and seek more defensive positioning. Strength in utilities, consumer staples, and potentially gold could reinforce this risk-off environment. Importantly, this scenario assumes the 200-day moving average generally holds, potentially setting the stage for an impressive recovery in December.
Dave’s vote: 55%
Scenario 4: The Super Bearish Scenario
The S&P 500 enters a much more significant distribution phase, breaking decisively below its 200-day moving average and potentially falling toward 7100 by early December. Selling pressure spreads beyond technology and AI-related stocks, with weakness becoming increasingly broad-based across the equity market. The VIX could spike toward the 35 to 40 range, while persistent inflation, elevated crude oil prices, and uncertainty surrounding Fed policy could intensify investor concerns.
Defensive sectors may outperform on a relative basis, but even those areas could struggle in a widespread selloff. This scenario would resemble the challenging fourth quarter of 2018, potentially leaving investors waiting for a recovery above the 200-day moving average before becoming more constructive into 2027.
Dave’s vote: 10%
Which Scenario Gets Your Vote?
If I had to summarize the four paths:
- Scenario 1 assumes a return to leadership for technology and AI stocks, as the S&P 500 breaks above 8000 and pushes to new all-time highs.
- Scenario 2 envisions a slow and steady advance, with technology stabilizing and improving breadth helping the S&P 500 continue higher.
- Scenario 3 suggests a pullback toward the 200-day moving average around 7400, as growth stocks struggle and investors rotate toward defensive sectors and bonds.
- Scenario 4 assumes a major risk-off move, with the S&P 500 breaking below its 200-day moving average and potentially falling toward 7100 by early December.
By considering multiple outcomes before they occur, we're far less likely to be surprised by market behavior. More importantly, we can identify the signals that would increase or decrease the probability of each scenario and adjust our positioning accordingly.
So which scenario do you find most compelling?
RR#6,
Dave
P.S. Ready to upgrade your investment process? Check out my free behavioral investing course!
David Keller, CMT
President and Chief Strategist
Sierra Alpha Research LLC
marketmisbehavior.com
https://www.youtube.com/@DKellerCMT
Disclaimer: This blog is for educational purposes only and should not be construed as financial advice. The ideas and strategies should never be used without first assessing your own personal and financial situation, or without consulting a financial professional.
The author does not have a position in mentioned securities at the time of publication. Any opinions expressed herein are solely those of the author and do not in any way represent the views or opinions of any other person or entity.