Tech Stocks Are Getting Crushed. Where Is the Money Going?

Key Takeaways
- Technology stocks are under pressure, but Consumer Staples and Health Care are showing strength.
- Look beyond the major indexes to identify stocks holding up or trending higher.
- Use the StockCharts AI Scan Wizard to uncover strong stocks and narrow your choices.
It was another roller-coaster week on Wall Street following last Friday’s selloff. Stocks rebounded on Monday, but the recovery wasn’t convincing enough to suggest we were out of the woods. After that, Tuesday brought more of the same. Buyers stepped in, but the major indexes struggled to gain traction.
Wednesday offered some hope. The Nasdaq Composite ($COMPQ) and S&P 500 ($SPX) rallied following SpaceX (SPCX) earnings, and the outlook looked brighter after Meta Platforms (META) and Tesla (TSLA) reported better-than-expected earnings after the close.
Then came Thursday. The market had other plans, and technology stocks, especially semiconductors, took a beating. The VanEck Semiconductor ETF (SMH) plunged 6.06%. Technology finished the session as the day’s worst-performing sector.
Nasdaq Sends a Warning
Thursday’s price action is best captured in the daily chart of the Nasdaq. On Monday and Tuesday, the index respected the 50-day simple moving average (SMA) resistance. Wednesday’s rally pushed the Nasdaq above that level, but ran into resistance from its 21-day exponential moving average (EMA).
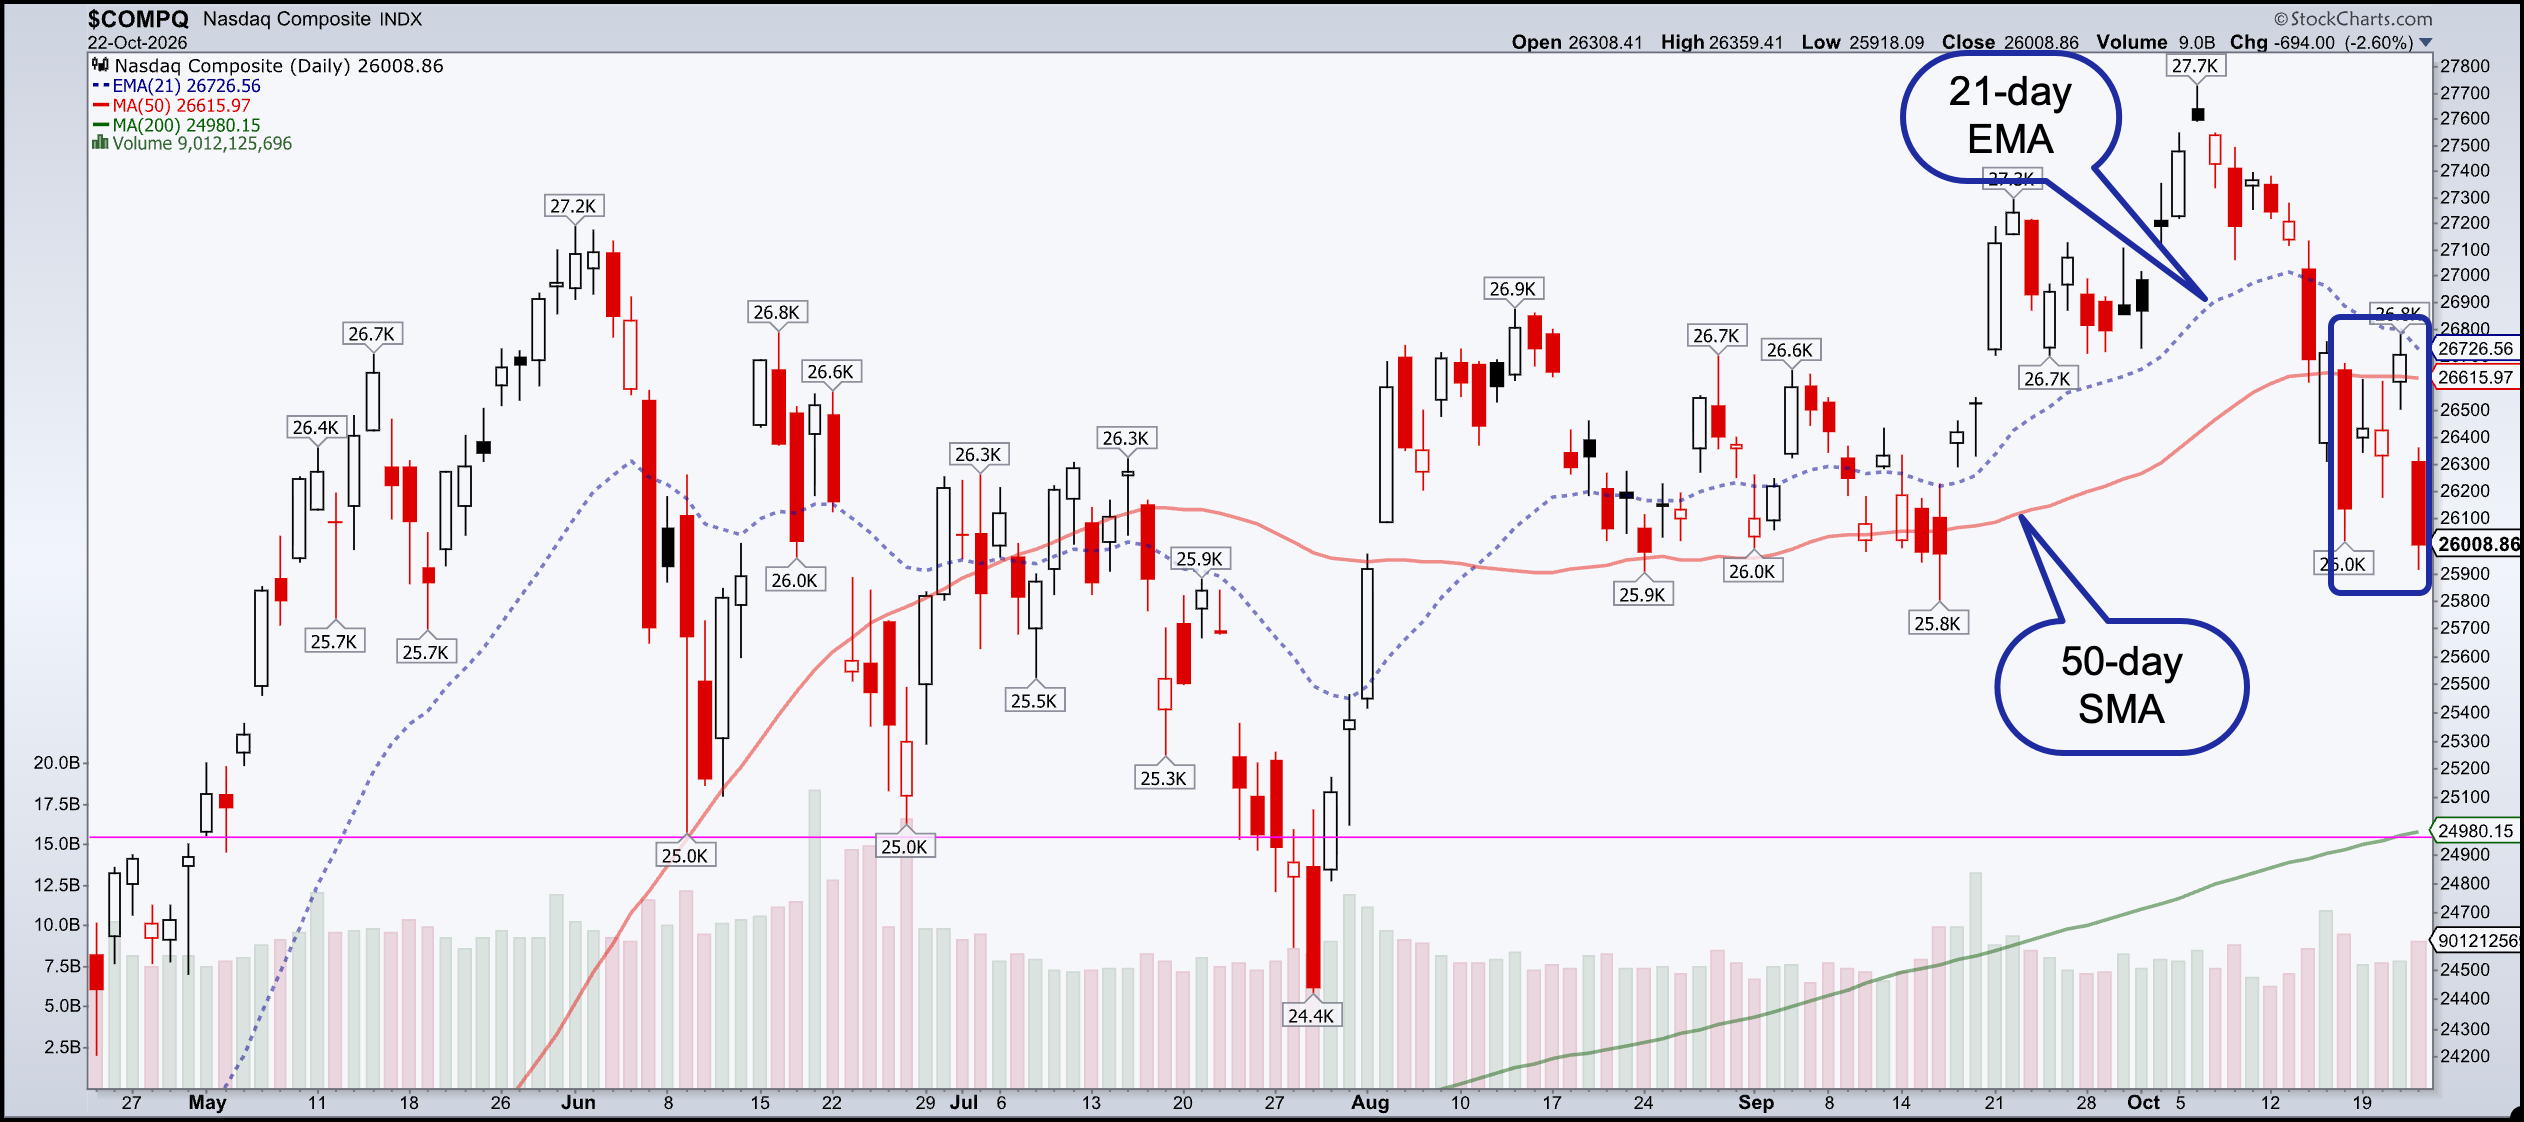
Thursday’s selloff erased that progress. The Nasdaq closed below last Friday’s low, which is concerning.
When cracks begin to appear in market leadership, investors naturally start looking for other places to put their money. And while technology stocks were getting hammered, there were some encouraging signs elsewhere. Bonds moved higher, several sectors attracted buyers, and the Consumer Staples and Health Care sector ETFs closed at record highs, meaning not everything is falling apart.
The Big Rotation
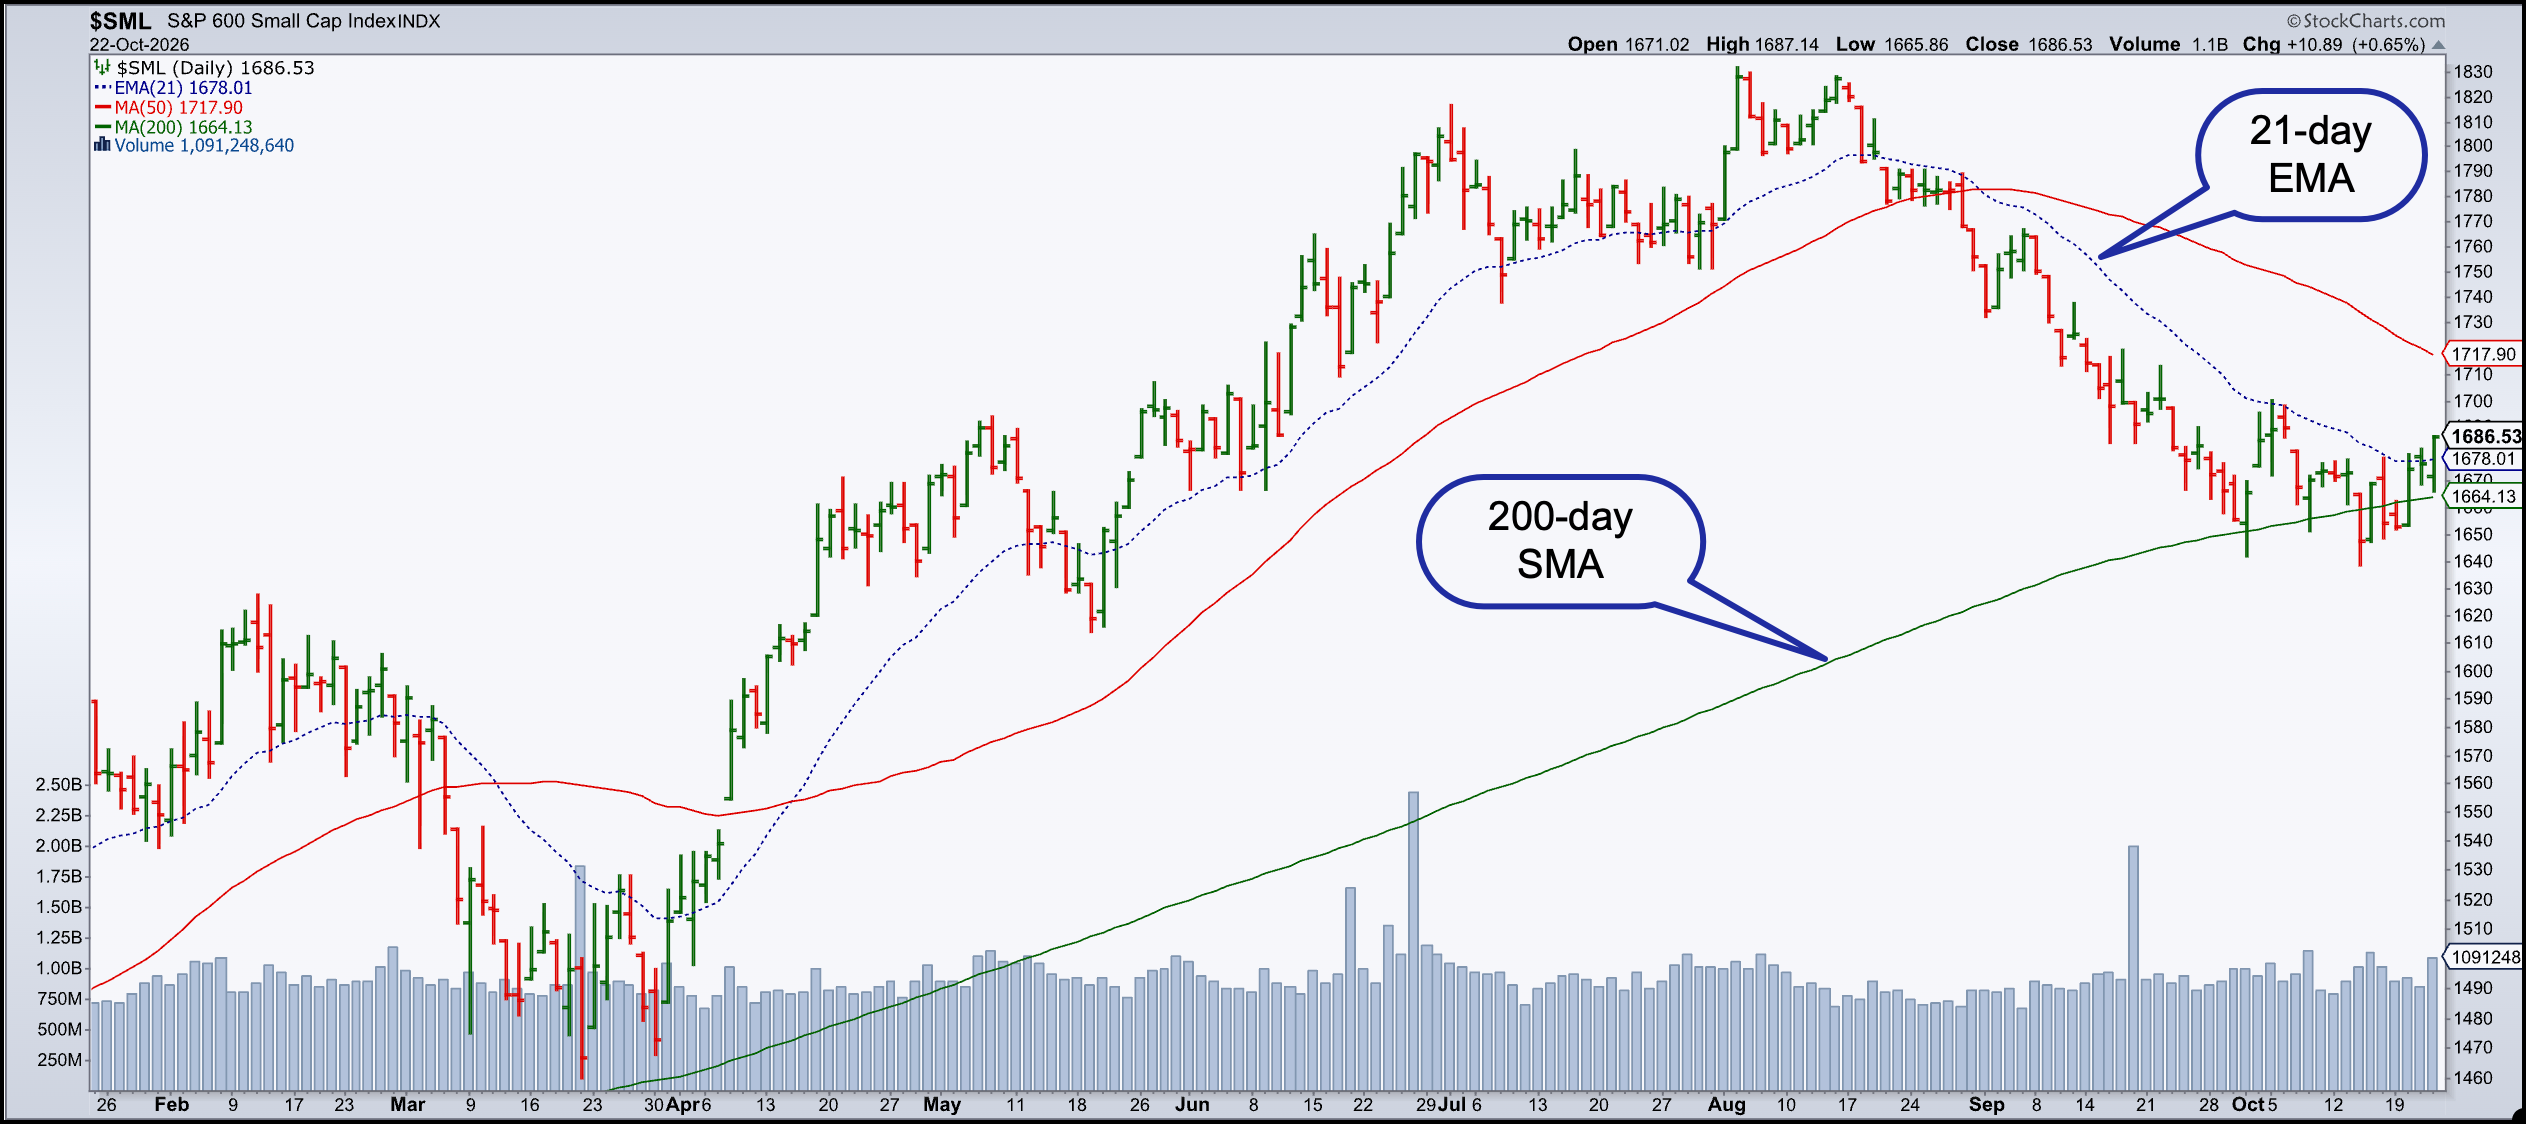
The S&P 600 Small Cap Index ($SML) appears to have found support at its 200-day SMA. The index has also climbed above its 21-day EMA on high volume.
Another interesting development is the improving performance of the S&P 500 Equal-Weighted Index ($SPXEW) relative to its market-cap-weighted counterpart. The chart of $SPX:$SPXEW helps to see this relationship. Over a one year period, the S&P 500 is underperforming the equal-weighted index by 0.48%.
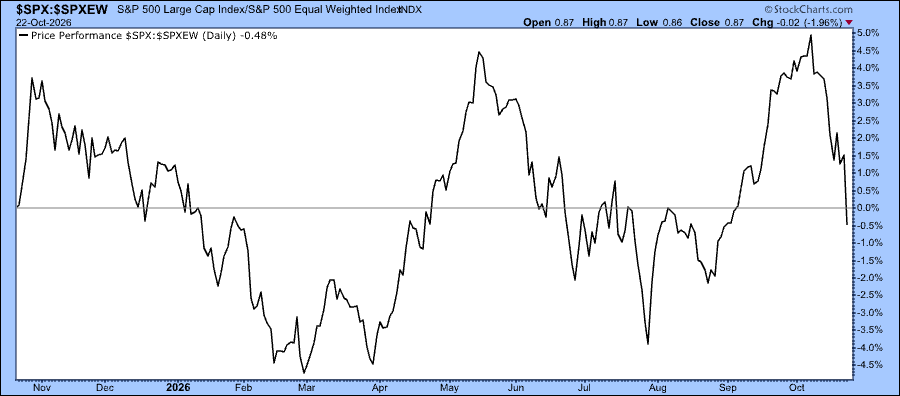
On Thursday, $SPXEW closed up 0.77% whereas the S&P 500 closed 1.21% lower. This suggests that other areas outside of the large-cap tech stocks are holding up better. And there’s more evidence of this relationship: when I ran the All-Time Highs Predefined Scan, it resulted in 39 stocks. That’s not a small number.
So, is it time to consider rotating your portfolio? If technology stocks continue to weaken into Friday’s close, it may be worth exploring opportunities in areas that are showing strength.
Which stocks deserve a closer look?
Let the AI Scan Do Its Job
This is where the StockCharts AI Scan Wizard can be especially helpful, as you can ask it to build a scan based on characteristics you’re looking for.
You can access the wizard by going through these menus:
Scans & Alerts > Advanced Scan Workbench > AI Wizard
I started by asking the Scan Wizard to find stocks in the Consumer Staples and Health Care sectors that are in an uptrend, have an ADX reading above 25, and trading volume greater than 300,000 shares. The scan returned 94 stocks. It’s encouraging to know there are several stocks trending higher while technology stocks face heavy selling pressure. But 94 stocks are still too many to go through.
Thus, I went back to the AI Scan Wizard and refined my request. I asked it to focus on large-cap, optionable stocks. Here’s the scan it created:
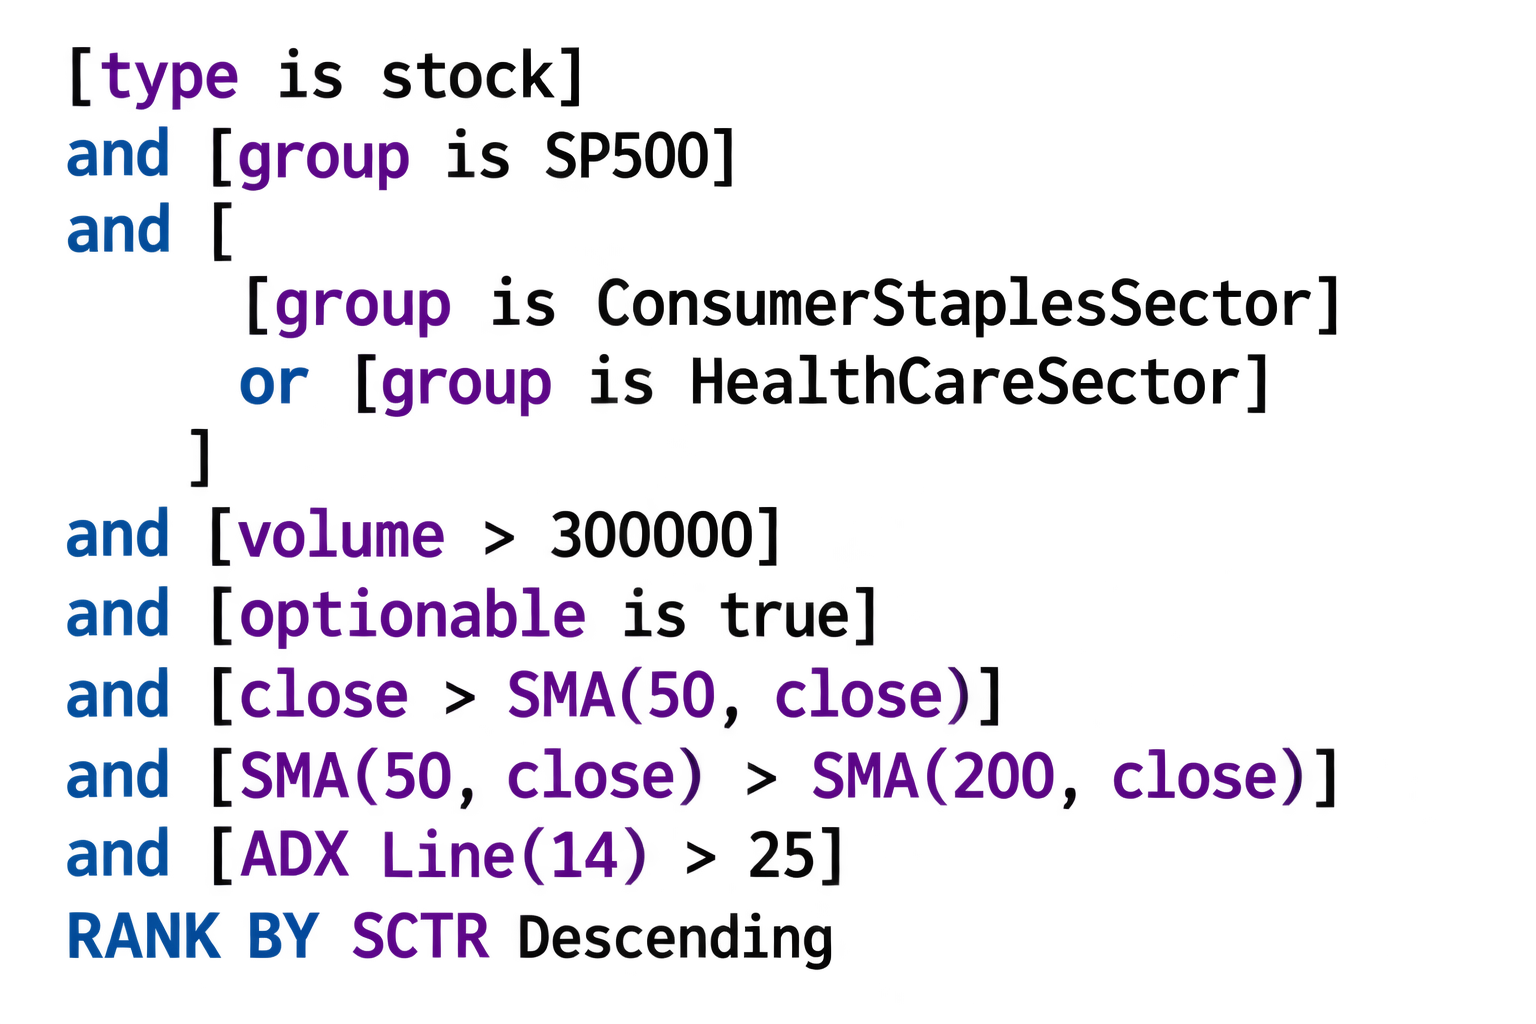
This scan resulted in a much more manageable 32 candidates. I saved the scan to my Your Scans and saved the results as a ChartList. I also scheduled the scan to run automatically at the close of each U.S. Trading day, with the results merged into the ChartList I created. This way, I can monitor stocks in the two sectors without running the same scan manually.
I’ll keep the scan running for as long as Consumer Staples and Health Care continue to perform well. If those sectors begin to weaken, I’ll unschedule it.
Note: Scheduled scans are only available to Extra and Pro members.
There is one more thing worth thinking about, though. As I reviewed the scan results, I noticed that several stocks had hefty price tags. This doesn’t mean you should rule them out, but it does give you a reason to think about other ways to gain exposure to these stocks.
Options offer an alternative.
One of the stocks that appeared in my scan was AbbVie, Inc. (ABBV), trading at around $285. If you subscribe to the OptionsPlay Add-on for StockCharts, you can explore other ways to express a bullish outlook. Pull up the ABBV chart, click the Options tab below it, and select the OptionsPlay button.
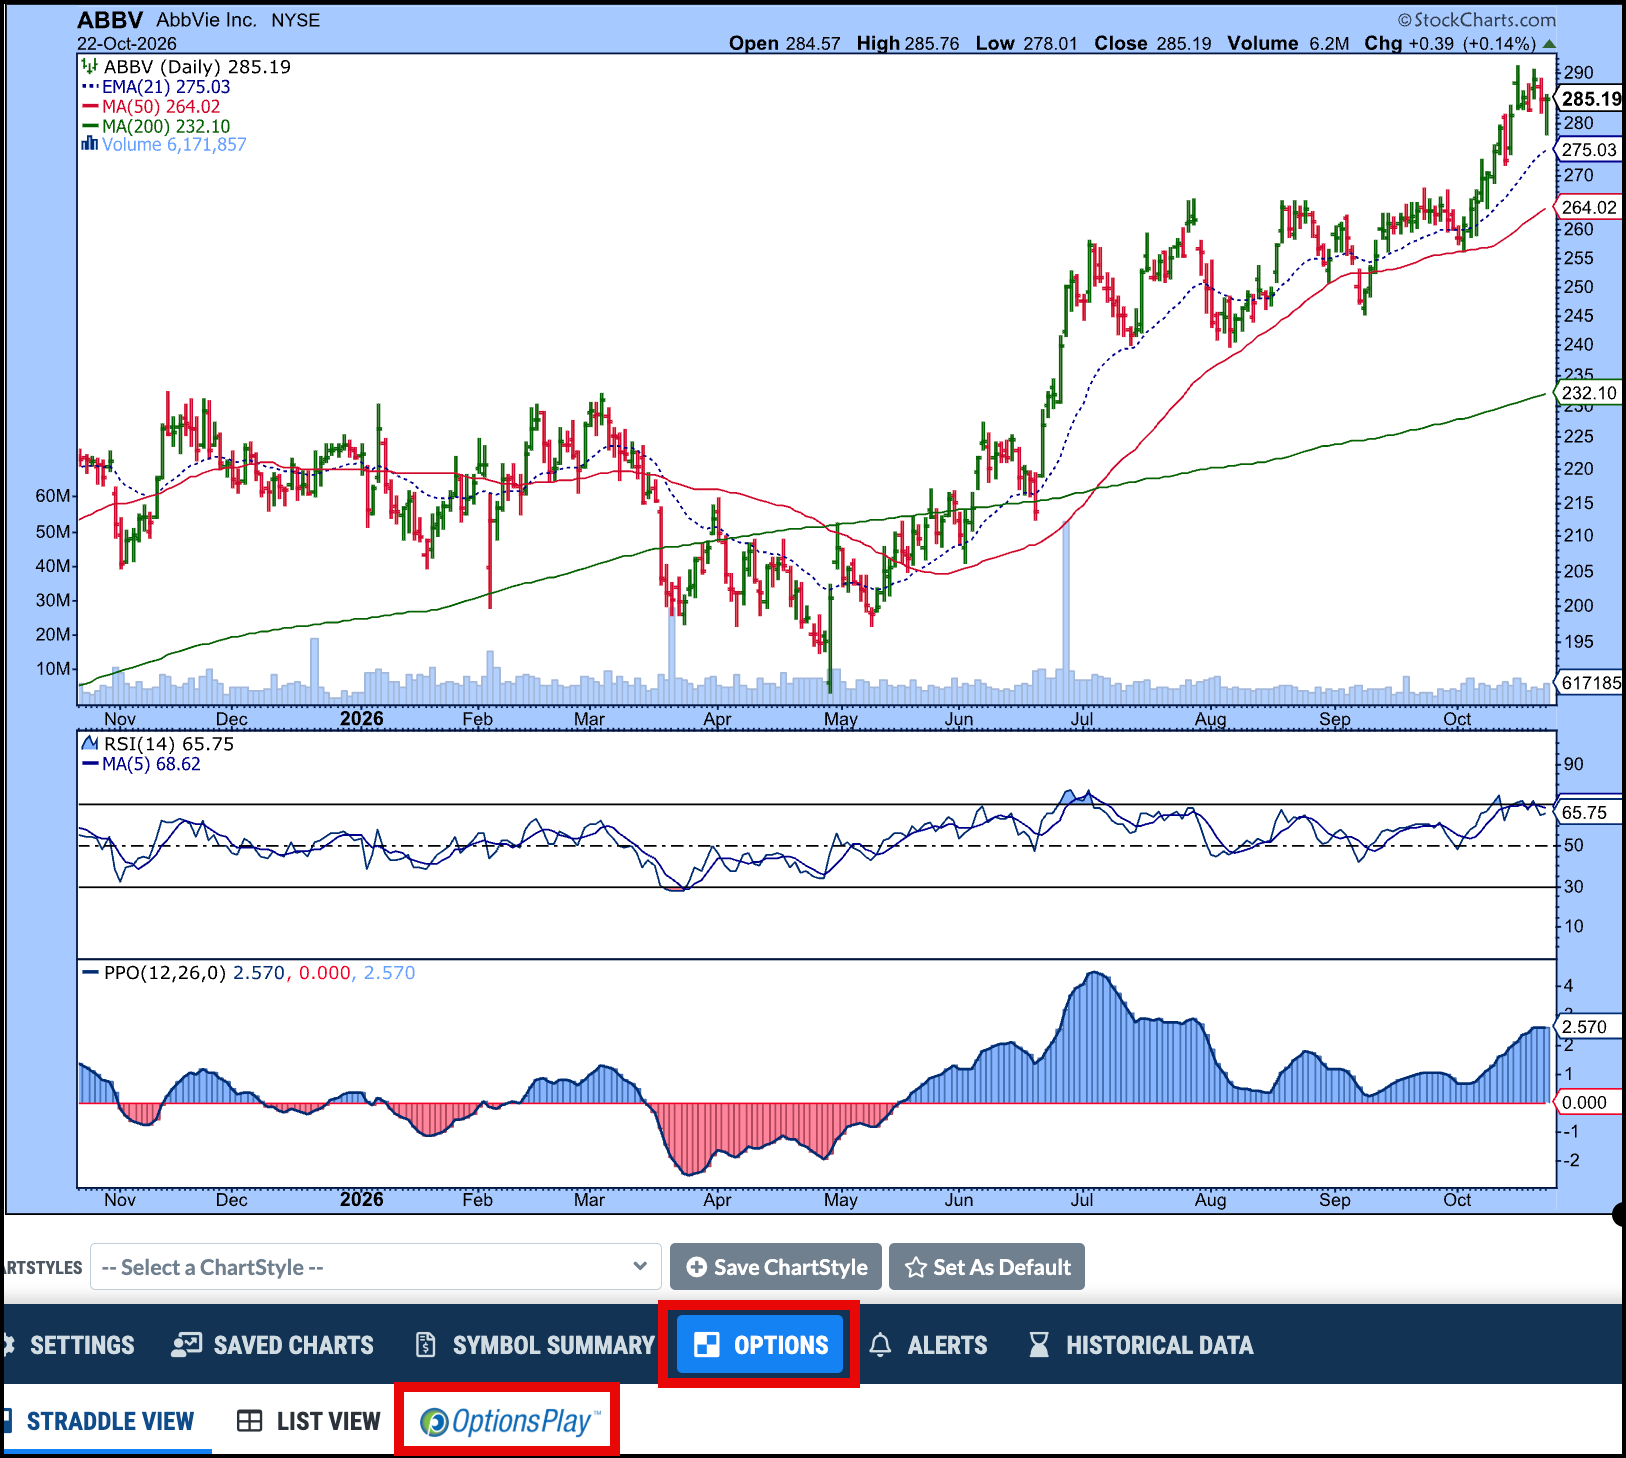
You’ll see three suggested option strategies based on your directional bias. Instead of buying 100 shares of the underlying, which will cost you over $28,000, you could consider a long call or a vertical spread. This would require less than $2,000 in initial capital.
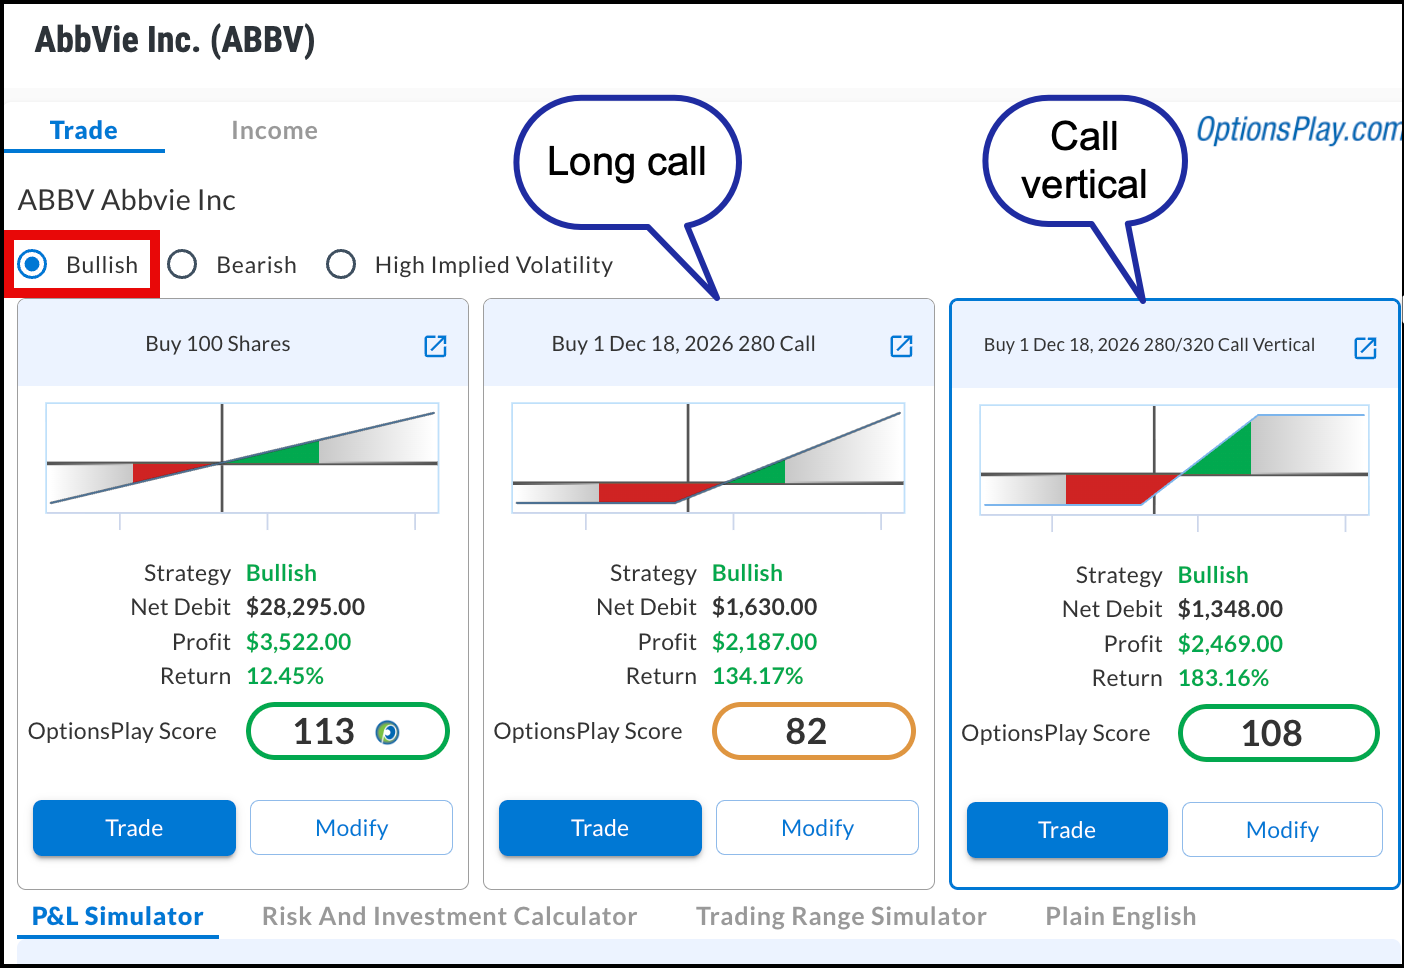
Of course, there are other risks involved in trading options. If you would like to learn more about using options, check out Tony Zhang’s blog posts and videos.
The Bottom Line
The stock market is dynamic, and there’s no way to know what it will do next. But that doesn’t mean that you should sit on the sidelines wondering what to do next. If you’re engaged with the market, you’ll start to recognize which sectors are gaining strength, which ones are losing momentum, and where money appears to be rotating.
Having a process such as using scans to identify investment opportunities, analyzing the charts, and making your entry and exit decisions will prepare you for what comes next.
Disclaimer: This blog is for educational purposes only and should not be construed as financial advice. The ideas and strategies should never be used without first assessing your own personal and financial situation, or without consulting a financial professional.