The S&P 500 Is Breaking Down. These Three Stocks Are Not.

One key takeaway from this market week, besides the dramatic impact of the U.S. elections, was the sense that investors are super skeptical of the AI trade. And after Wednesday’s post-election rally, followed by Thursday’s aggressive selloff, Friday felt like a “lick your wounds” type of day for the major averages.
So how did this week’s turbulence really change the technical picture?
Our “line in the sand” for the S&P 500 ($SPX) was 7600 and, going into the elections, we were focused on this support level to confirm that stocks remained in a consolidation phase. Assuming a break of that support level, which we observed on Thursday, our new downside objective of 7300 was initiated.
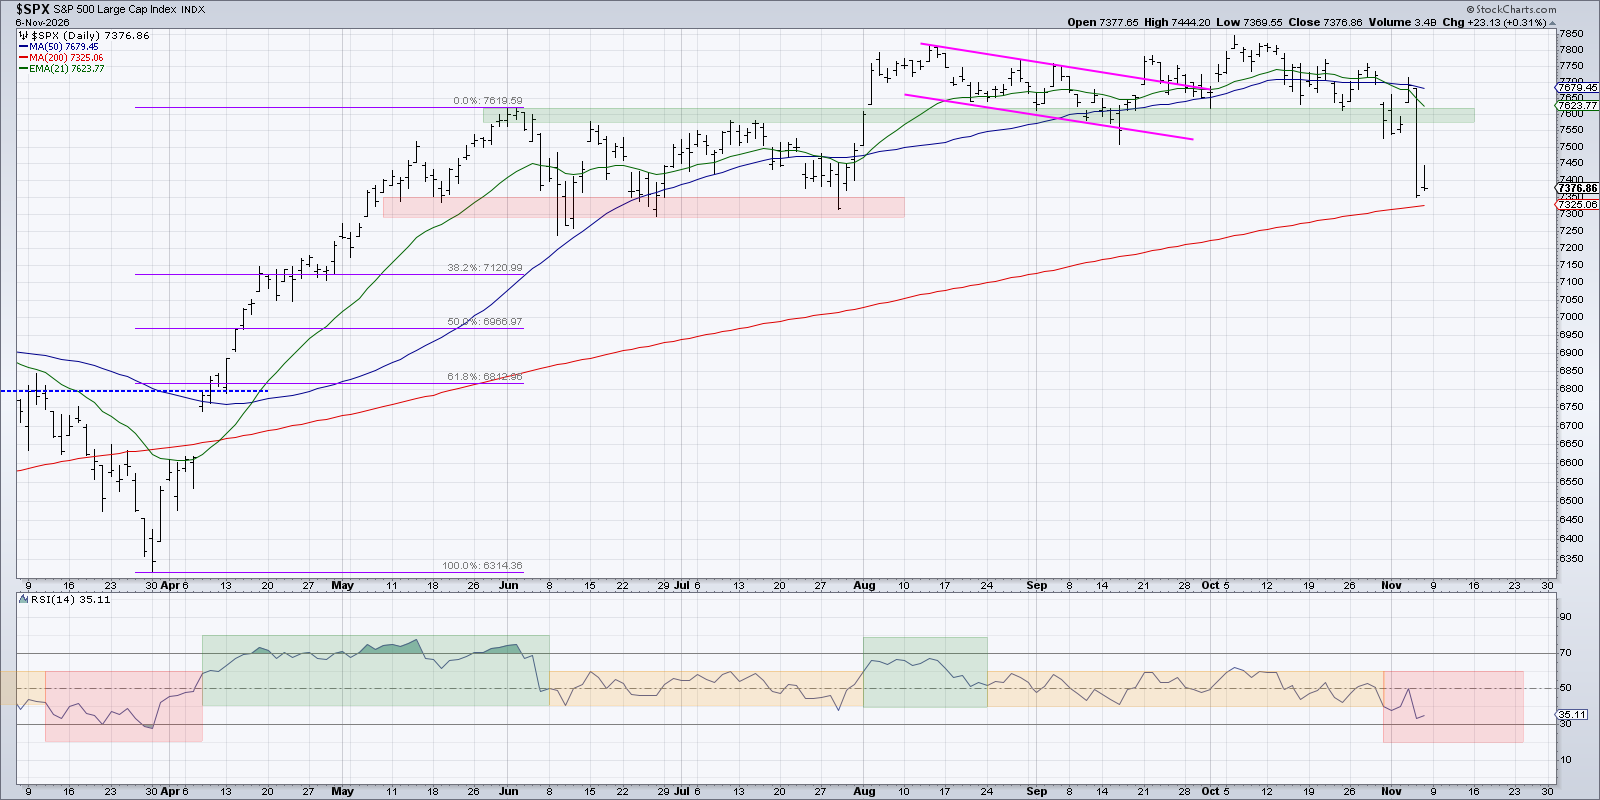
SPX 7300 remains an important level to watch in the coming week, as it’s based on the major lows from June and July as well as the 200-day moving average. As Paul Tudor Jones famously observed, “Nothing good happens below the 200-day moving average.” Thus, if the S&P 500 breaks below 7300, that would suggest a much more painful distribution pattern into December.
Any recovery for the major equity averages would most likely need to be driven by renewed strength in the semiconductor group. But while the VanEck Semiconductor ETF (SMH) was indeed overbought after Thursday’s selloff, we didn't see much of a recovery on Friday to imply an influx of new buyers.
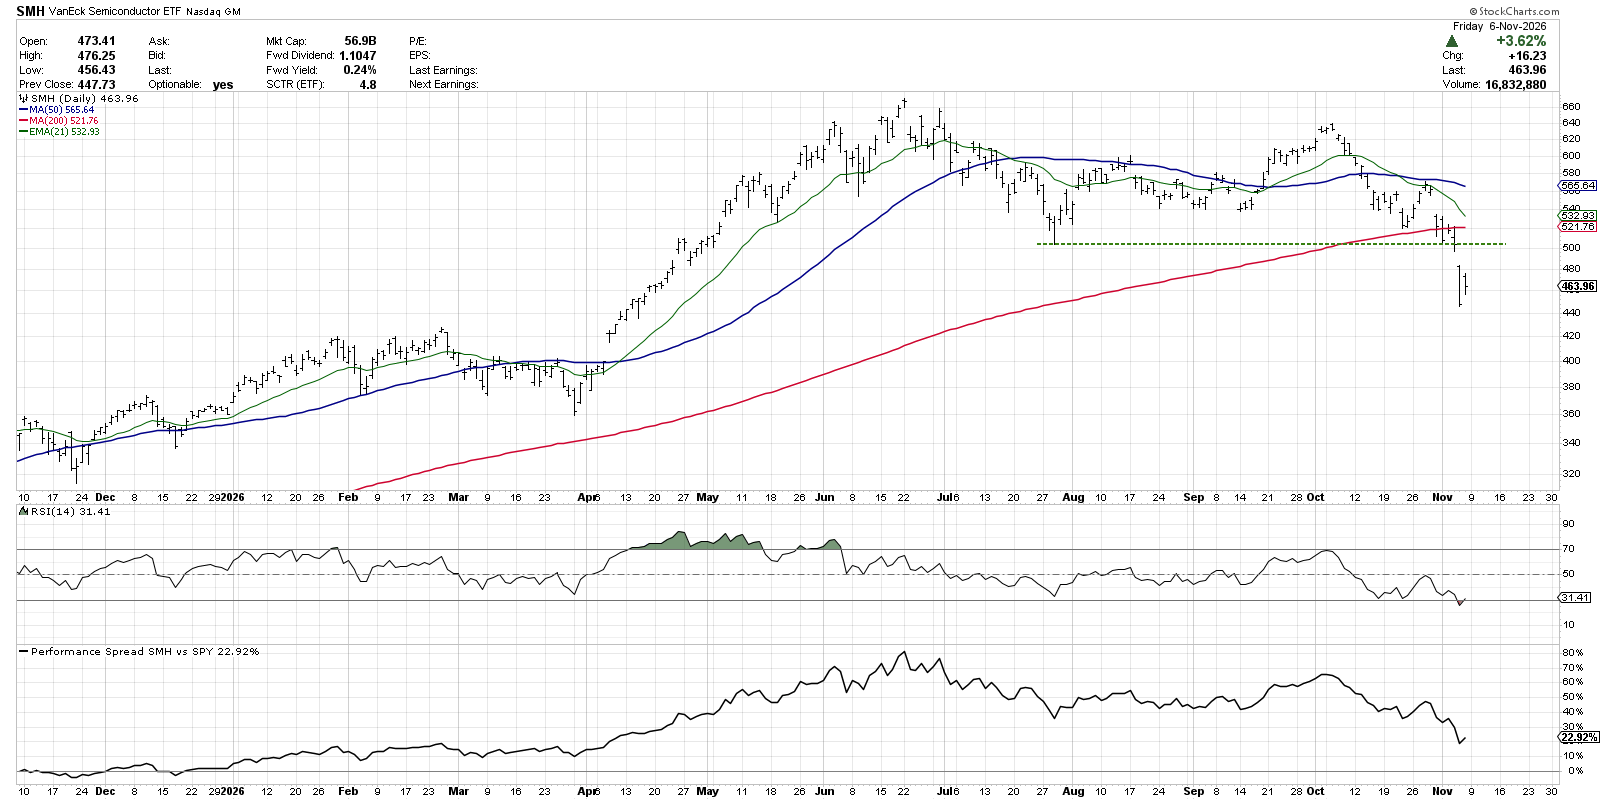
Although the majority of S&P 500 members remain safely above their 200-day moving averages, the weakness in semis here inspires me to remain focused on other sectors and themes for now.
Here are three stocks outside of the growth sectors that demonstrate strong technical profiles, improving relative strength, and compelling trends despite the broad market disruption.
Kroger Co. (KR)
The Consumer Staples sector has become one of the most improved areas of the equity markets, with charts like Kroger standing out with a clear rotation to a new accumulation phase. After making a major low around the 4th of July holiday, KR consolidated for a few months before breaking out above the 200-day moving average.
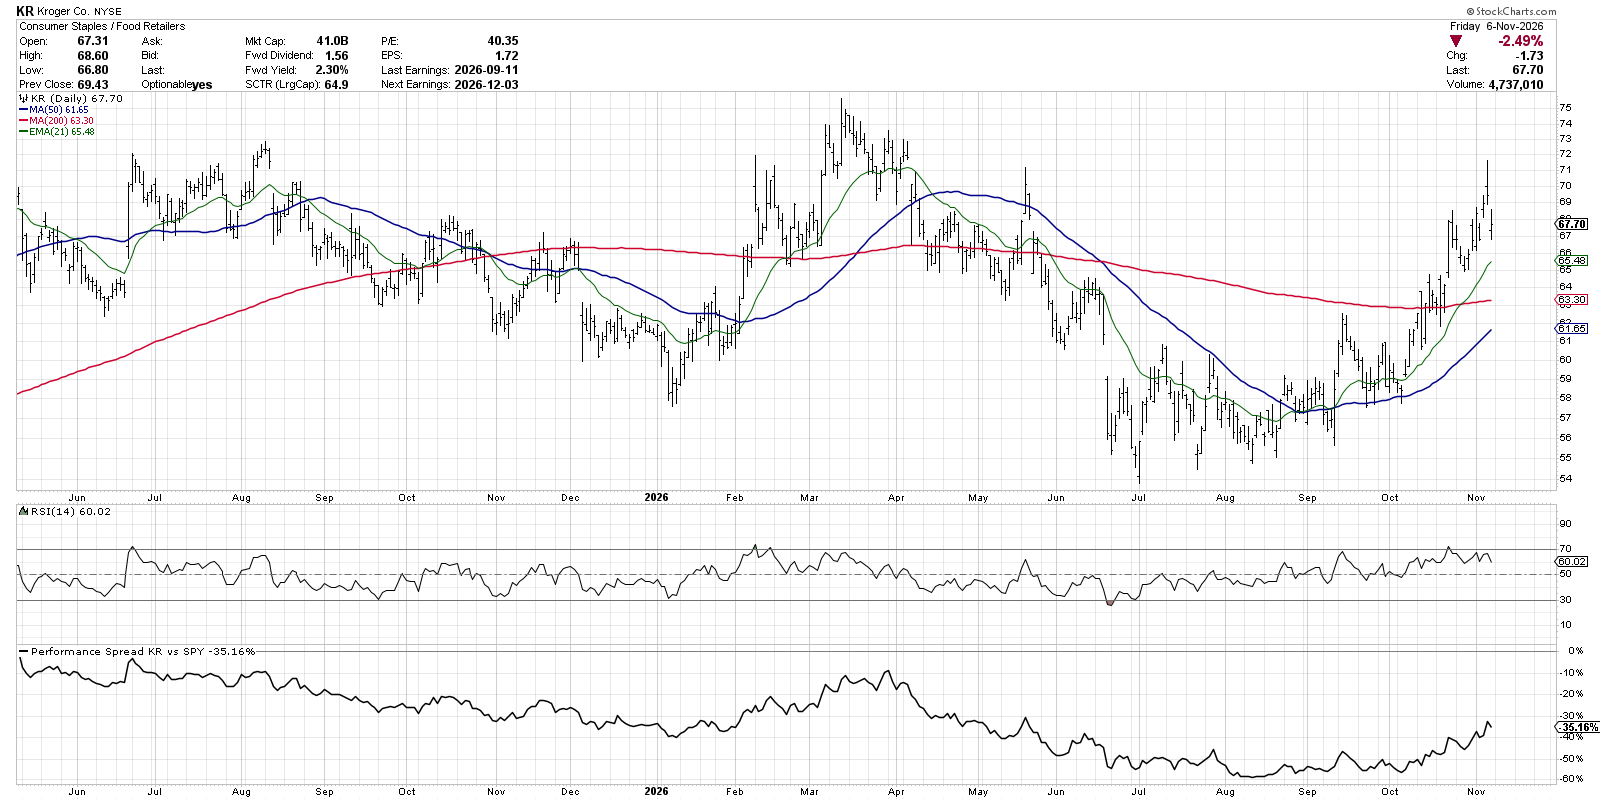
Now Kroger has established a clear uptrend pattern of higher highs and higher lows, with improving momentum over the last three months. While the stock is rapidly approaching its previous high from March, we’re considering this chart “innocent until proven guilty.”
Visa Inc. (V)
Visa is another chart that shows up on our Moving Averages Proper Order scan, featured in the StockCharts Sample Scan Library. While a number of the banks in the financial sector pulled back sharply as this week progressed, Visa and Mastercard (MA) have remained in a position of technical strength.
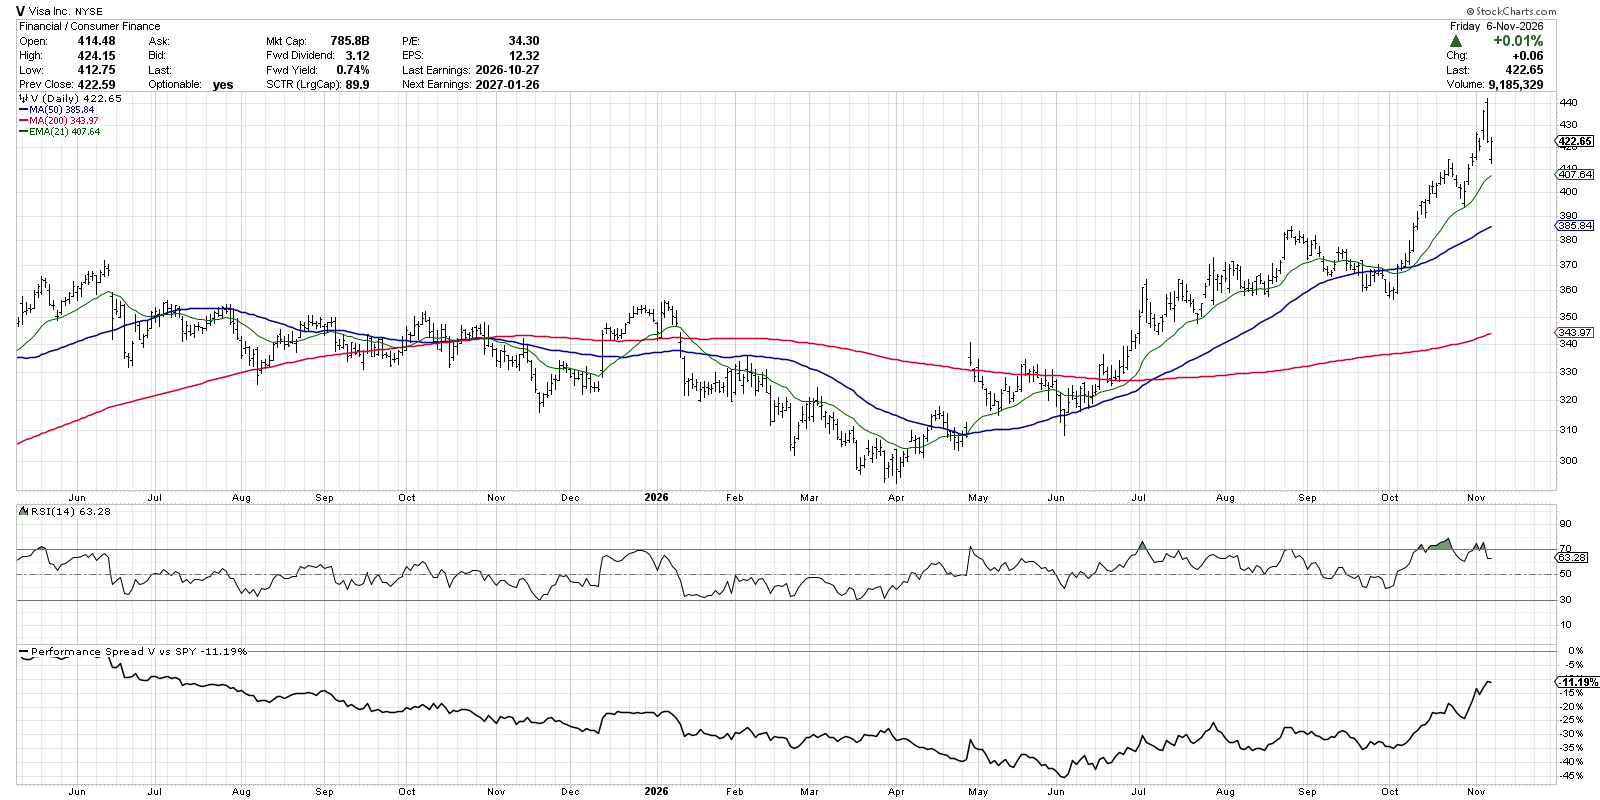
The relative strength in the bottom panel is the key redeeming factor for this chart. When the major equity benchmarks come under pressure, and we’re detecting clear signs of selling pressure over the last four weeks, the relative strength for Visa has been trending steadily higher. And while the daily chart may feel a bit overextended here, the weekly chart of Visa suggests that this is just part of a much larger accumulation phase.
Waters Corp. (WAT)
I always sign off my daily market recap show with the reminder, “It’s always a good time to own good charts.” To that end, I feel like the chart of Waters Corp. is the kind of price action I have in the back of my mind. Here, we can observe a steady uptrend phase along with price momentum that remains firmly in the bullish range.
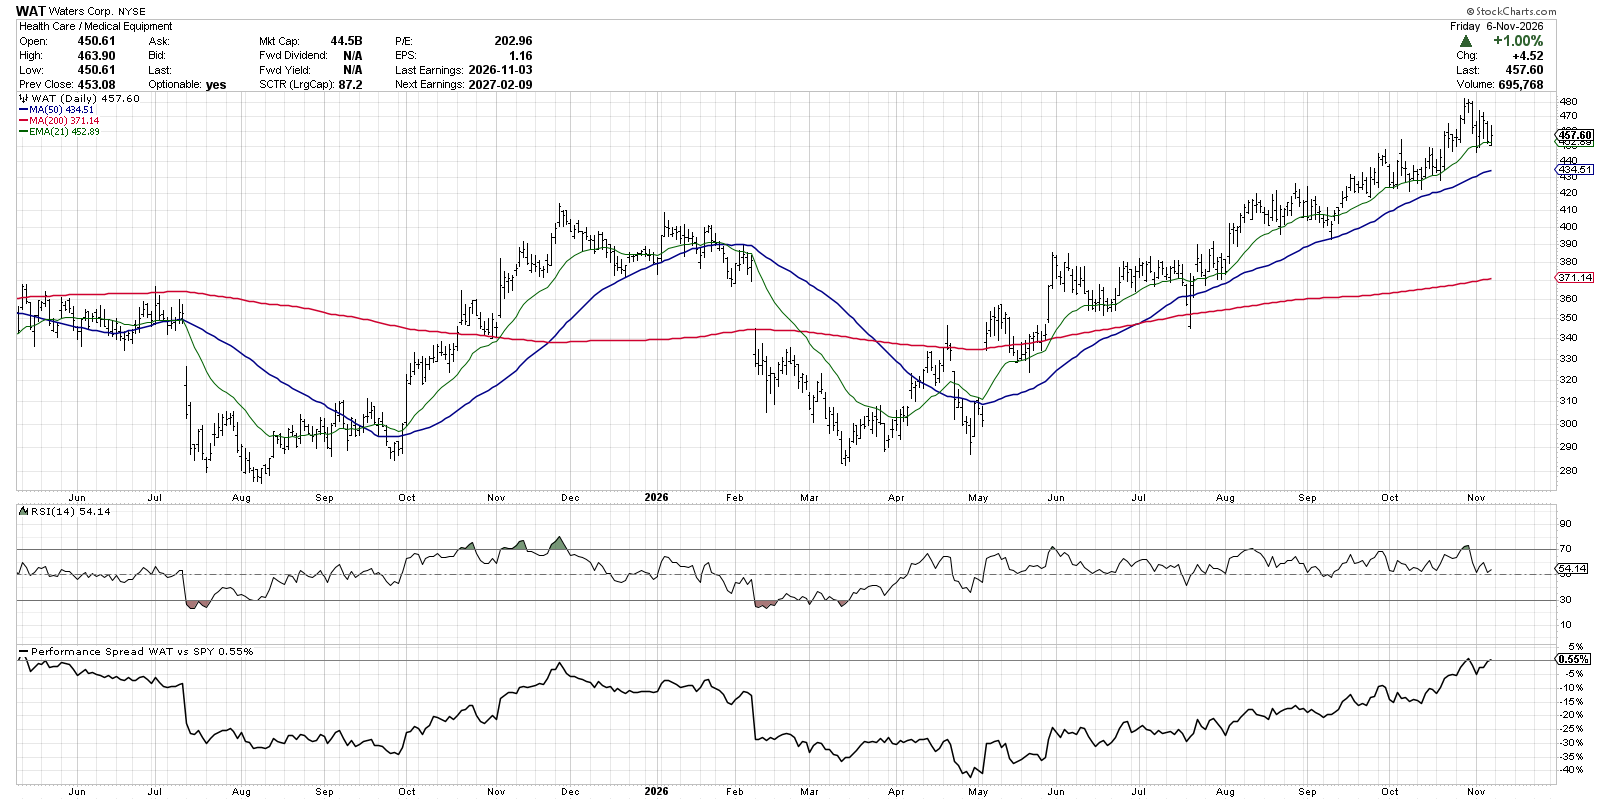
In the bottom panel, we can see that the relative performance has been remarkably strong and consistent over the last six months. Despite a major rotation in leadership, and a significant shift in the major market trend, this Health Care name remains in an uptrend phase.
The overall market trend remains the most important question investors need to answer every trading day. Even with a challenging macro environment, I’m not struggling to find compelling charts out there. As long we maintain a consistent routine for identifying emerging trends, we have the ability to outperform a struggling benchmark!
By the way, these stocks were featured in our Top Ten Charts to Watch in November 2026 on StockCharts TV!
RR#6,
Dave
P.S. Ready to upgrade your investment process? Check out my free behavioral investing course!
David Keller, CMT
President and Chief Strategist
Sierra Alpha Research LLC
marketmisbehavior.com
https://www.youtube.com/@DKellerCMT
Disclaimer: This blog is for educational purposes only and should not be construed as financial advice. The ideas and strategies should never be used without first assessing your own personal and financial situation, or without consulting a financial professional.
The author does not have a position in mentioned securities at the time of publication. Any opinions expressed herein are solely those of the author and do not in any way represent the views or opinions of any other person or entity.