Post-Election Rally or Bull Trap? Lessons From 2018

Stocks rallied in a big way on Wednesday following a dramatic shift to Democratic candidates in the US midterm elections. Will this initial bounce higher be the beginning of a recovery phase for equities, or are we observing a countertrend rally before the next big move lower?
Today we’ll look at seasonal tendencies in November, break down 2018 as a potential analog for 2026, and highlight three stocks demonstrating clear accumulation signals despite market uncertainty.
Midterm Election Years Always Have a Strong November
I like to think of seasonal charts as tendencies rather than hard rules. That is, the seasonal charts tell you what often happens during a particular time of year, but there is no guarantee that the current year will follow the traditional seasonal pattern.
John Kosar of Asbury Research once compared seasonal charts to riding your bike. During periods of seasonal weakness, it’s kind of like riding your bike into the wind. You can still make progress, but it’s just much harder to come by!
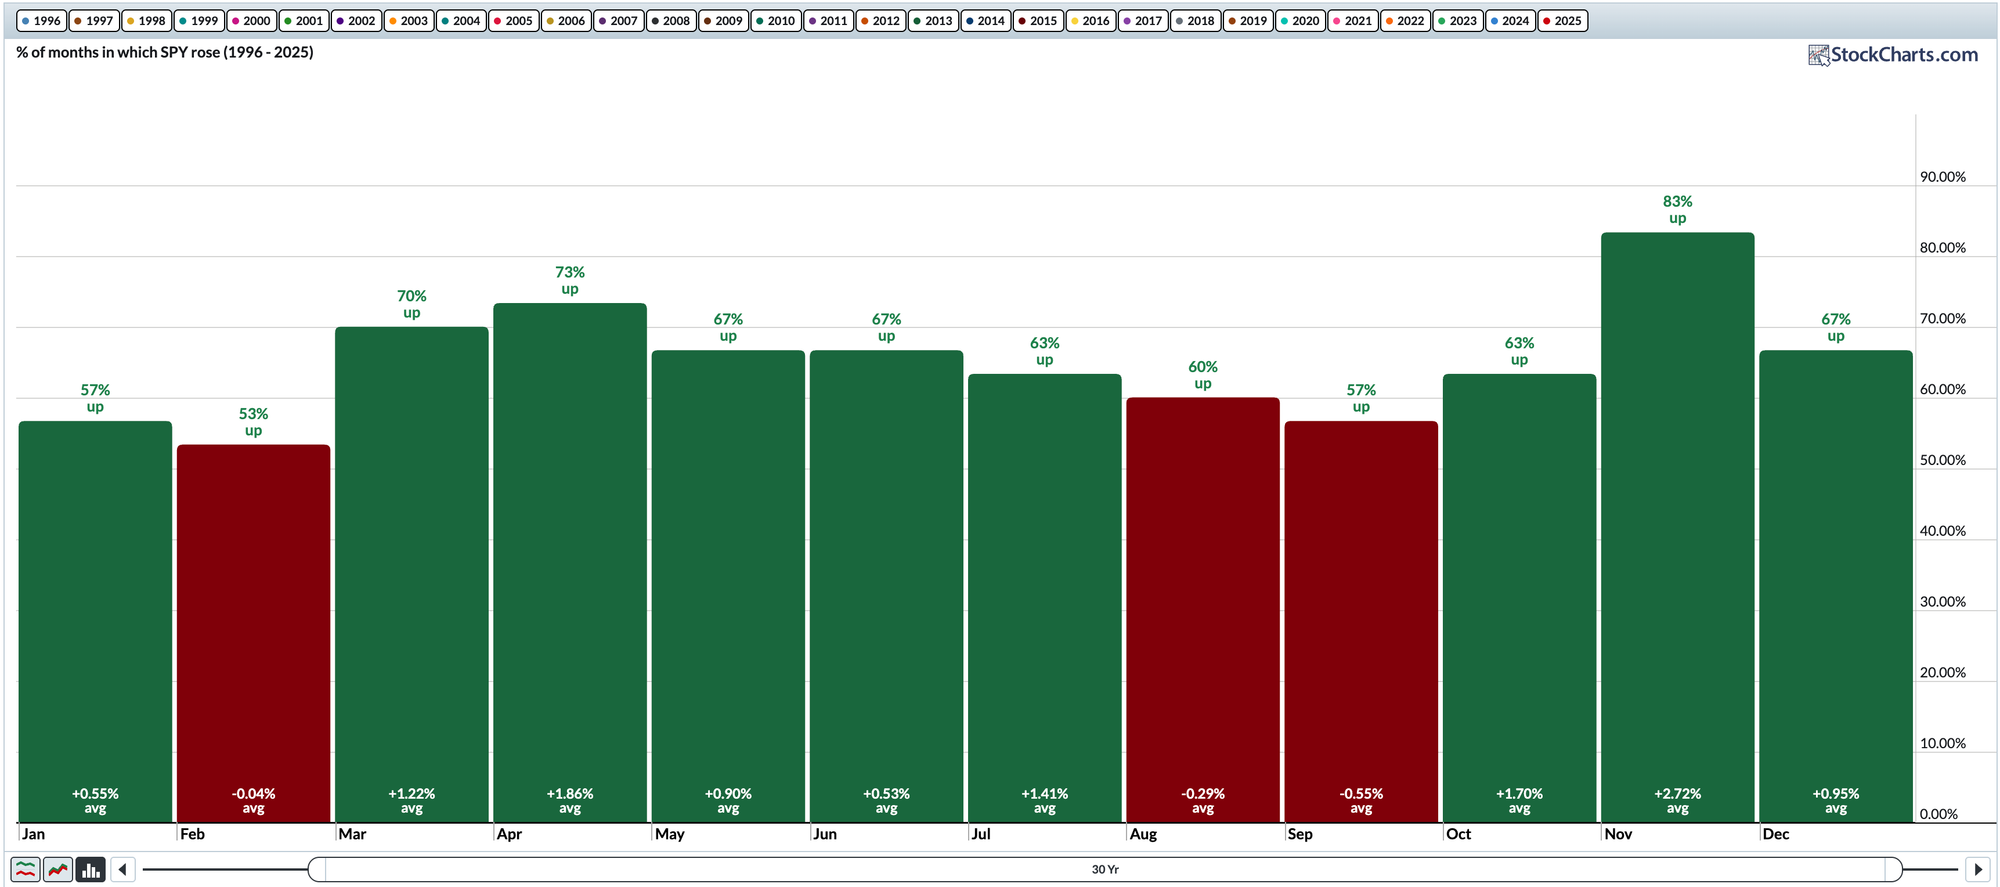
The good news is that over the last 30 years, November has been more like “riding with the wind at your back.” November has been a positive month 83% of the time, with an average return of +2.72%.
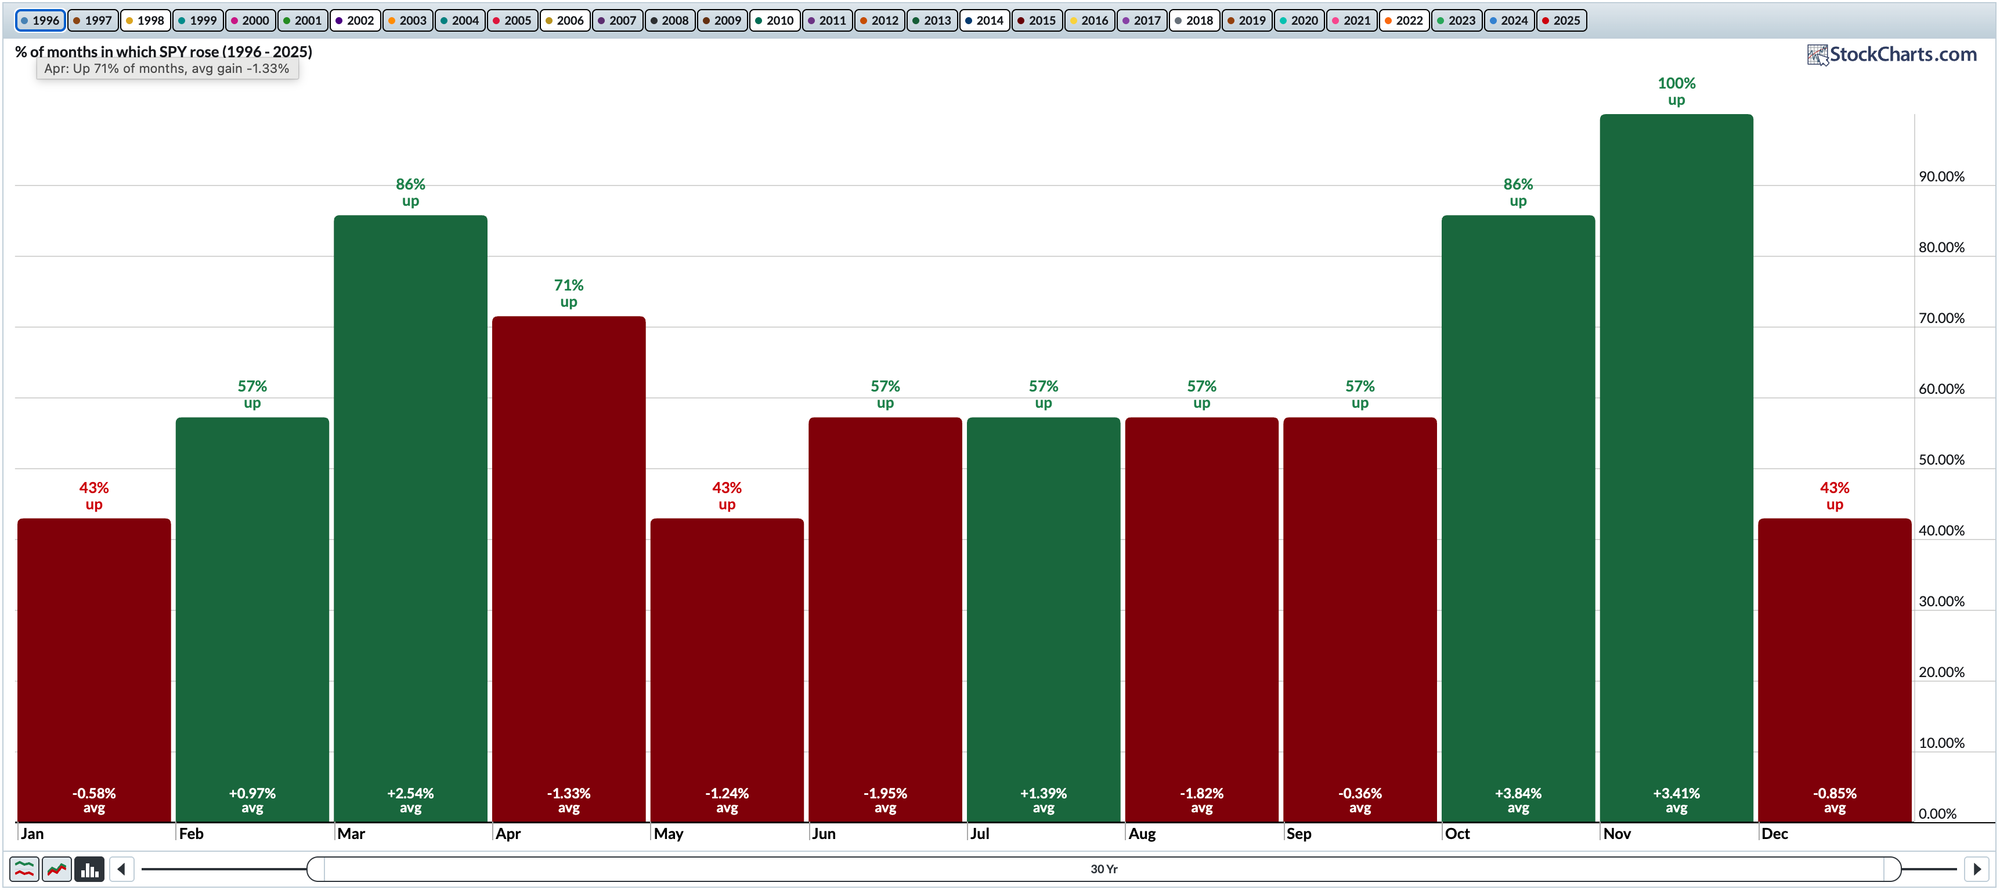
If we limit our observations to midterm election years like 2026, we can see that, since the late 1990s, November has been a positive month 100% of the time!
So it seems pretty clear that we should be expecting great things from the S&P 500 ($SPX) in November 2026, right? Well, not necessarily.
Will 2026 Be a Repeat of 2018?
The immediate post-election reaction on Wednesday was a broad advance driven by Consumer Discretionary, along with five other sectors that gained over 3% for the day. Despite the Technology sector being flat for the day, the S&P 500 surged about 1.5% and finished back above our “line in the sand” level of 7600.
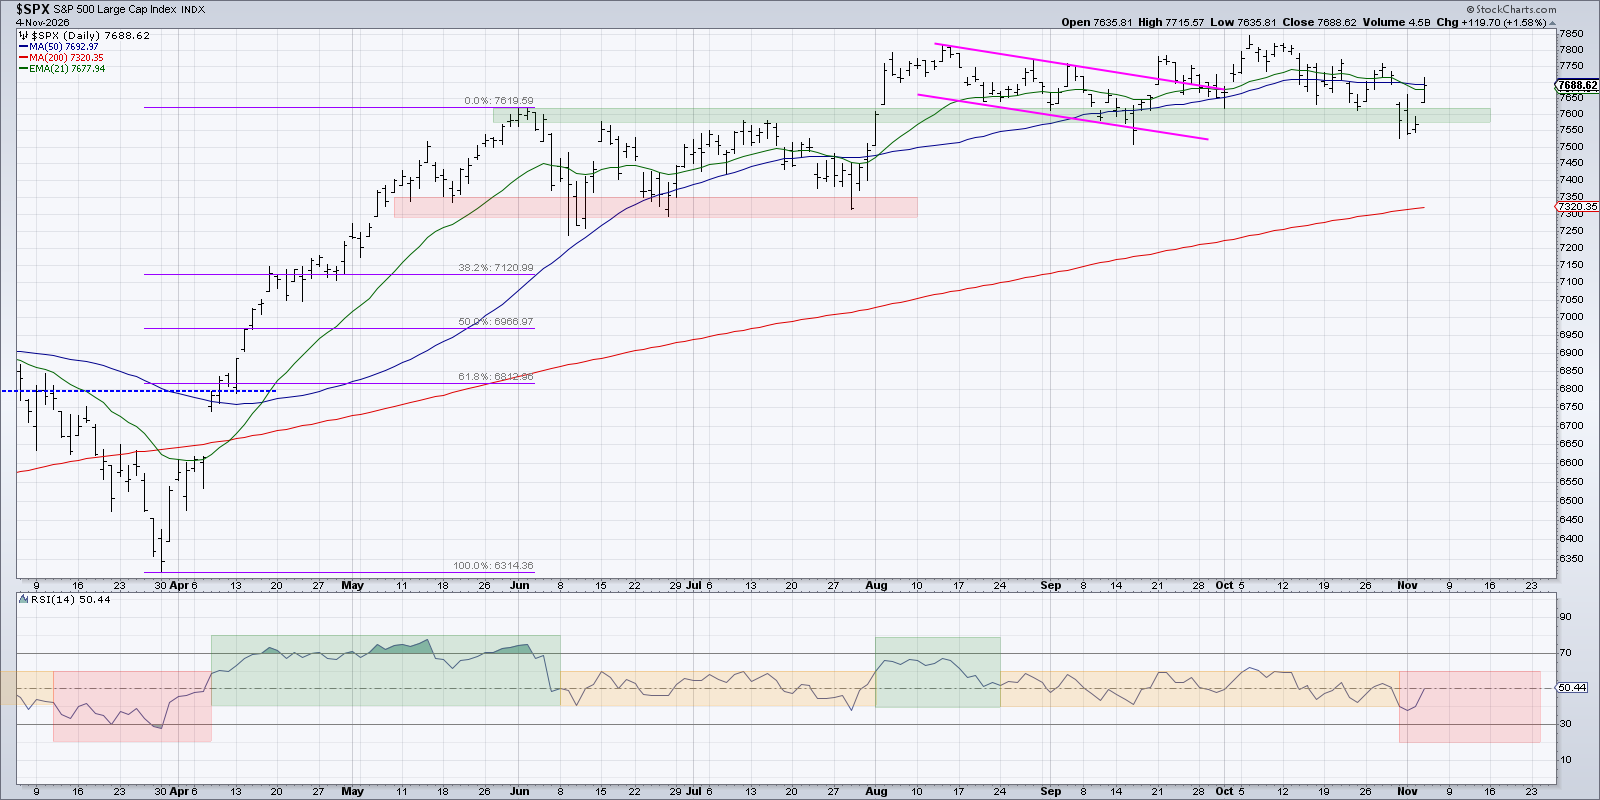
While the immediate reaction appears bullish, you don’t have to go back too far in history to see another midterm election year where an initial rally was followed by a new downtrend phase. Here’s the S&P 500 in 2018, which was the midterm election year during Trump’s first term.
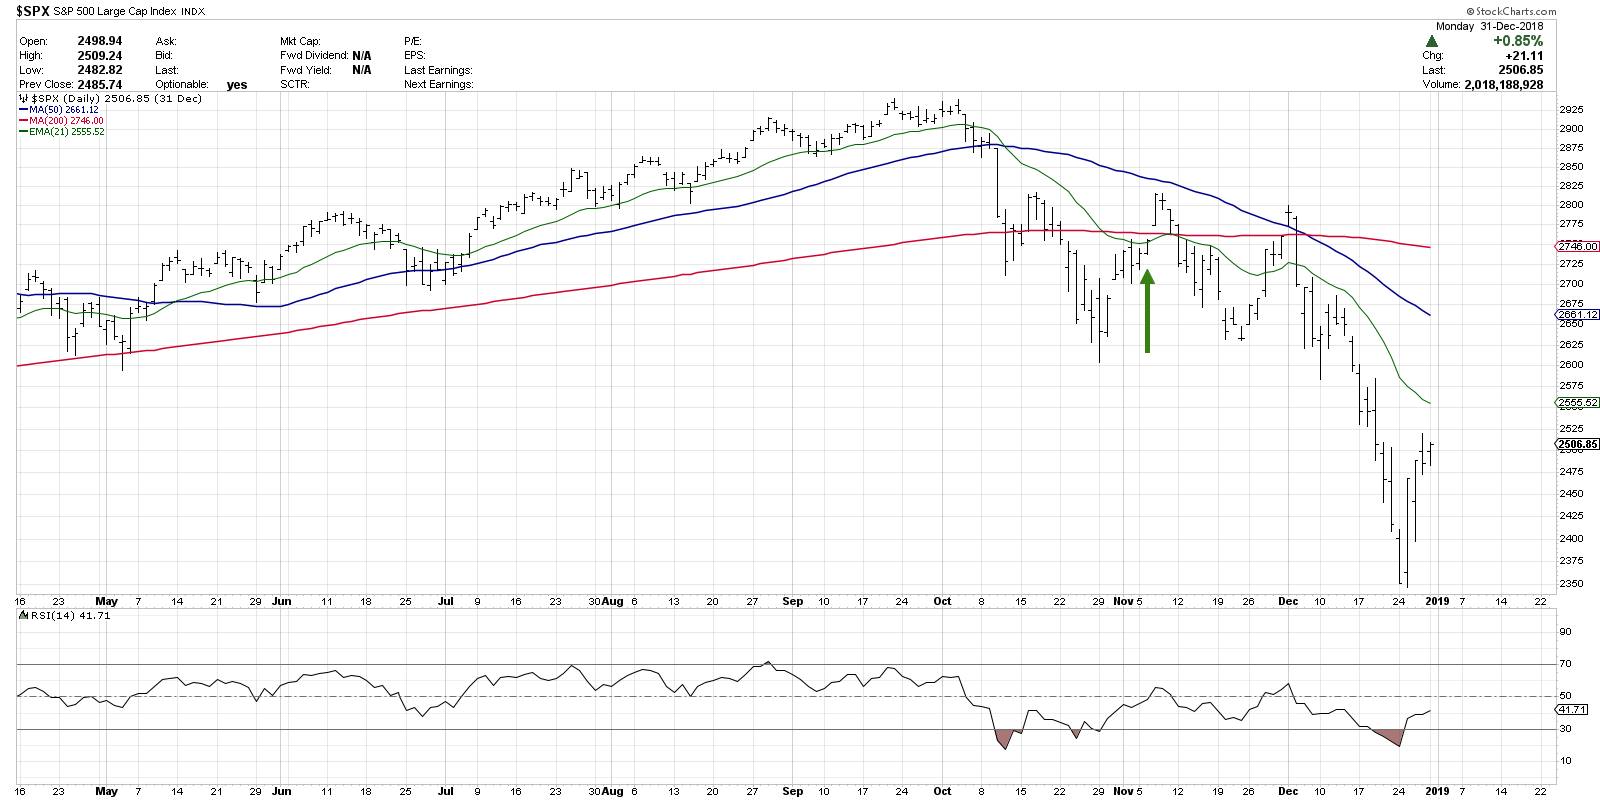
The green arrow indicates Election Day on Tuesday, November 6, 2018. The next day, the S&P 500 jumped back above the 200-day moving average and appeared to signal an “all clear” after a challenging October. But that Wednesday session ended up being the highest point for the index into year-end, as the market resumed a distribution phase after a brief consolidation in November.
In the days and weeks to come, the question is whether investors will treat this initial rally as an opportunity to go back to risk-on positioning, or whether we’ll see more risk-off behavior as the market refocuses on the potential impact of challenging macro conditions.
In either scenario, I’ll continue to focus on stocks that are demonstrating strong relative strength. Here are three charts that fit the bill, some of which were featured in our recent webcast on navigating the 2026 election season.
It’s Always a Good Time to Own Good Charts
For investors concerned about market instability, defensive sectors like Consumer Staples can provide a good balance of price appreciation and dividend income. Coca Cola (KO) made another all-time high on Wednesday after doing so on Monday as well.
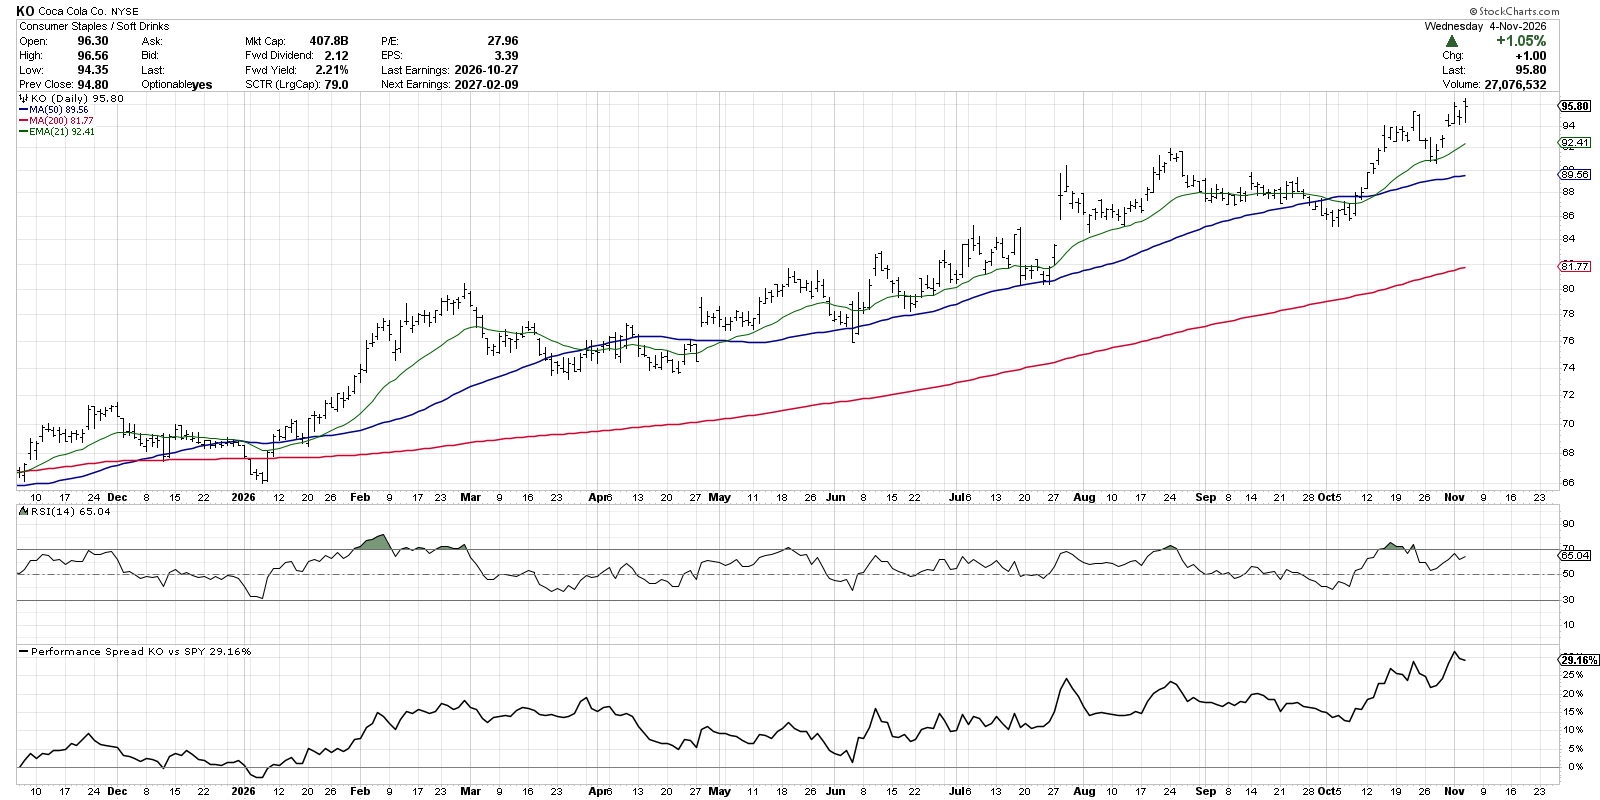
Here we see the price trending higher above three upward-sloping moving averages, and the Relative Strength Index (RSI) is firmly in the bullish range. I’m noting a potential bearish momentum divergence with lower momentum so far this week, which means it could be important to watch for any breaks of the 21-day exponential moving average.
The Health Care sector has been a source of great charts so far in Q4, and Amgen (AMGN), in the biotech group, shows a similar bullish moving average configuration.
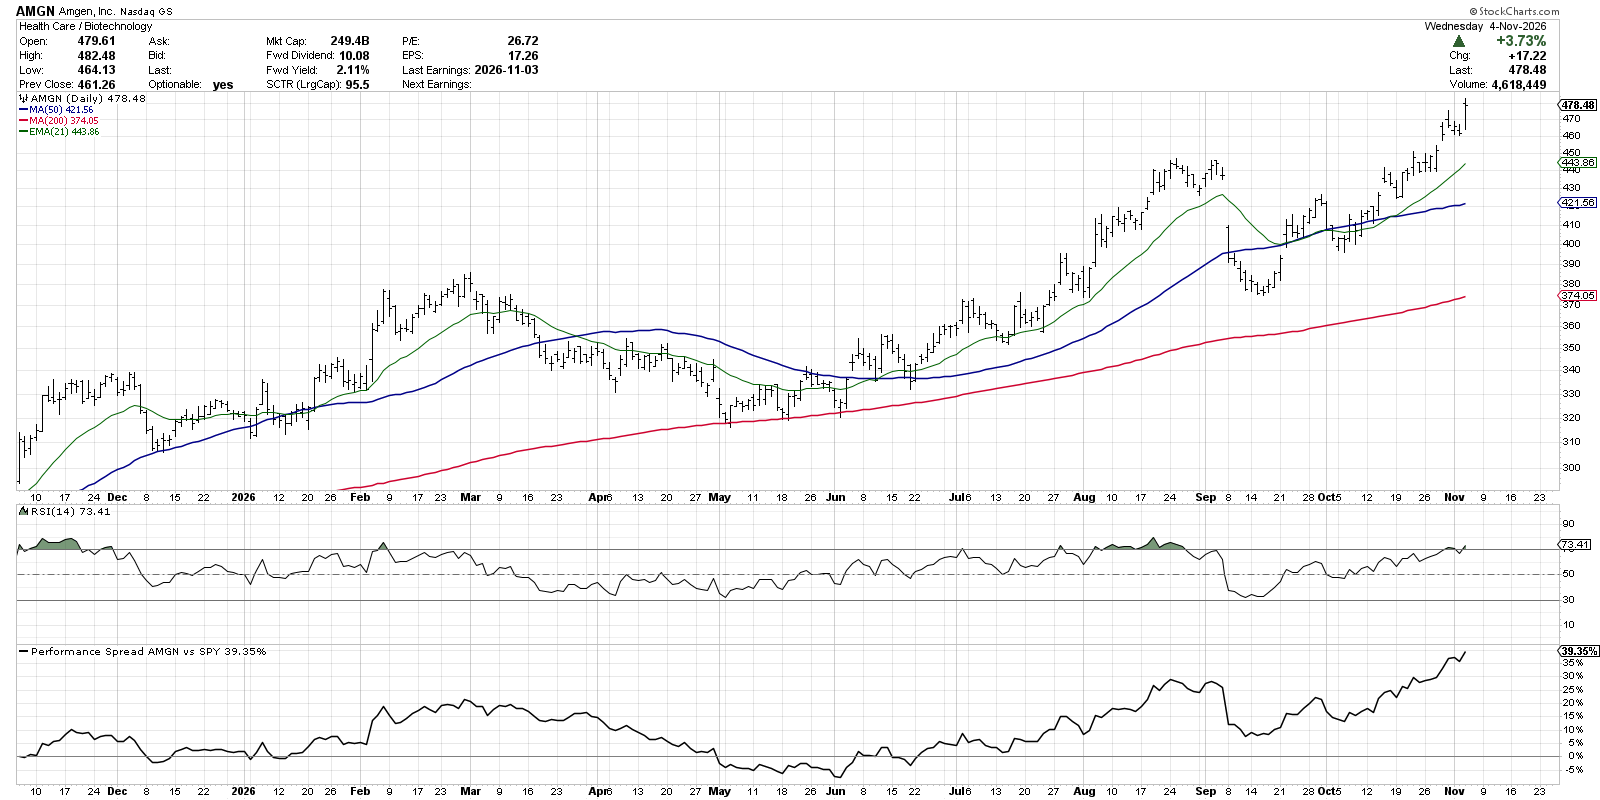
While AMGN is overbought over the last week, I’m inclined to treat charts like this as “innocent until proven guilty” and focus on the price continuing a pattern of higher highs and higher lows.
Finally, I’ll highlight one stock in the Technology sector that serves to remind us that charts like Texas Instruments (TXN) are bullish no matter what sector they represent!
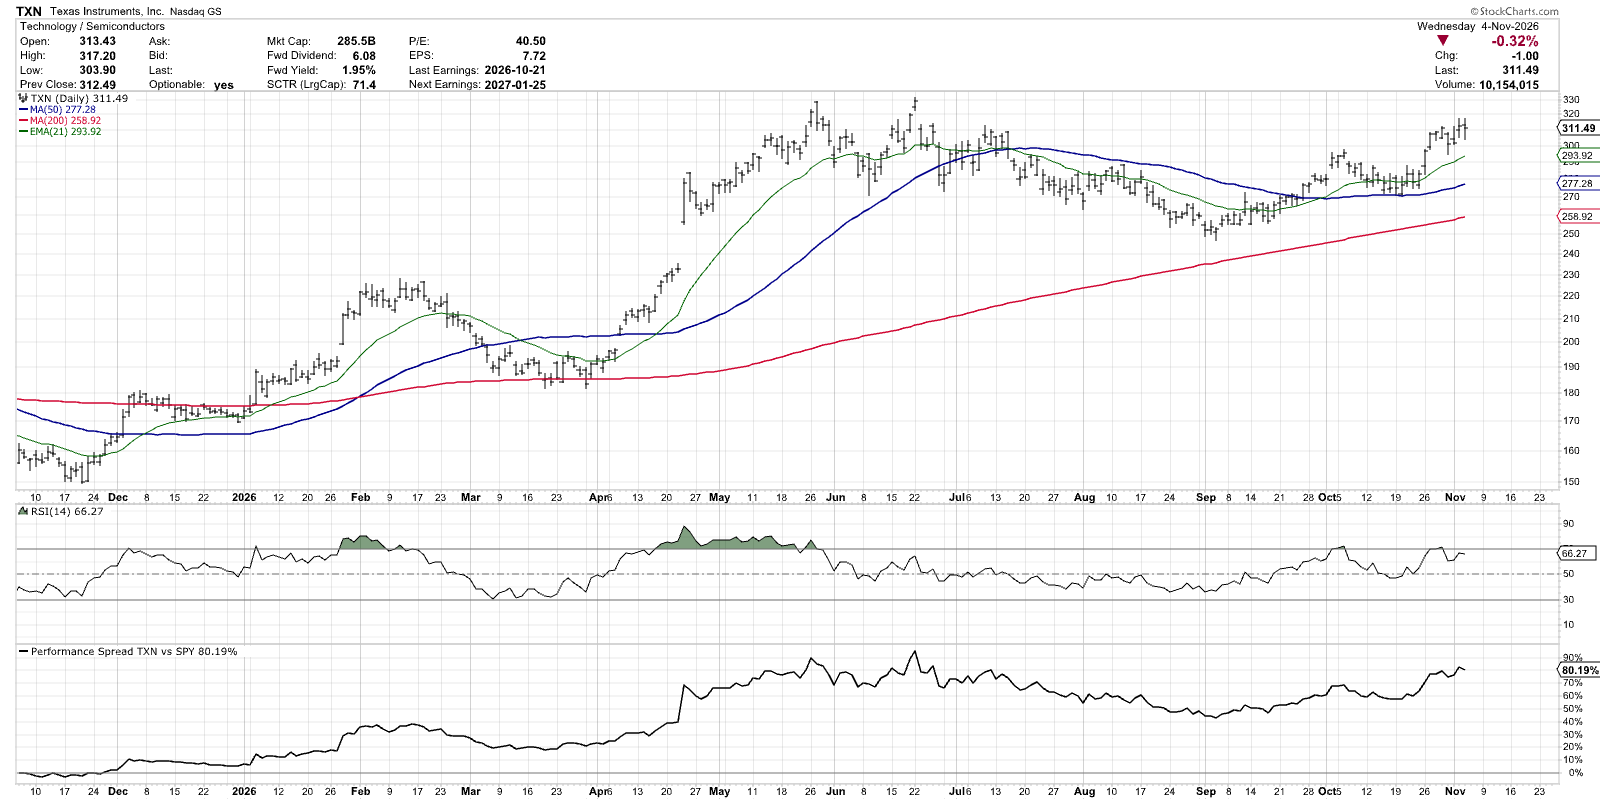
Here, we can see a clear rotation from a distribution phase into an early September low to a new accumulation phase into early November. With the price back above moving average support, we’re looking to see if the chart can maintain positive momentum as it approaches previous all-time highs from May and June.
Want to dig more into seasonal tendencies and their implications, along with my playbook for navigating the 2026 election season? Check out my recent webcast, Election 2026: Midterm Market Patterns.

RR#6,
Dave
P.S. Ready to upgrade your investment process? Check out my free behavioral investing course!
David Keller, CMT
President and Chief Strategist
Sierra Alpha Research LLC
marketmisbehavior.com
https://www.youtube.com/@DKellerCMT
Disclaimer: This blog is for educational purposes only and should not be construed as financial advice. The ideas and strategies should never be used without first assessing your own personal and financial situation, or without consulting a financial professional.
The author does not have a position in mentioned securities at the time of publication. Any opinions expressed herein are solely those of the author and do not in any way represent the views or opinions of any other person or entity.