StockCharts Insider: Myth or Real? Putting the Post-Midterm Rally to the Test
Before We Dive In…
You hear it every election season: “Stocks rally after midterms.” It's a claim that’s often backed by almanac stats, bank analysts, and some academic research [1]. But is it true? And if it is, what does it look like in terms of timing and duration?
Insider Tip: Don’t Take Any Seasonal Claim on Faith.
In other words, test it yourself. So, I did. I crunched the numbers myself using monthly data from StockCharts: the S&P 500 ($SPX, 14 midterms, 1970–2022) and the Nasdaq 100 ($NDX, 10 midterms, 1986–2022).
Here’s what I found: the rally claim is legit, and stronger than I expected, but it doesn’t show up when most people expect it.
Claim 1: “Stocks Rally Right After the Election”
Verdict: It’s half true.
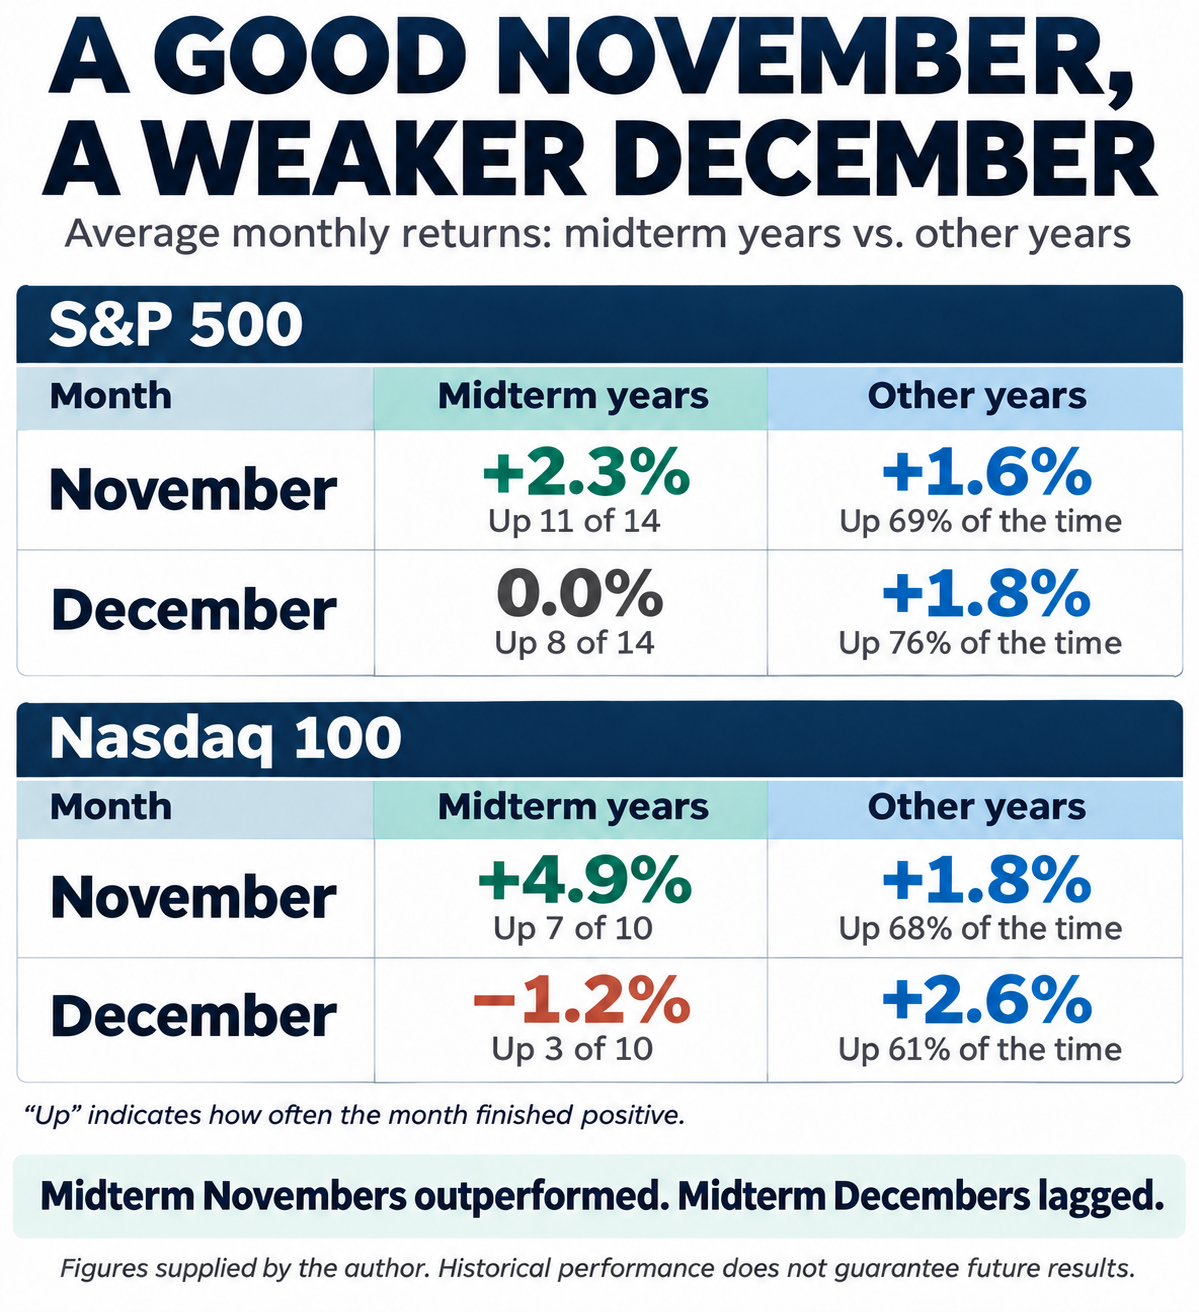
Stocks do tend to pop in November after a midterm election. The problem is December, where much of that gain is given back.
- For the S&P 500, post-midterm November has averaged +2.3%, better than a typical November (+1.6%). But December has averaged 0.0%, compared with +1.8% in other years.
- The Nasdaq 100 swings harder. Its post-midterm November has averaged +4.9%, but December has averaged −1.2%, with only 3 of 10 positive.
Three of the last six post-midterm Decembers were ugly for the S&P: 2002 (−6.0%), 2018 (−9.2%), and 2022 (−5.9%).
So, it's half true. The post-election pop does happen. But it often fades before the new year. The net result: the two months after a midterm haven’t been any better than usual.
Claim 2: “The Six Months After a Midterm Are Strong”
Verdict: This is real.
Let’s start from the October close of the midterm year to the April close the following year. Six months total.
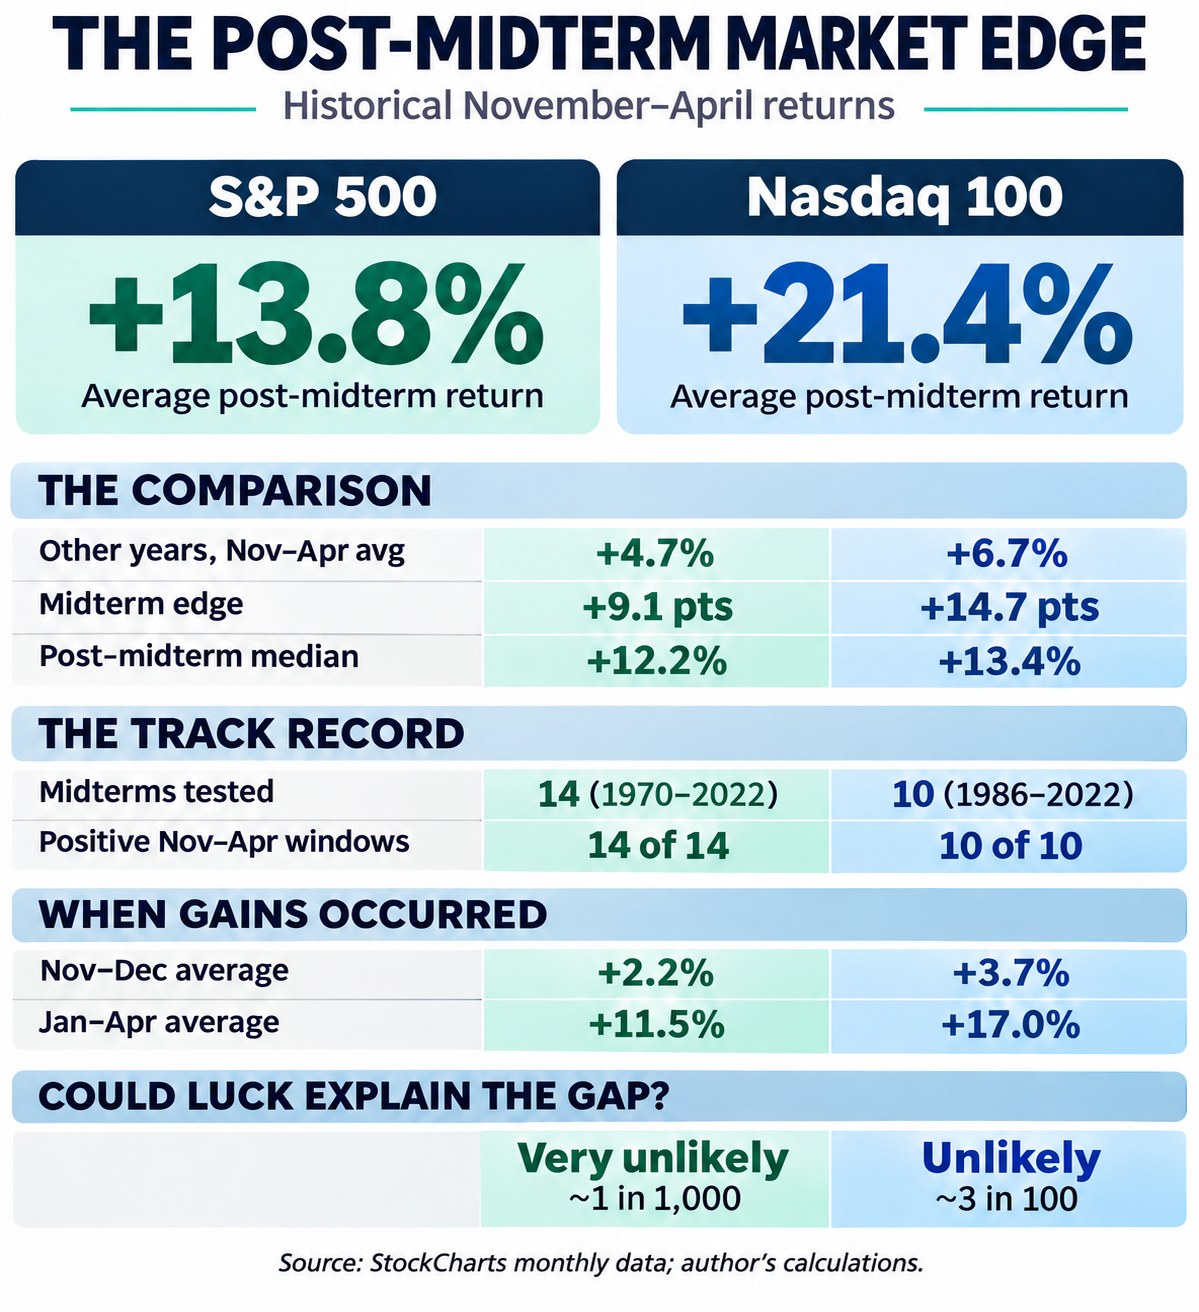
The gains come in January through April, four months in the following year. They don’t come right after the election.
To contrast, January–April in other years has been a coin flip for the S&P, positive only half the time. For the Nasdaq 100, it’s about 6 in 10. But after midterms, it's 14 for 14 (S&P) and 10 for 10 (Nasdaq 100). Is it luck? Probably not.
Claim 3: "It's Just the Best Six Months in Disguise"
Verdict: No, It’s Mostly the Opposite
So, November through April is known as the market’s best six months. What if the midterm rally is just doing what the market almost always does?
If you compare those six months during midterm years to all others, here’s what you get.
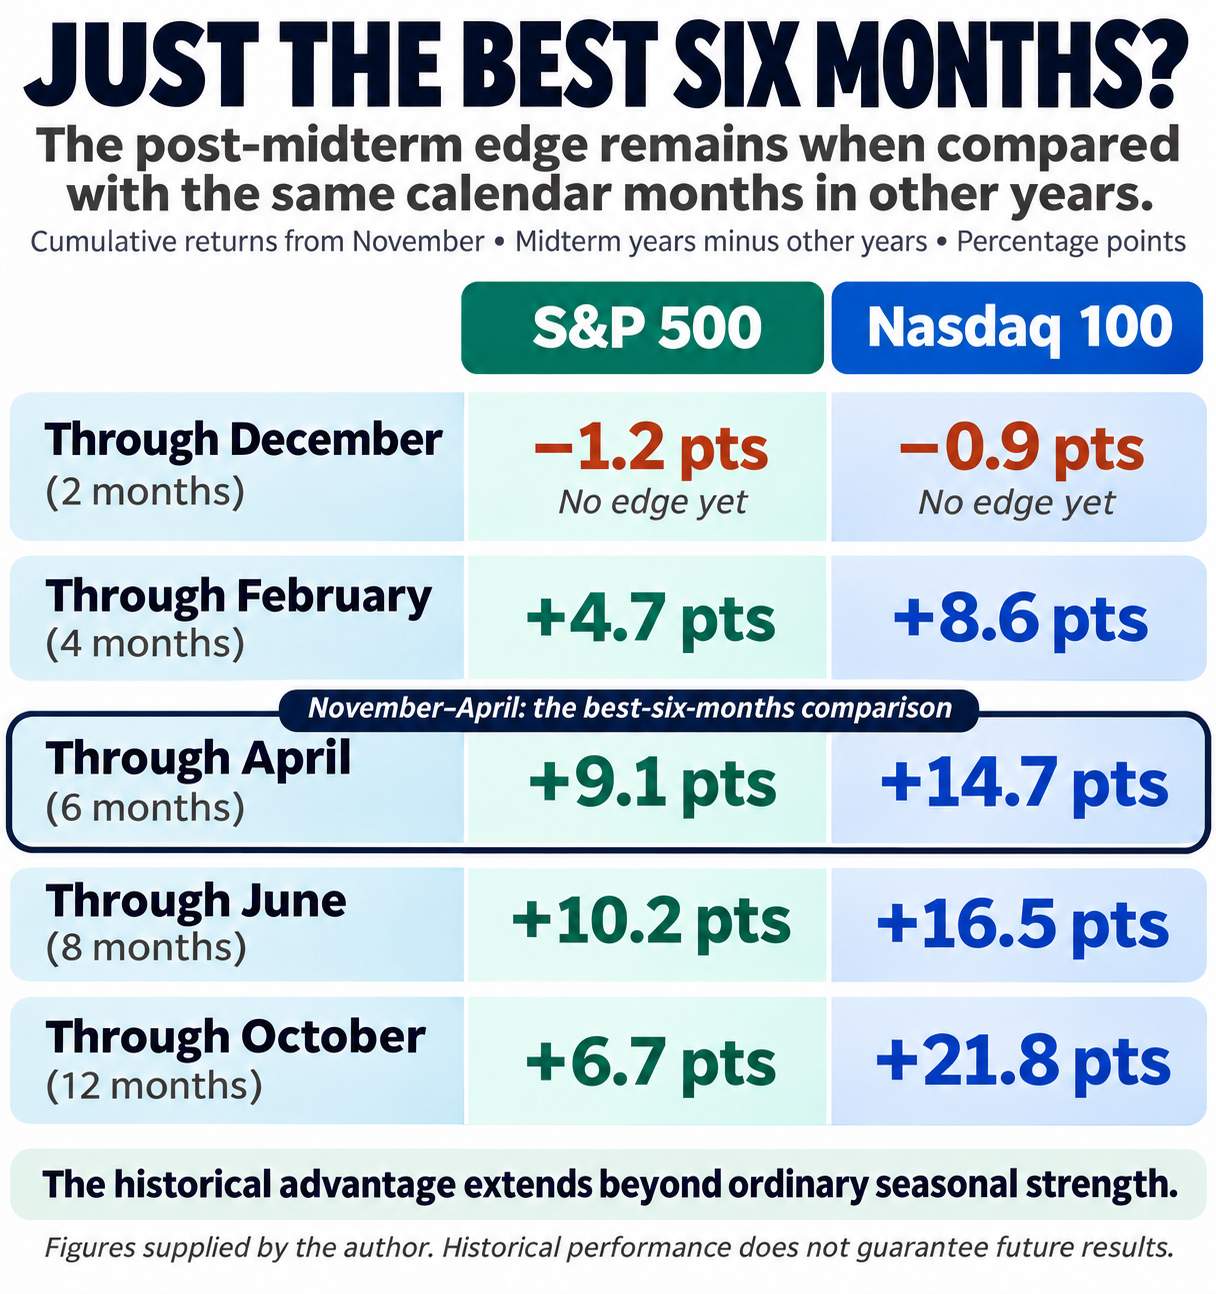
Look at the highlighted row. Do you see 9.1 points on the S&P 500 and 14.7 on the Nasdaq 100? That’s how much midterm years beat all others.
The surprise is that if you take out midterm years, the S&P’s November-April stretch averaged +4.7%. That’s how much it makes in a typical six-month stretch. So, without midterms, the “best six months” look pretty ordinary. If you think about it, the midterm years may be why those months got their reputation.
What’s Behind the Rally?
The main reason for the rally is most likely the lifting of uncertainty. Before midterms, nobody knows who will control Congress, so it’s hard to anticipate what happens next with taxes, spending, and regulation. Once the votes are counted, people know how to position their investments.
Not Sure About This? Test It Yourself
It’s spreadsheet time. Here’s what I did:
- Download historical prices for $SPX and $NDX from StockCharts’ Historical Price Data page and switch the setting from Daily to Monthly. (Note: each monthly row is dated at the start of the month, but its Close is the month’s final close.)
- For each midterm year, divide the following April’s close by the midterm year’s October close, then subtract 1 (For 2022: 4,169.48 ÷ 3,871.98 − 1 = 0.077, or +7.7%).
- Do the same for all other years and compare the averages.
- Keep the October start, but try a few other end months to make sure the result doesn’t depend on just one window.
And That's a Wrap
So, myth or real? It’s real, alright, but the schedule’s just a bit off. Still, if you’re planning trades based on this seasonal claim, keep an eye on the new year and make sure the chart confirms what the claim suggests.
Notes:
- [1] Kam Fong Chan and Terry Marsh, “Asset Prices, Midterm Elections, and Political Uncertainty,” Journal of Financial Economics 141, no. 1 (2021): 276–296.
- Data: StockCharts monthly closes for $SPX (1970–2026) and $NDX (1985–2026), price only; author’s calculations.