Brazil Under Pressure: A Contrarian Buying Opportunity?

The reelection of Luiz Inácio Lula da Silva caught many investors off guard, as financial markets had largely anticipated a victory by Flávio Bolsonaro, who was generally regarded as the more fiscally conservative and market-friendly candidate. The unexpected outcome triggered a sharp decline in Brazilian equities and a surge in bearish sentiment. However, my reading of the charts suggests that the negative reaction may have been excessive and, provided other indicators are supportive, could represent a short-term buying opportunity.
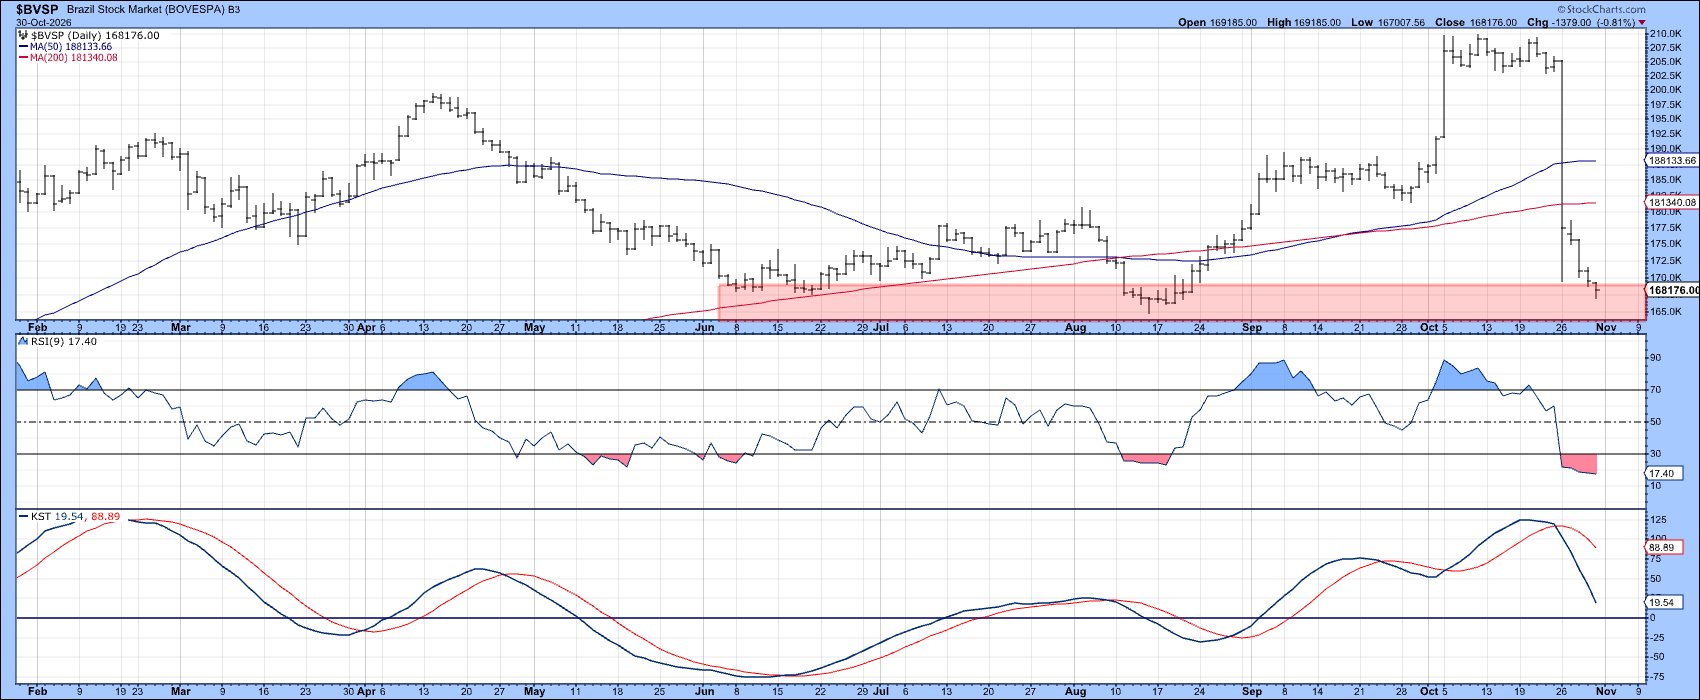
From a technical perspective, the Bovespa ($BVSP) offers only a modestly constructive outlook, having retreated to the red-shaded support zone rather than displaying any obvious signs of strength. Even so, the Relative Strength Index (RSI) has fallen into deeply oversold territory, a condition that often precedes at least a temporary rebound. Under those circumstances, it wouldn't be surprising to see the market stage a relief rally from current levels, but that’s about it.
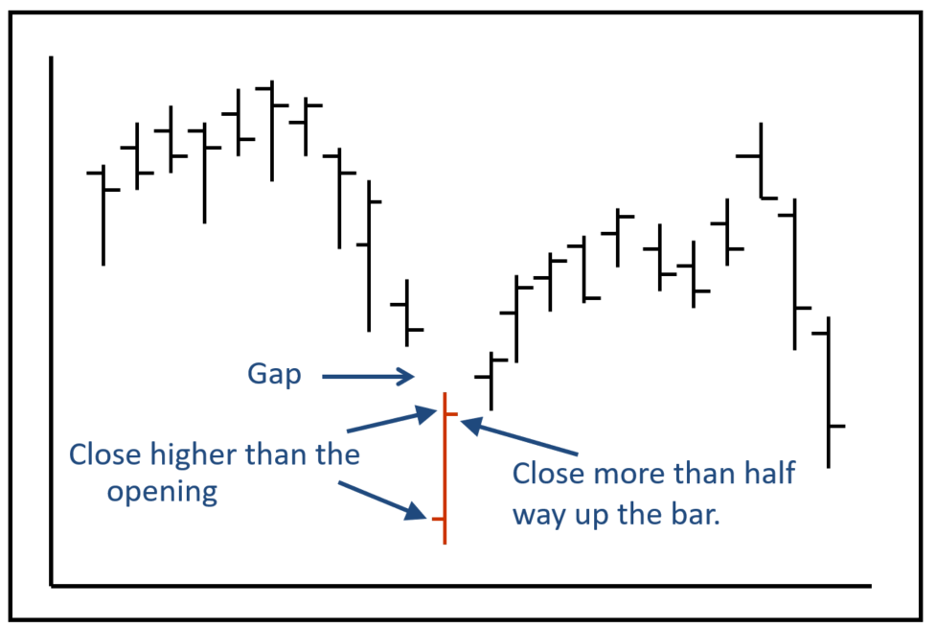
However, when viewed through the lens of the U.S.-listed iShares MSCI Brazil Capped ETF (EWZ), the technical picture appears considerably more encouraging. Chart 2, for example, shows what looks to be a bullish exhaustion day, a pattern that often signals a decline may be nearing completion. Figure 1 illustrates a textbook example of this formation, highlighted by the wide red bar.
Bullish exhaustion patterns typically emerge following a sharp and persistent decline. They are characterized by a sizable opening gap in the direction of the prevailing short-term trend, combined with an unusually wide trading range relative to preceding bars. Equally important, the close should reverse strongly against the initial move, finishing in the upper half of the bar and leaving a large unfilled gap to its left. A pronounced surge in trading volume adds to the bar’s significance, as it reflects an intense struggle between buyers and sellers. Together, these characteristics suggest that selling pressure has been exhausted, with buyers now holding the upper hand.
This pattern is rooted in the psychology of a climactic, emotionally charged selling wave. Traders who have been caught up in the prevailing downtrend rush to liquidate positions at the open, only to discover that the pool of willing sellers is rapidly exhausted. As selling pressure fades, buyers step in aggressively, overwhelming the remaining supply and reversing the market’s direction. In this instance, panic-driven liquidation on exceptionally heavy volume appears to have flushed out much of the available supply, enabling buyers to seize control and frustrate bearish expectations before the session ended.
Turning to Chart 2 and the EWZ, we find a close resemblance to the idealized example shown in Figure 1. The unusually wide trading range and extraordinary volume surge point to an intense struggle between buyers and sellers. Admittedly, the substantial decline between the pre-election and post-election closes confirms that sellers initially dominated the market's reaction to the news. However, the action during the exhaustion day tells a different story.
Despite opening sharply lower, the ETF finished well above its opening level, indicating that buyers ultimately wrested control from sellers and regained the upper hand by the close. Such price behavior is often a sign that bearish sentiment has reached an extreme and that the market may be in the process of establishing at least a short-term low.
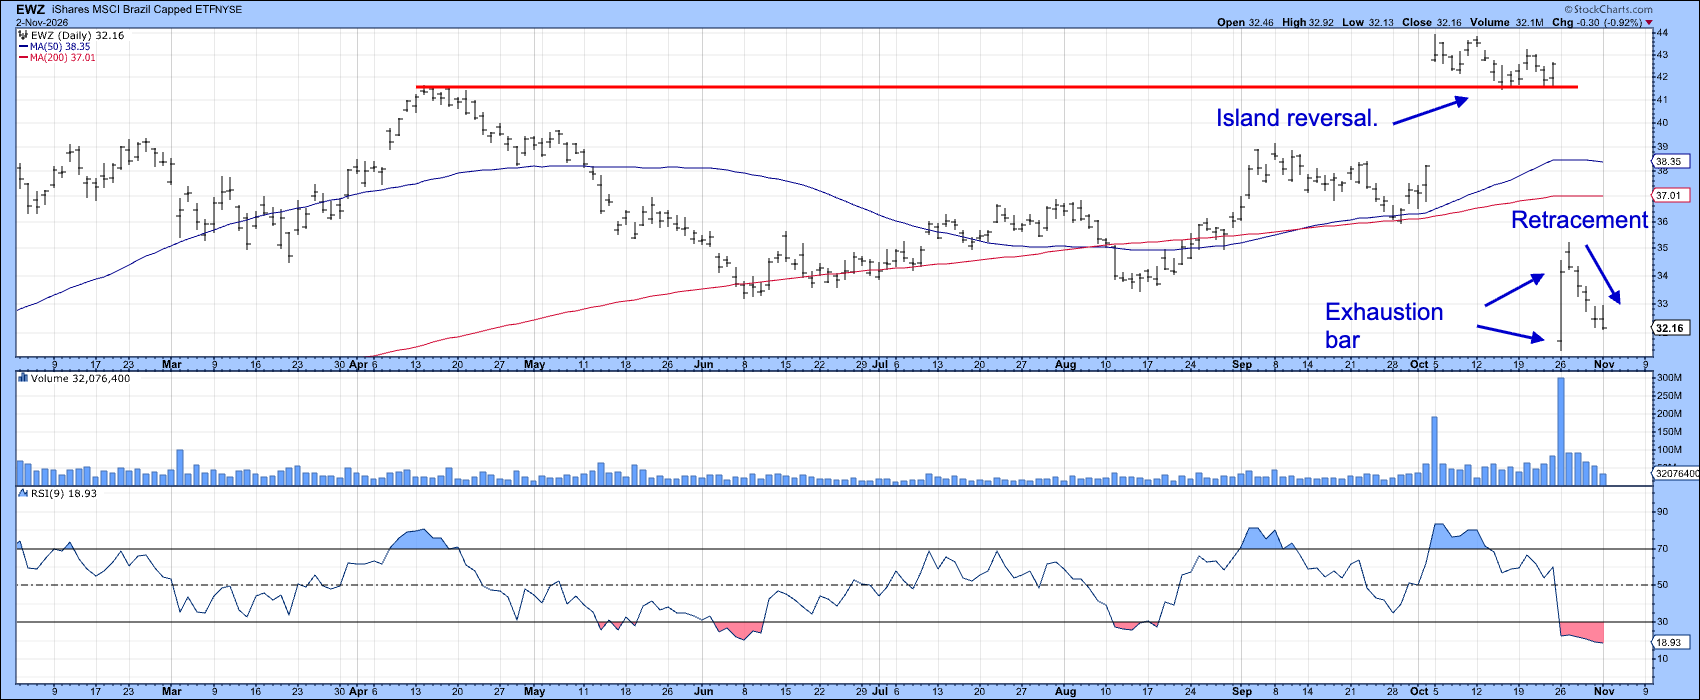
The retreat since then marks a normal retracement move, as characterized by the progressively shrinking volume. That, together with the deeply oversold RSI in the bottom window, suggests that there will be a worthwhile attempt to close the gap created when price violated the red horizontal line. However, should price drop and hold decisively below the low of the exhaustion bar, all bets would be off, and a far more negative outlook would be justified.
The Longer-Term Picture
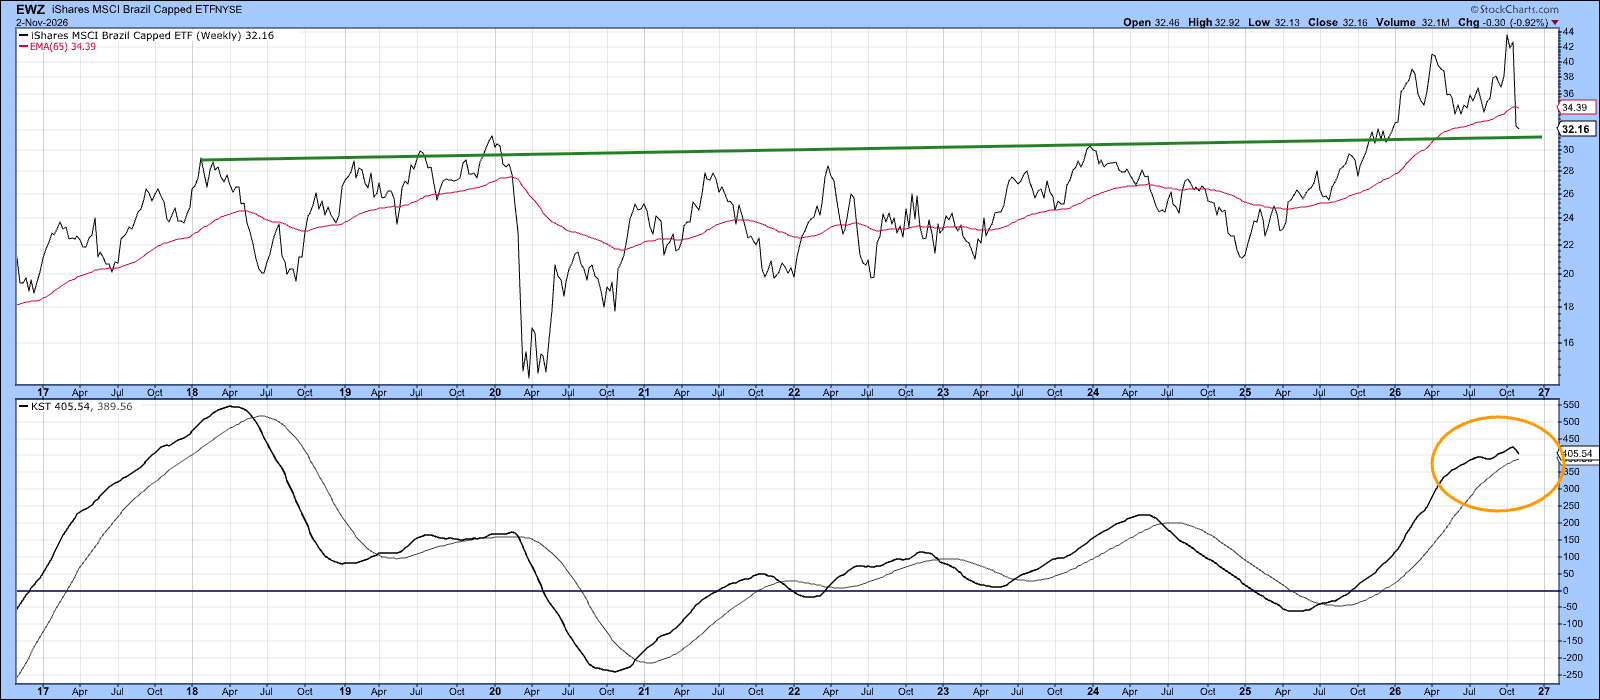
Chart 3 places the recent action in a broader perspective. Late last year, EWZ broke out from an eight-year consolidation range, a development that typically carries important long-term implications. Such extended bases often act as powerful launching pads for future advances, suggesting the structural backdrop remains constructive despite the recent volatility.
If the exhaustion bar proves effective and sparks a rally capable of challenging recent highs, the breakout that emerged in late 2025 could serve as the foundation for a significantly higher advance over time. Conversely, if the pattern fails to generate a meaningful recovery, the long-term KST in the lower panel would likely continue its recent deterioration. Under those circumstances, the indicator could eventually trigger a sell signal, raising the possibility that the breakout will fail and that a more prolonged corrective phase lies ahead.
Good luck and good charting,
Martin J. Pring
The views expressed in this article are those of the author and do not necessarily reflect the position or opinion of Pring Turner Capital Group of Walnut Creek or its affiliates. The Six Stages of the Business Cycle are followed each month in Martin Pring’s Intermarket Review.