S&P 500 Breaks Key Support. Here’s What Could Happen Next

Key Takeaways
- With the S&P 500 below its 200-day moving average and the Nasdaq in a downtrend, investors should tread with caution as they navigate the stock market.
- A stronger U.S. dollar and rising Treasury yields are putting pressure on gold and silver prices.
- Beyond the AI selloff, investors should watch key support levels, Treasury yields, and the dollar for clues about the stock market's next move.
With NVIDIA (NVDA) earnings in the rearview mirror, Wall Street’s attention is shifting to the Anthropic IPO. The stock is scheduled to begin trading on the Nasdaq on Thursday under the ticker symbol ANT.
The IPO is taking place at a time when investors haven’t been embracing AI-related stocks. With concerns about excessive spending and lofty valuations weighing on the sector, Anthropic’s first few days of trading could offer some valuable clues about investor sentiment. Will the IPO revive the enthusiasm for AI stocks, or will investors continue to be cautious?
For now, the technical picture isn’t encouraging.
The Stock Market Is Showing Signs of Weakness
The Nasdaq Composite ($COMPQ) bounced off the 24,000 support level on Tuesday (see chart below). Post-NVDA earnings day didn’t generate much excitement in the stock market. The Nasdaq remains in a downtrend, with a series of lower highs and lower lows. Until that pattern changes, it’s difficult to make a bullish case.
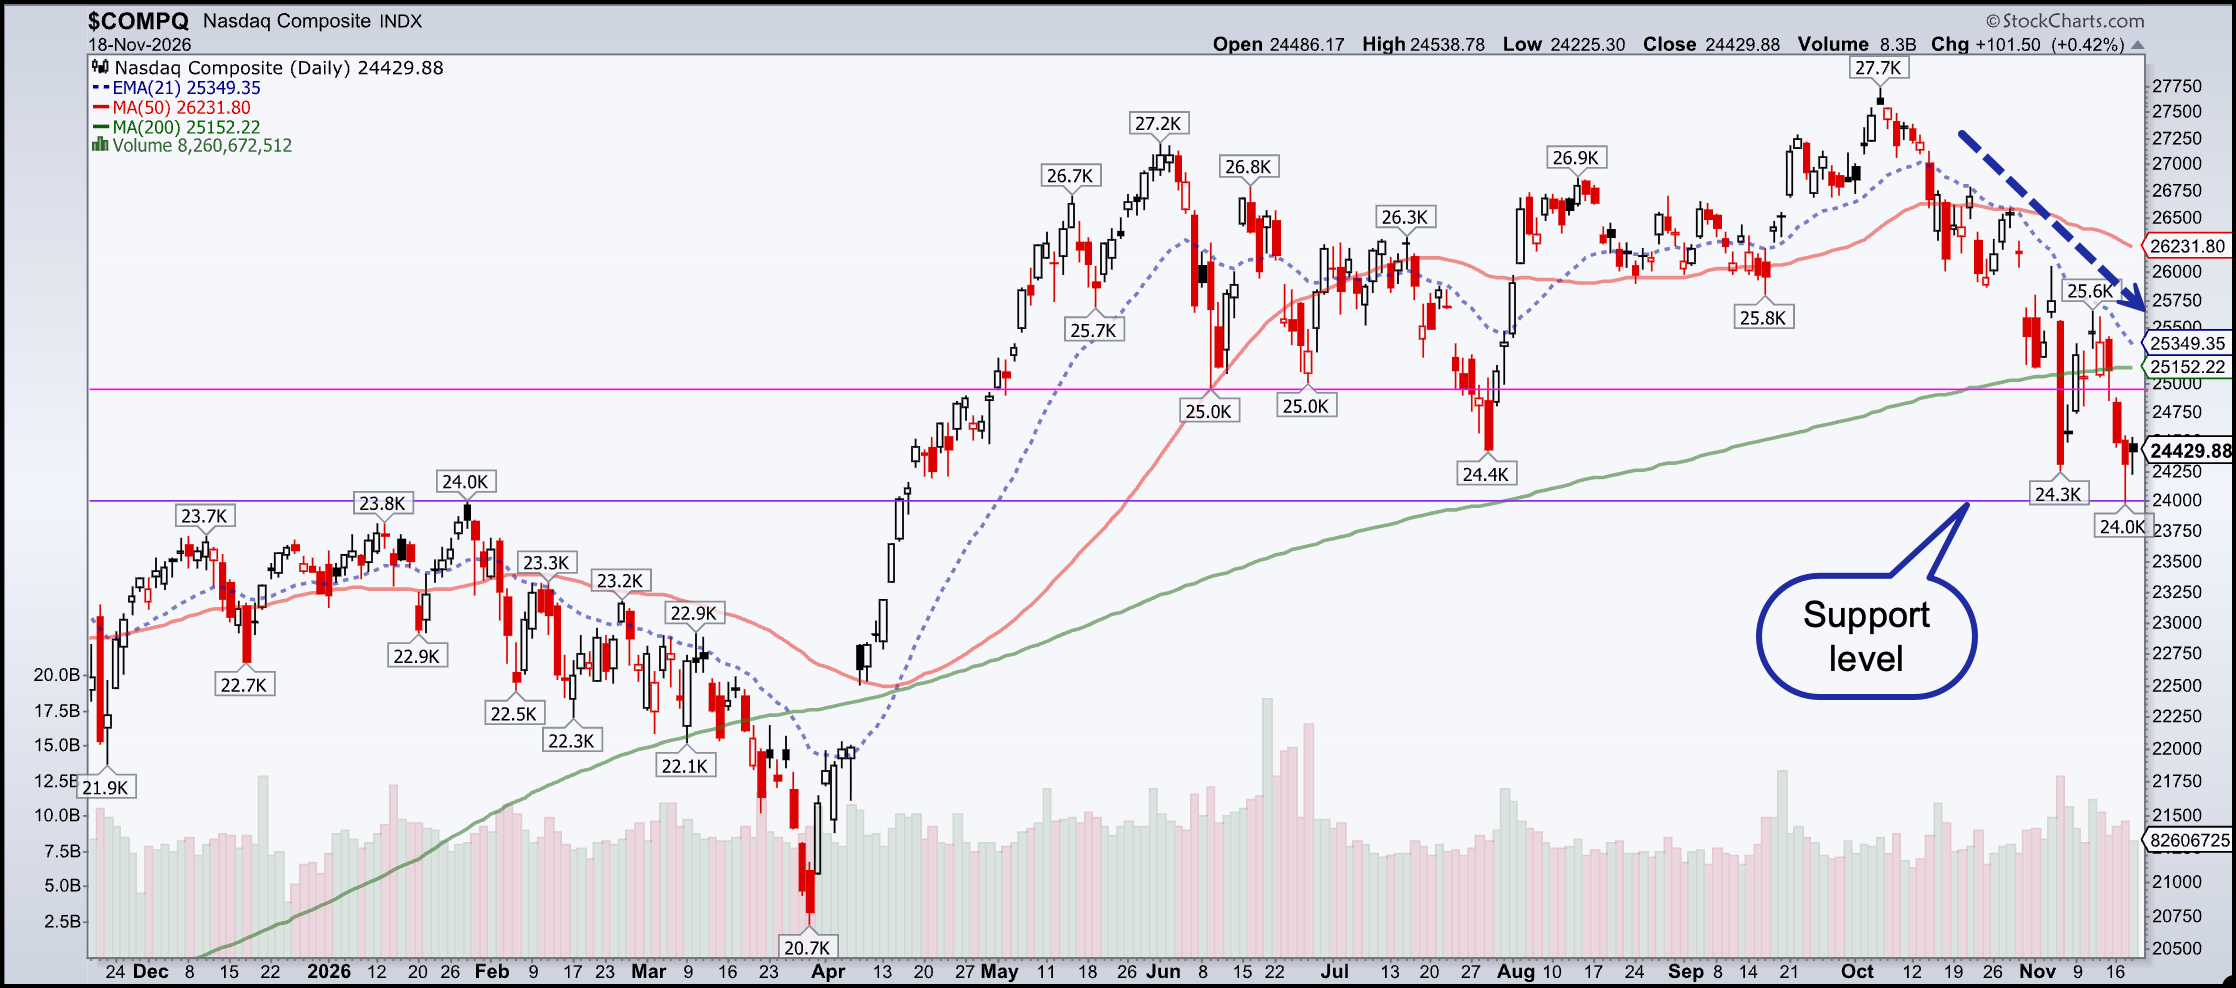
The weakness extends beyond the Nasdaq. If you look at the US Indexes in the Equities panel on the Market Summary page, sorted by the 200-day simple moving average (SMA) column, you’ll see what I mean. Only a few indexes are above their 200-day SMA, and every index is trading below its all-time high. This data doesn’t support a healthy market.
The S&P 500 ($SPX) is also flashing warning signs. The index has now closed below its 200-day SMA. This puts the index below three key levels.
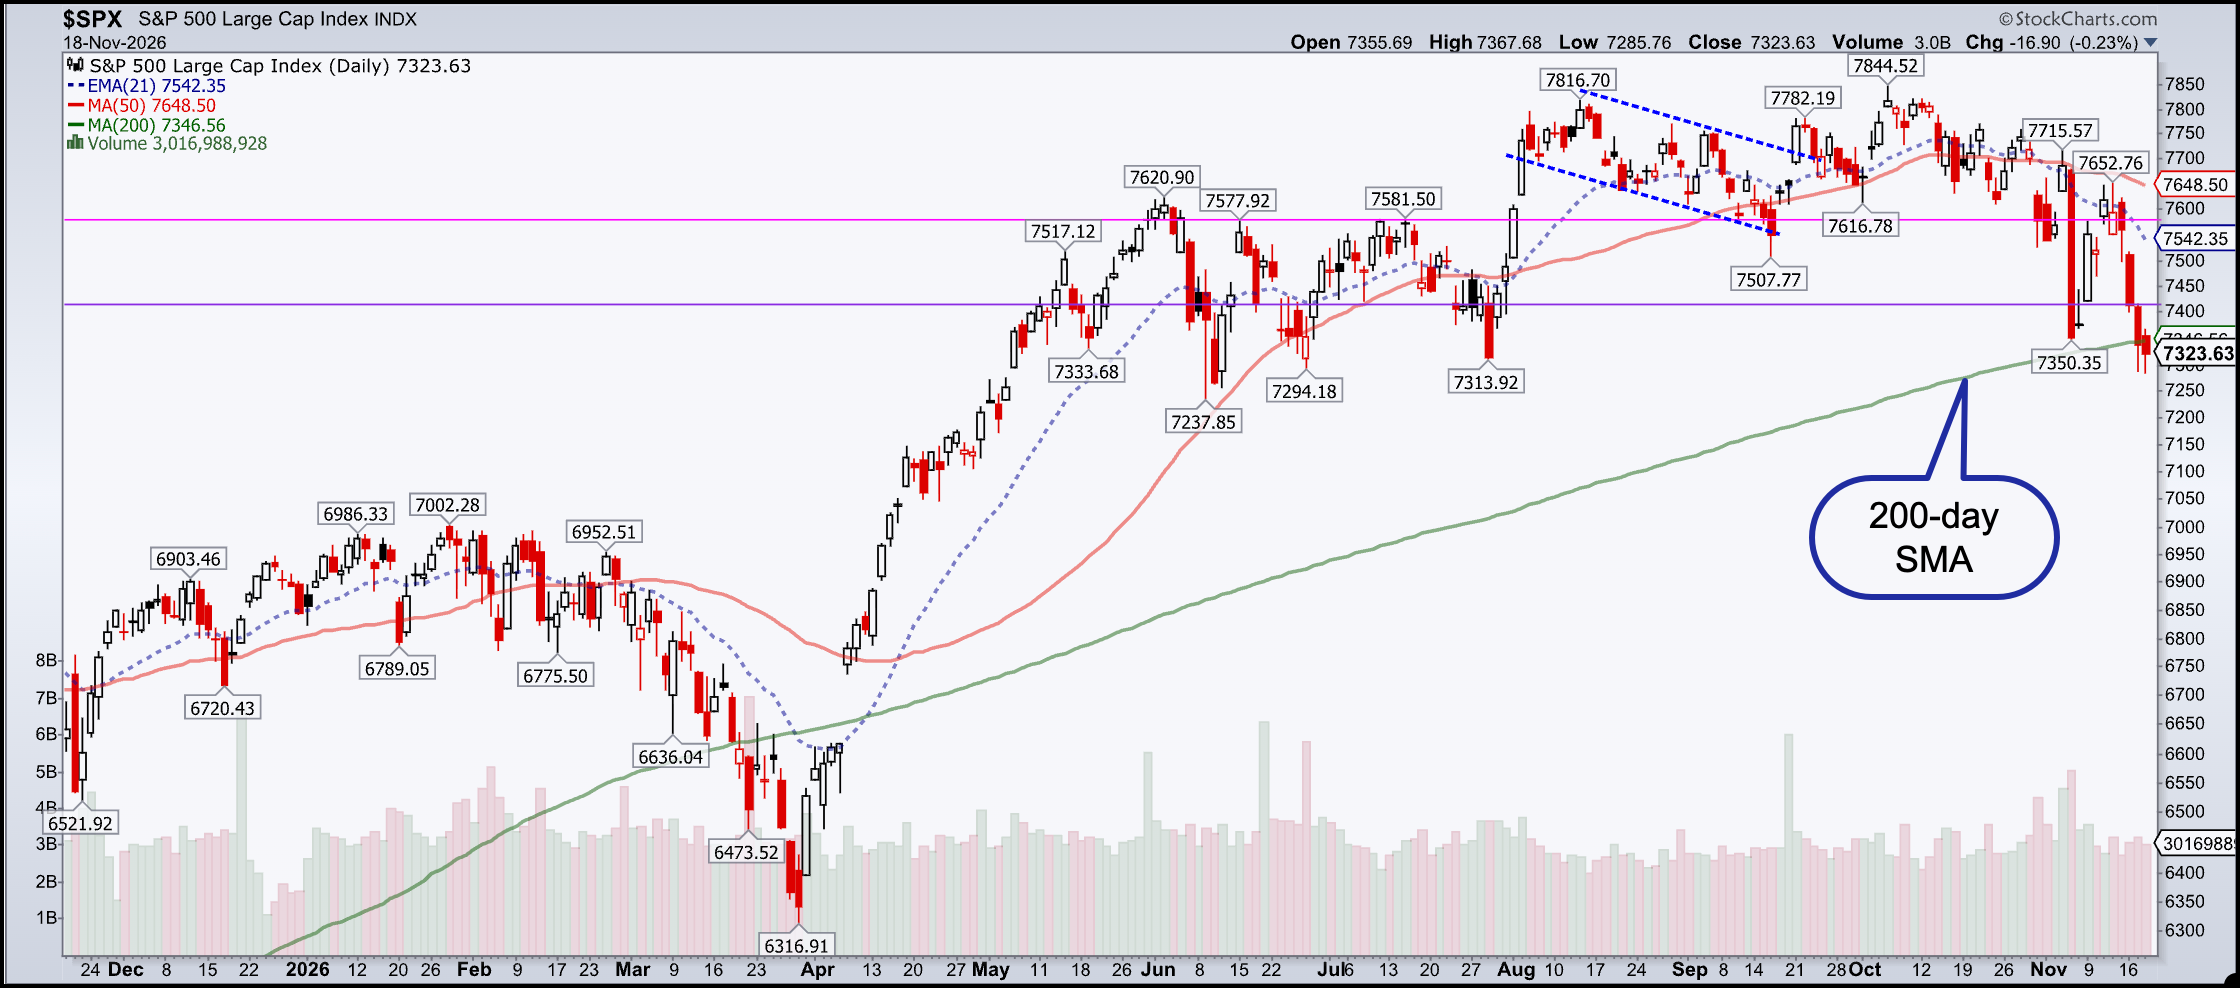
Where might the S&P 500 find its next support? To answer this question, let’s switch to a weekly chart.
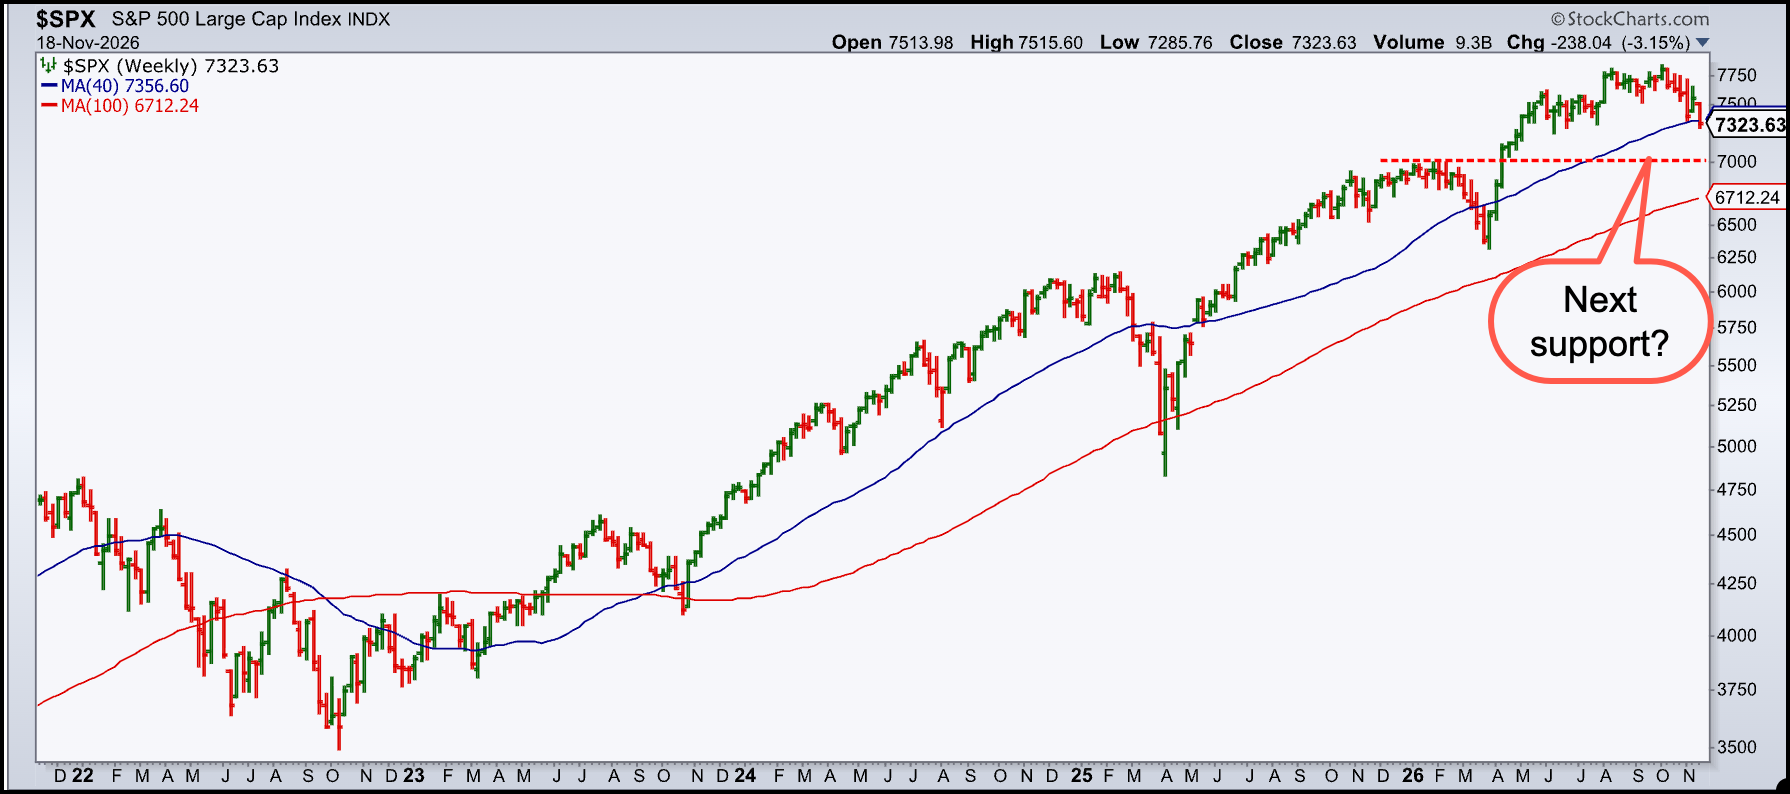
The first level I’d watch is 7,000. If the index breaks below that, the next potential level would be the 100-week SMA. The last time the S&P 500 crossed below this moving average was in early April 2025, when the Liberation Day tariff announcement shook Wall Street. This time, the concerns are the stretched valuations of AI-related stocks and whether the enormous spending on AI infrastructure can be justified.
An observation I made is that we’re not seeing the widespread panic selling that characterized the dot-com bubble burst or the financial crisis. Although the Dow Jones Industrial Average ($INDU) and the S&P 500 closed lower on Wednesday, the Nasdaq managed a 0.42% gain.
Keep an Eye on the U.S. Dollar
While stocks have been struggling, the U.S. dollar has been moving in the opposite direction. Hawkish comments from the latest FOMC minutes suggest the Fed is likely to raise interest rates at its December meeting. The rising dollar and the prospect of higher interest rates helped support the U.S. dollar, which continues to be resilient. To get a perspective on how much the dollar has gained, look at the chart of the Euro to US Dollar ($EURUSD) below.
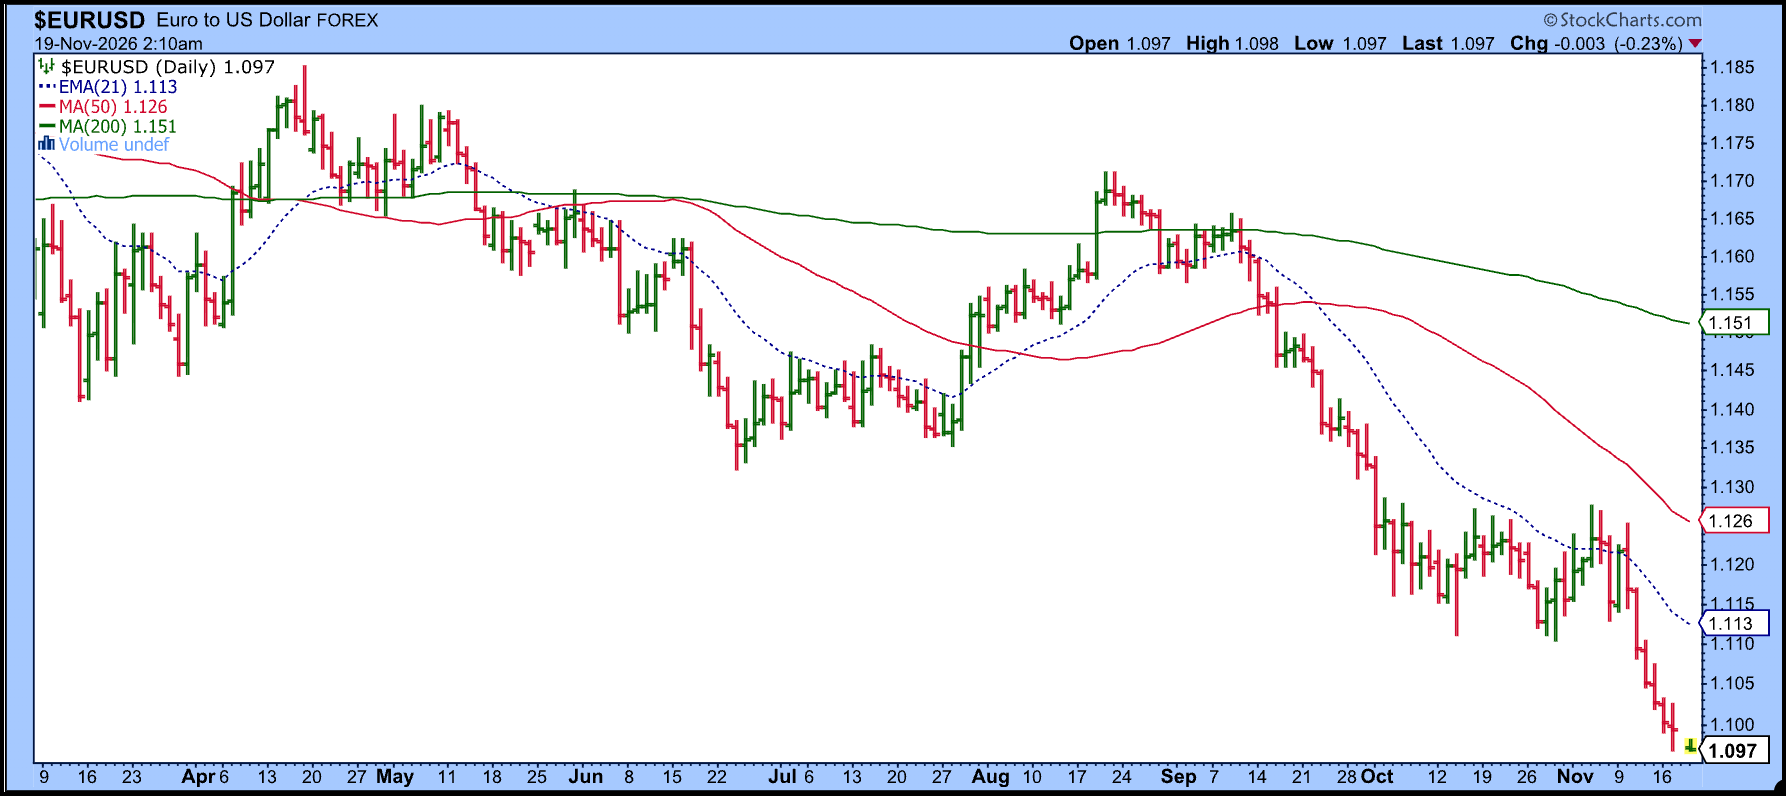
The currency pair has fallen to its lowest level in a year. But the daily chart doesn’t give the big picture. Switching to a weekly chart gives a better perspective on where the currency pair could be headed.
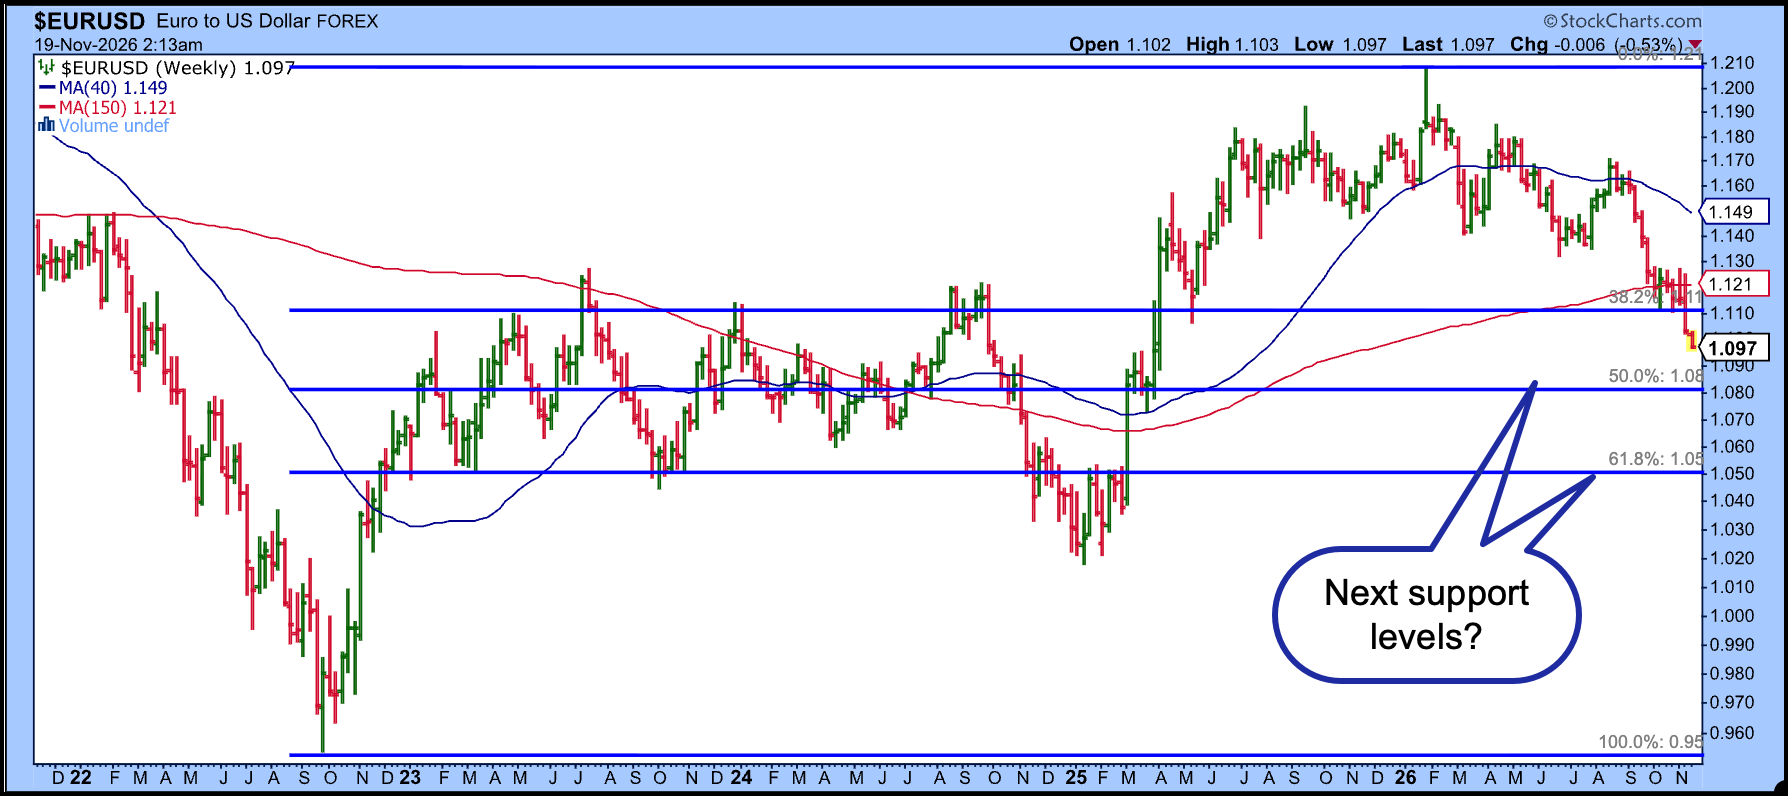
I’ve applied Fibonacci retracement levels to the weekly EUR/USD chart. Notice the pair is between the 38.2% and 50% Fib levels. The 50% is the next potential area of support, followed by the 61.8% level.
Looking at the weekly chart, there’s a possibility that the EUR/USD could move lower, which would mean further strength in the U.S. dollar. This would put further pressure on precious metals prices.
Gold and Silver Prices Fall Further
A strong dollar usually creates headwinds for gold and silver. Add rising Treasury yields into the mix, we could see the pressure on precious metals intensify. Gold and silver prices have been declining and there may be more downside ahead, especially if the dollar continues to strengthen.
Let’s look at gold’s weekly chart.
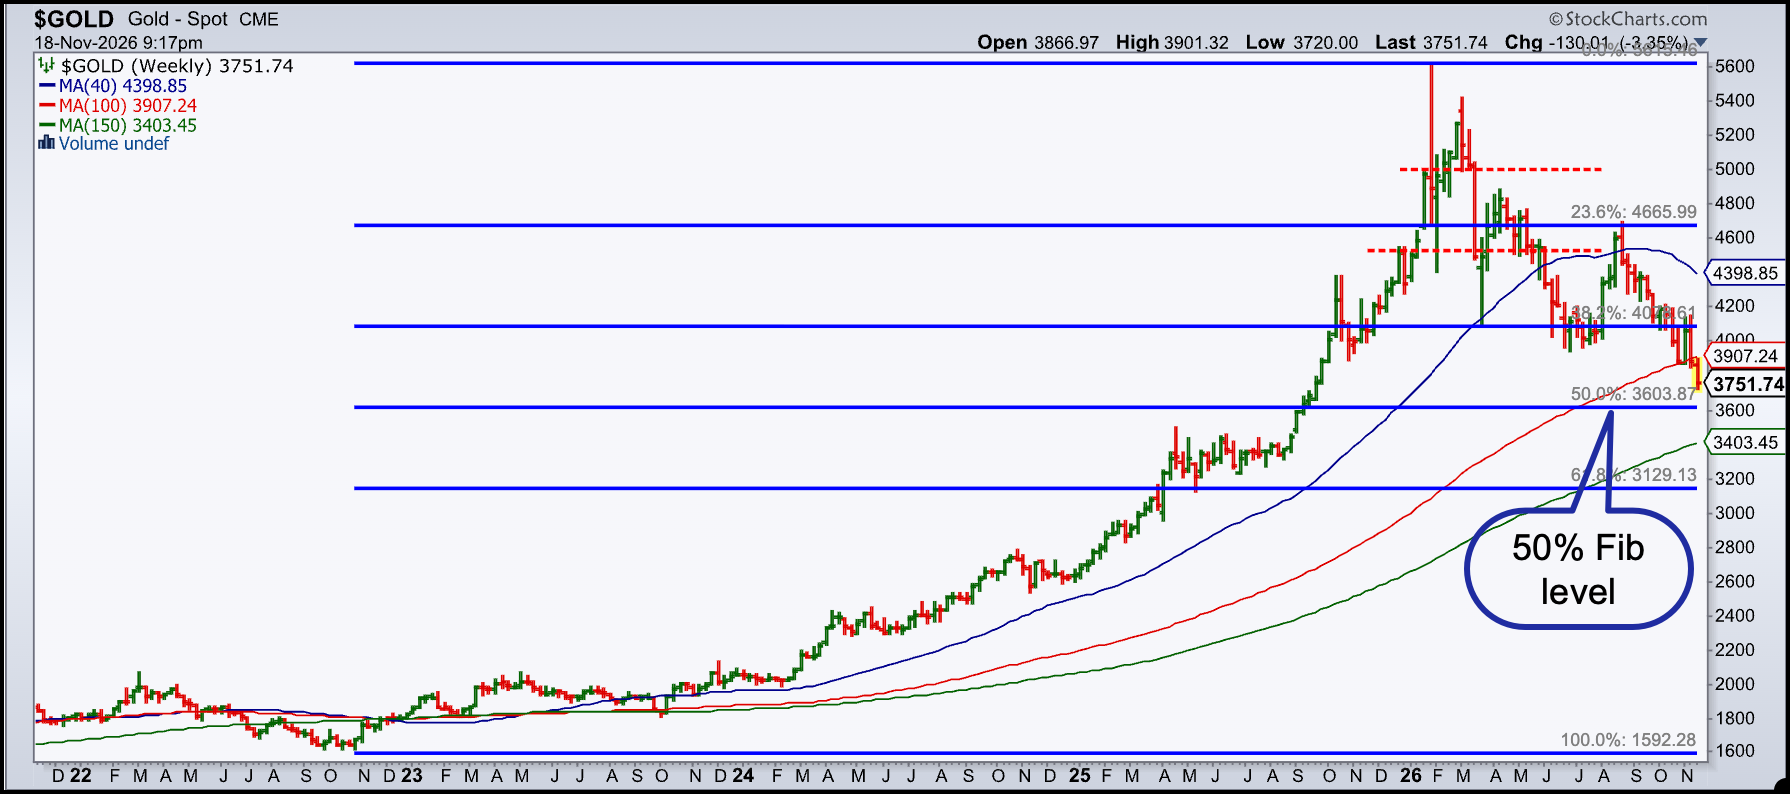
Gold is approaching its 50% Fibonacci retracement level. Will buyers step in at that level, or will gold slice through it and head lower? Be sure to add this chart to your ChartLists, as it can be a leading indicator of the stock market’s overall direction.
The Bottom Line
Concerns about excessive AI spending, the possibility of slower AI buildouts with Democrats controlling Congress, and Jensen Huang’s resignation as NVIDIA CEO have contributed to the equity selloff. However, the selloff may have prompted investors to look beyond the mega-cap tech stocks and pay closer attention to the impact of inflation on the U.S. economy.
The stock market indexes are technically vulnerable and investors should pay close attention to the price action. Keep a close watch on the S&P 500’s support levels, watch if the Nasdaq can break its pattern of lower highs and lower lows, and follow the dollar and Treasury yields for clues on the macro picture.
Disclaimer: This blog is for educational purposes only and should not be construed as financial advice. The ideas and strategies should never be used without first assessing your own personal and financial situation, or without consulting a financial professional.