Is NVIDIA a Buy? If So, For How Long?

Early this morning, as is my routine, I sat down with my iPad to catch up on the news. I was immediately greeted by numerous front-page stories, including those from both The Wall Street Journal and The New York Times, detailing allegations involving NVIDIA (NVDA) and the Huang family.
From a contrarian perspective, the widespread media attention had all the hallmarks of a classic setup. However, it rarely pays to form an investment opinion solely because a story dominates the headlines. A more reliable approach is to turn to the charts, where the evidence can be evaluated more objectively and emotions are largely removed from the analysis.
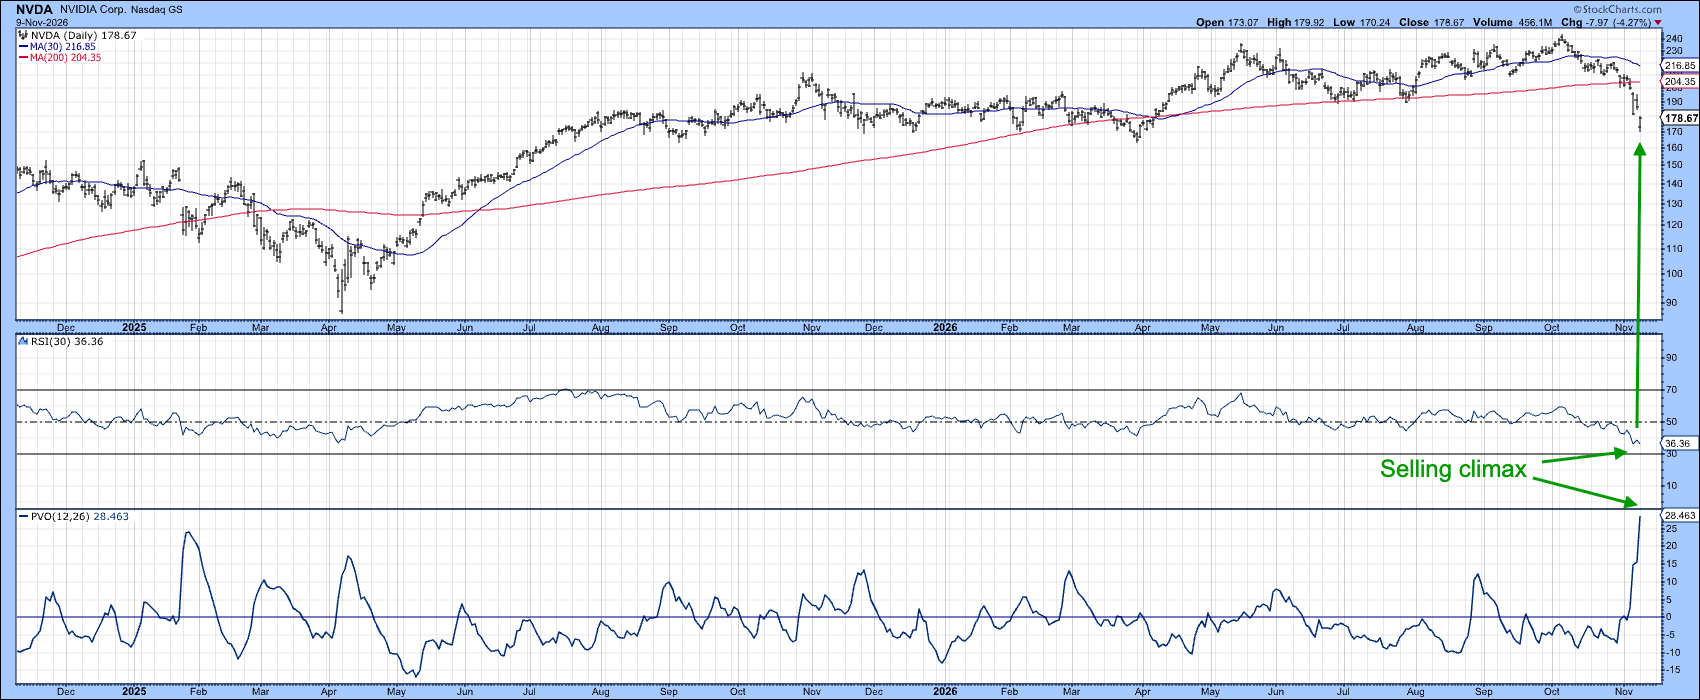
In that regard, Chart 1 shows that NVDA has been under persistent selling pressure, declining on nearly every trading day since the first week of October. At the same time, the Percentage Volume Oscillator (PVO) has climbed to its highest level on the chart, marking its most elevated reading since late 2021. Coupled with a deeply oversold 30-day Relative Strength Index (RSI), this combination strongly suggests the stock may be experiencing a classic selling climax. Admittedly, the PVO has yet to reverse lower and could still move to even more extreme levels before the selling pressure is fully exhausted.
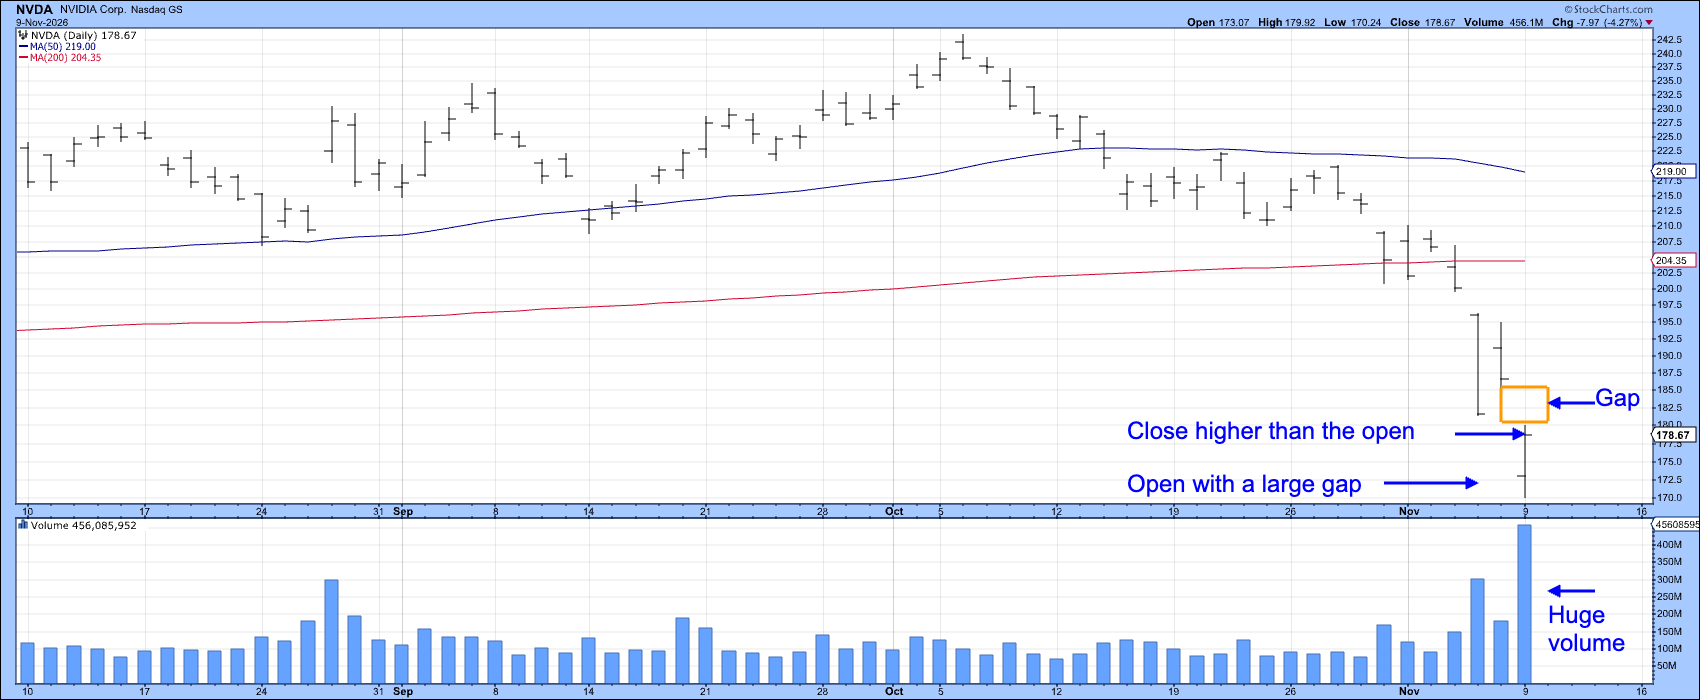
However, Chart 2 suggests that today's price action may represent an exhaustion bar. I discussed this one-day reversal pattern in an article last week; in brief, exhaustion bars typically develop after a persistent decline, with prices opening sharply lower on a downside gap. Although the security still closes lower on the day, it finished above the opening price, leaving a gap to the right of the bar. That higher close is significant because it indicates that buyers gained the upper hand as trading progressed.
The chart also shows exceptionally heavy volume, highlighting the intensity of the battle between buyers and sellers and adding weight to the signal. An exhaustion bar doesn’t guarantee a bottom or an imminent rally. Indeed, prices may need to bounce around above the exhaustion day low. All in all, though, Monday's trading action suggests that this could be a logical point at which to anticipate at least a tradable rebound.
The Long-Term Trend
From a longer-term standpoint, NVDA's momentum profile has been deteriorating since 2023. The evidence lies in the series of progressively lower peaks in the 39-week Rate of Change (ROC), which stand in sharp contrast to the stock's succession of higher price highs. As Chart 3 illustrates, the ROC surged to approximately +300% in mid-2023 but reached only about +25% at October's all-time high. This negative momentum divergence indicates that upside participation has been steadily eroding, despite rising prices. The bearish implications of that divergence have since been reinforced by decisive breaks of the 50-day and 200-day moving averages and a penetration of the major uptrend line that has guided the advance since 2023.
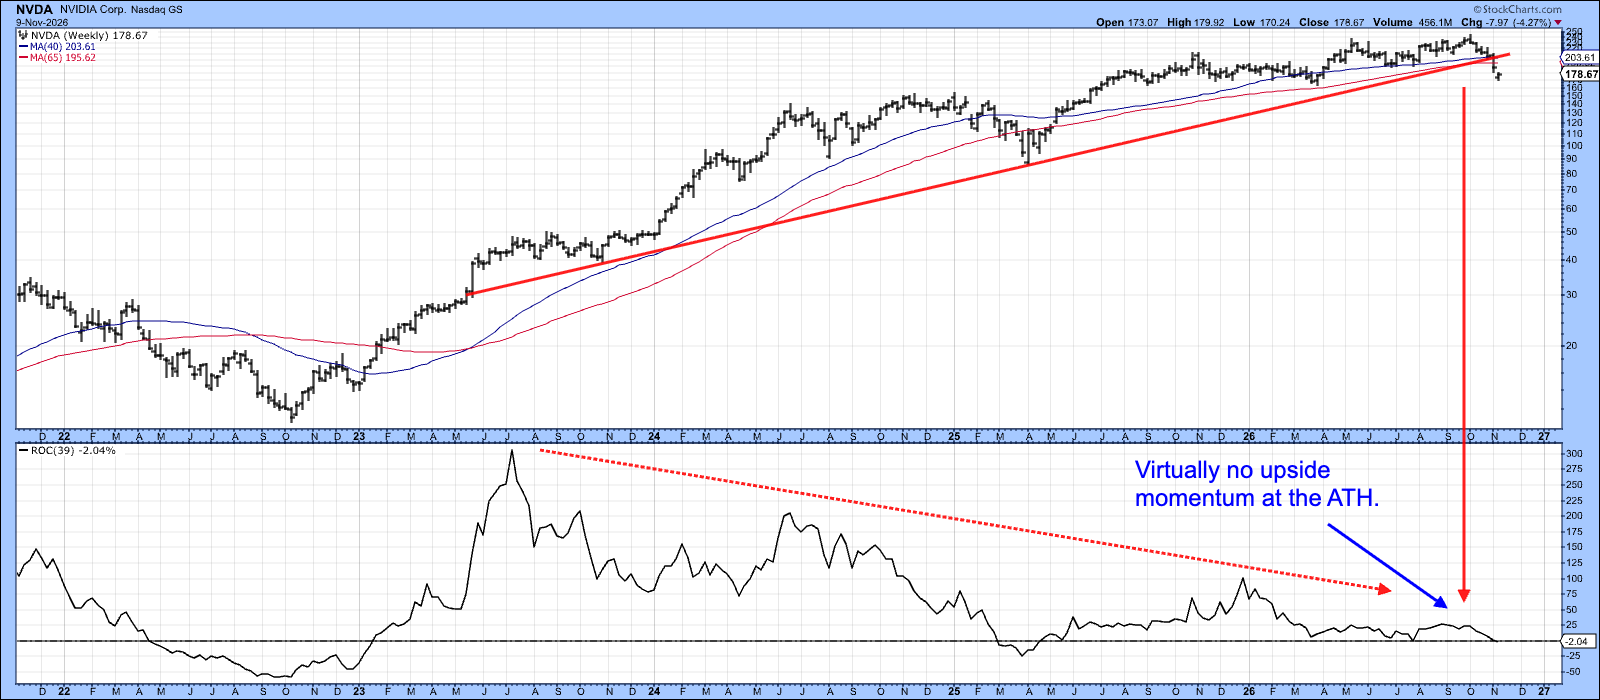
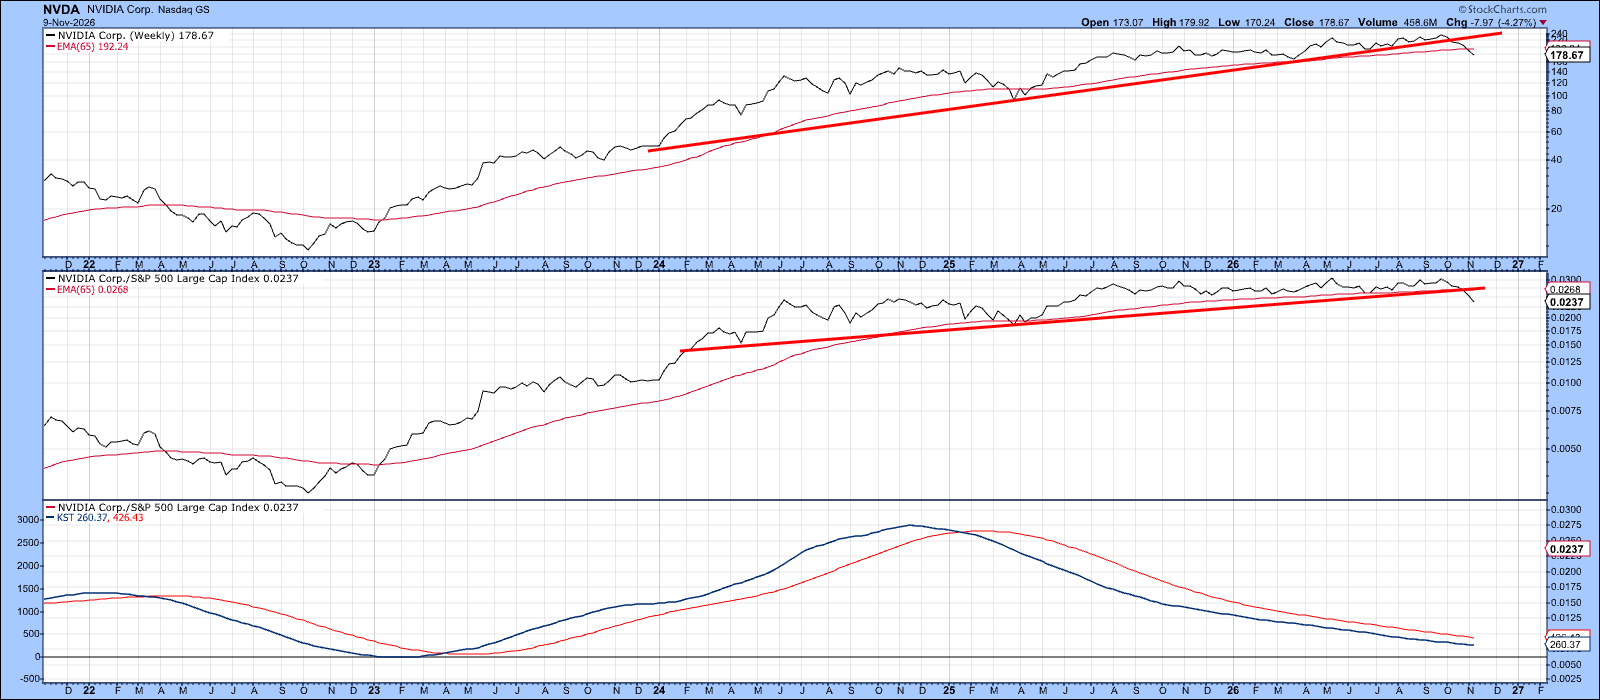
Chart 4 presents the data on a weekly basis using closing prices and includes NVDA's relative strength line versus the S&P 500 ($SPX). The stock price and the relative strength line have broken below their respective 65-week EMAs and secondary uptrend lines. The violation by the relative strength line and its EMA has been especially decisive, suggesting that NVDA may have entered an extended period of relative underperformance versus the broader market.
The Bottom Line
NVDA appears to be experiencing a selling climax, a condition that often paves the way for a meaningful retracement rally capable of recovering a substantial portion of the recent 30% decline. However, the longer-term technical backdrop remains less encouraging. Deteriorating momentum, confirmed negative divergences, and a series of decisive breaks of key moving averages and trendlines all suggest that any near-term strength is more likely to represent a countertrend advance within a broader trading range than a new leg up in the bull market.
Good luck and good charting,
Martin J. Pring
The views expressed in this article are those of the author and do not necessarily reflect the position or opinion of Pring Turner Capital Group of Walnut Creek or its affiliates. The Six Stages of the Business Cycle are followed each month in Martin Pring’s Intermarket Review.