Stocks Are at a Crossroads. Here are 3 Warning Signs to Watch.

Key Takeaways
- The Nasdaq Composite is testing its 200-day simple moving average and needs to break its series of lower highs and lower lows to signal a potential recovery.
- Higher Treasury yields and a stronger U.S. dollar could create additional headwinds for equities and precious metals.
- Beyond NVIDIA and AI stocks, inflation, interest rates, and the U.S. dollar could determine the stock market’s next move.
Last week’s selloff may have been the start of a sluggish stretch for the stock market. The Jensen Huang saga only added to the uncertainty, putting more pressure on NVIDIA (NVDA) and technology stocks in general. But how much damage has it done to the broader market?
Let’s Take a Closer Look
The Nasdaq Composite ($COMPQ) has been trying to find its footing. After falling to a low of 24,300, the index staged a rebound, climbed back above the 25,000 level, broke above its 200-day simple moving average (SMA), and moved toward its 21-day exponential moving average (EMA).
For a while, it looked like buyers were gaining some ground. Then, another round of negative news stalled the rally. By Friday’s close, the Nasdaq was back at its 200-day SMA.
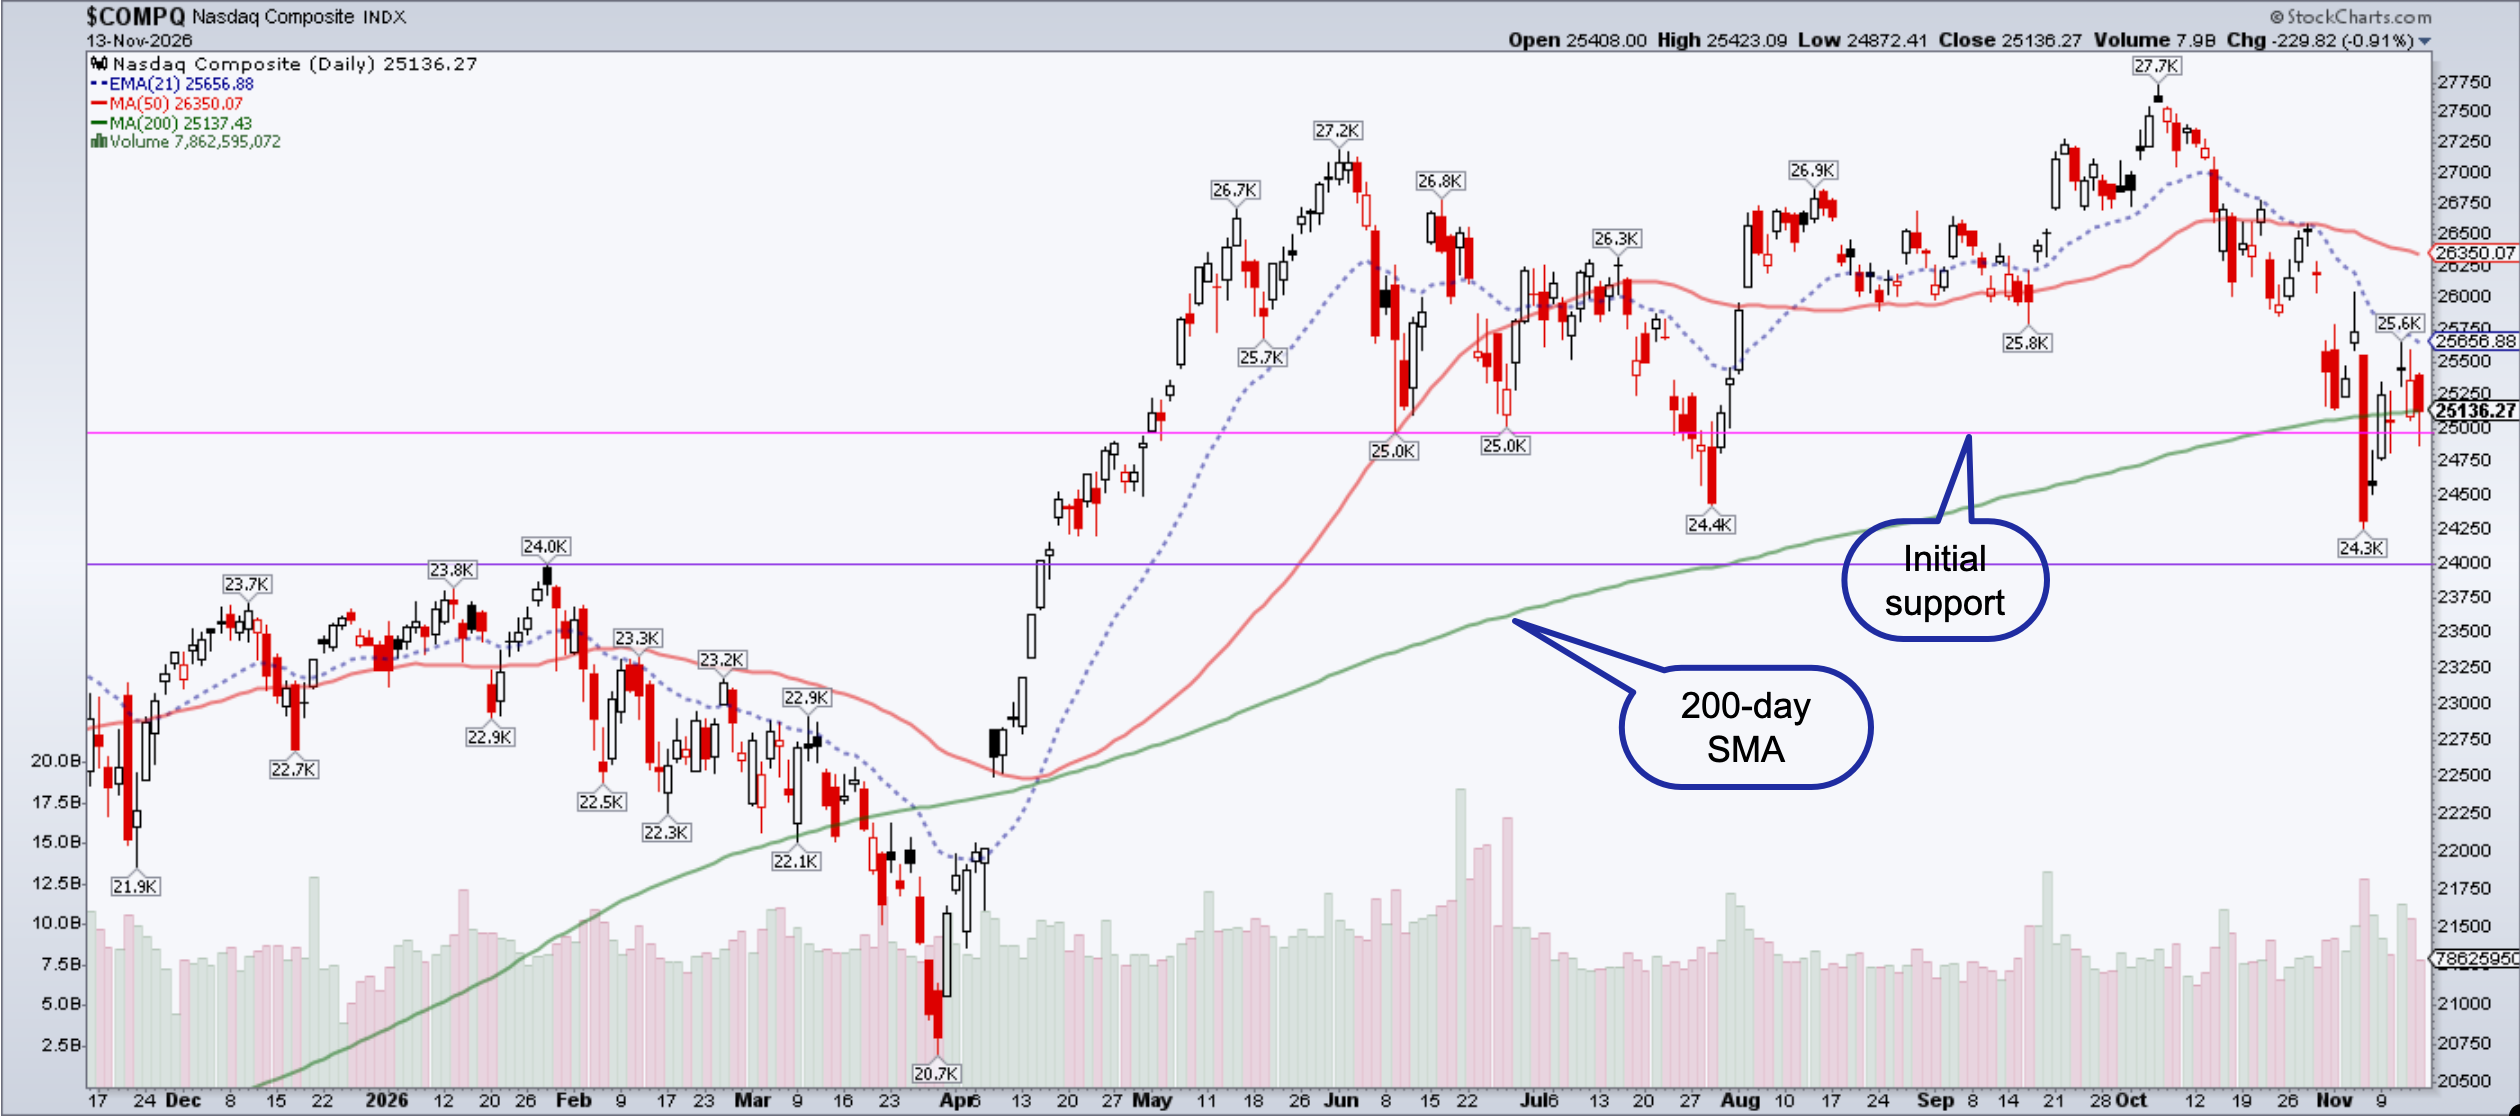
On Thursday, after news of Huang’s resignation as NVIDIA’s CEO, the Nasdaq initially moved higher, only to reverse course and close below its 200-day SMA, erasing the previous day’s gains.
What’s more concerning is the pattern developing on the chart. The Nasdaq continues to make lower highs and lower lows, a sign of a downtrend. Notice how those lower highs have closely tracked the 21-day EMA.
The first sign of a recovery would be a decisive move above the 21-day EMA. However, that’s only half the battle. From there, we need to see a strong follow-through to the upside to indicate the recovery has some power.
The 200-day SMA is an important line in the sand to watch. That doesn’t mean it won’t move lower. To see how much room there is for the Nasdaq to move lower, let’s turn to the five-year weekly chart.
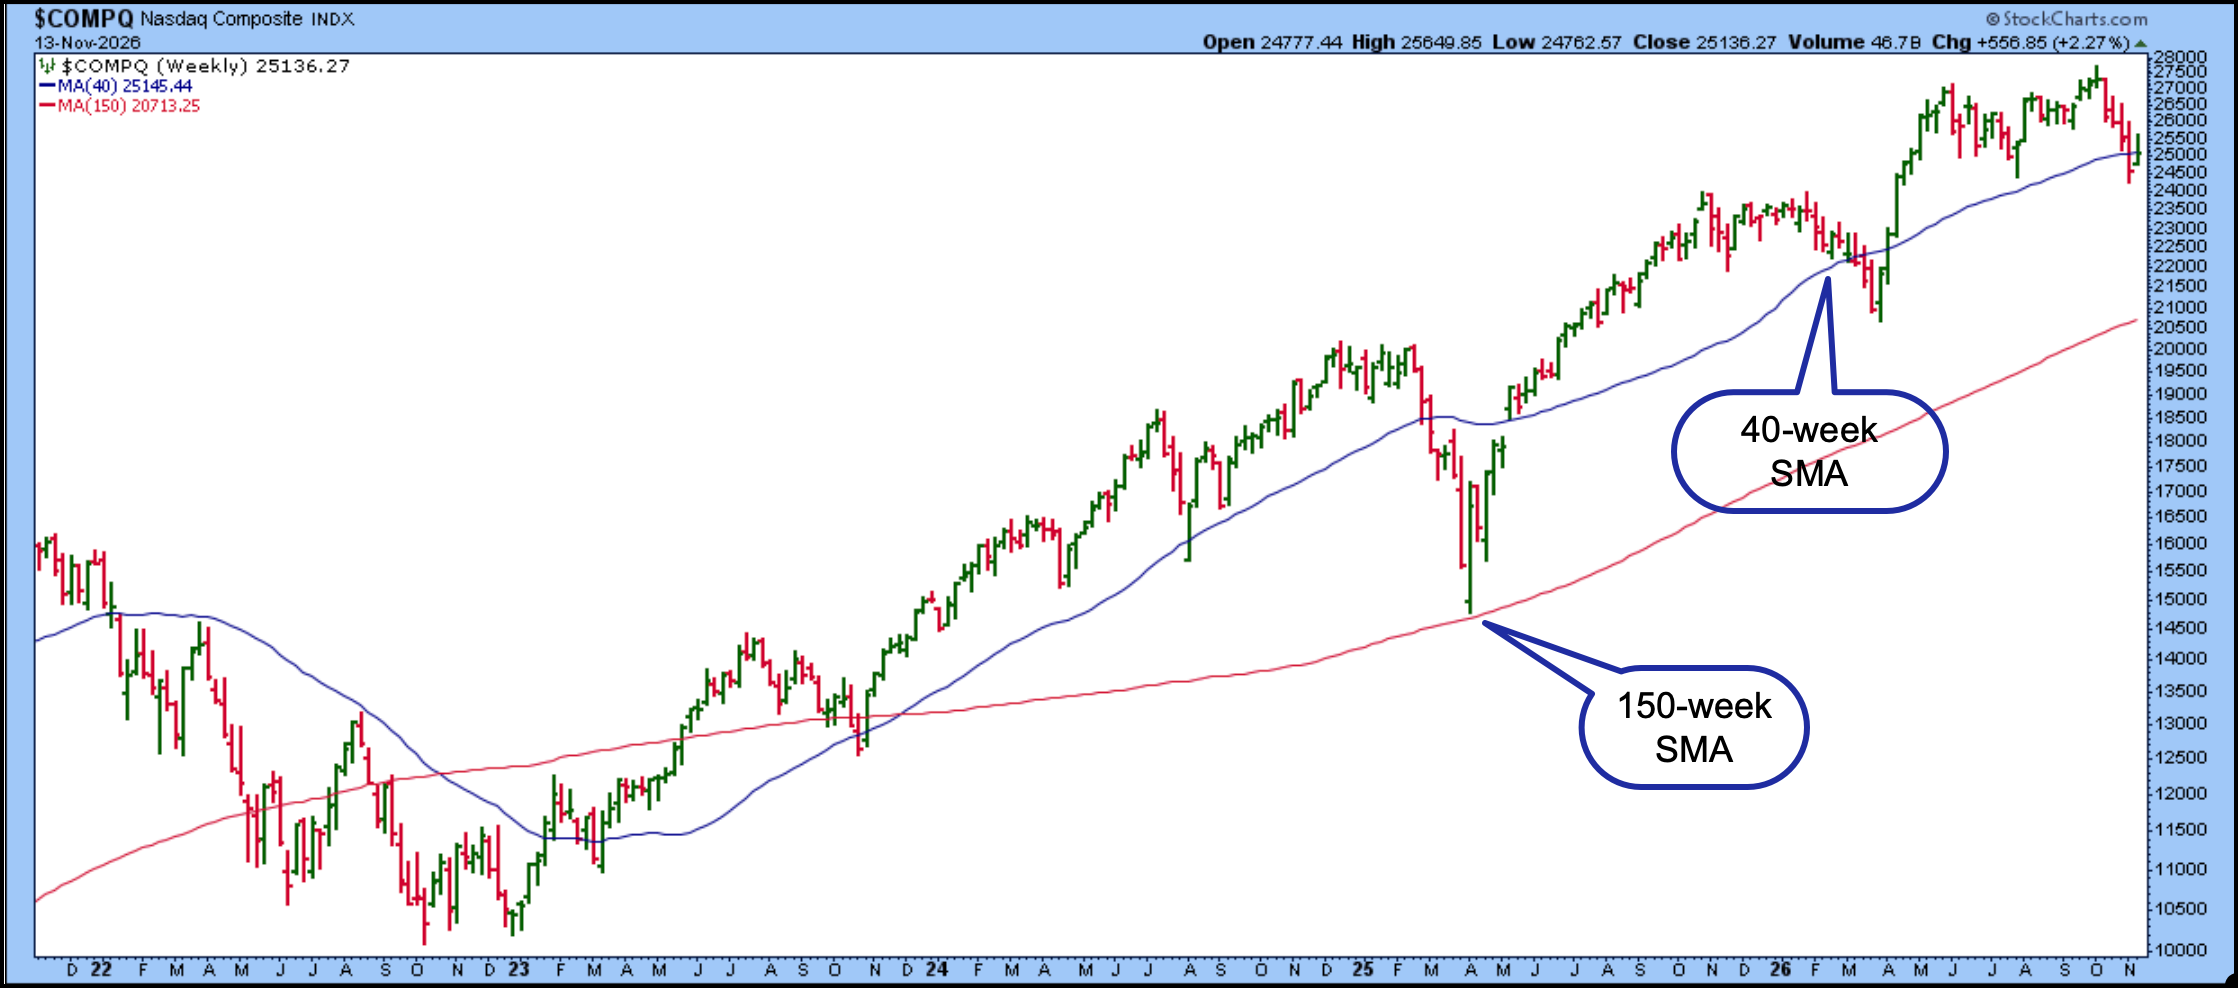
Despite all the volatility, the Nasdaq closed the week with a 2.27% gain. The bullish scenario is that the index holds the 40-week SMA (which is the same as the 200-day SMA) and begins climbing higher, similar to what it did in April 2026. On the other hand, it could break below the 40-week SMA and head toward its 150-week SMA, similar to what it did in April 2025. Keep both these possibilities on your radar, because anything could happen.
NVIDIA is scheduled to report Q3 earnings on Tuesday and, given everything that has happened, you can bet investors will be listening closely for clues about the company’s future direction. With NVDA having had an important role in the AI trade, this earnings report could ripple through to other stocks.
Don’t Overlook the Bigger Picture
With so much attention focused on NVIDIA and AI-related stocks, it’s easy to miss some important developments. U.S. Treasury yields are rising, the U.S. dollar is strengthening, and all this is putting pressure on precious metal prices.
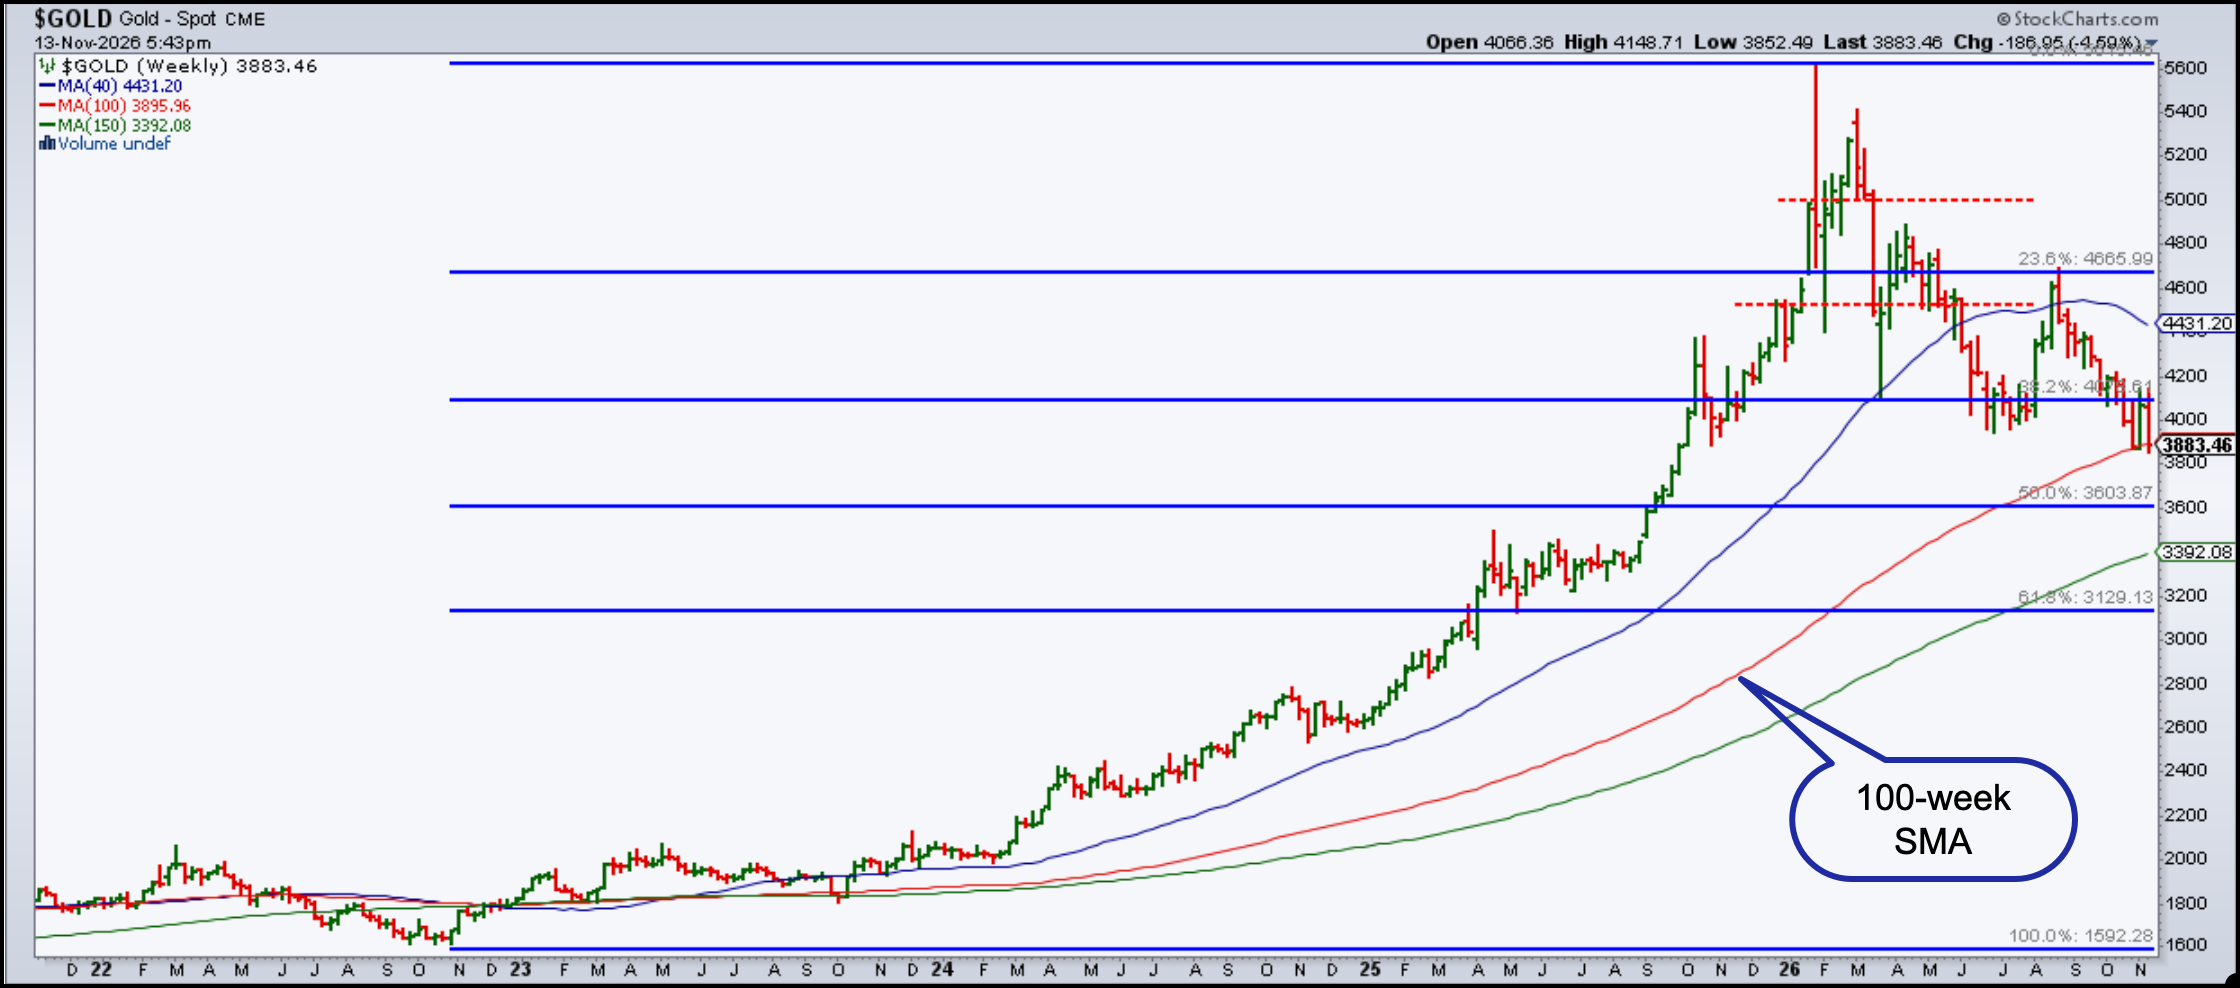
The weekly chart of gold ($GOLD) shows the metal has fallen to its 100-week SMA. It's also between its 38.2% and 50% Fibonacci retracement levels. It could hold this support and begin recovering, but selling pressure could instead push it towards its 150-week SMA.
Meanwhile, U.S. Treasury yields have been climbing after Tuesday’s hotter-than-expected Consumer Price Index (CPI) report. According to the CME FedWatch Tool, there’s a 93.7% probability of a 25-basis point interest rate hike at the December 9 FOMC meeting. The 10-Year U.S. Treasury Yield Index ($TNX) reflects this, with three consecutive days of strong gains.
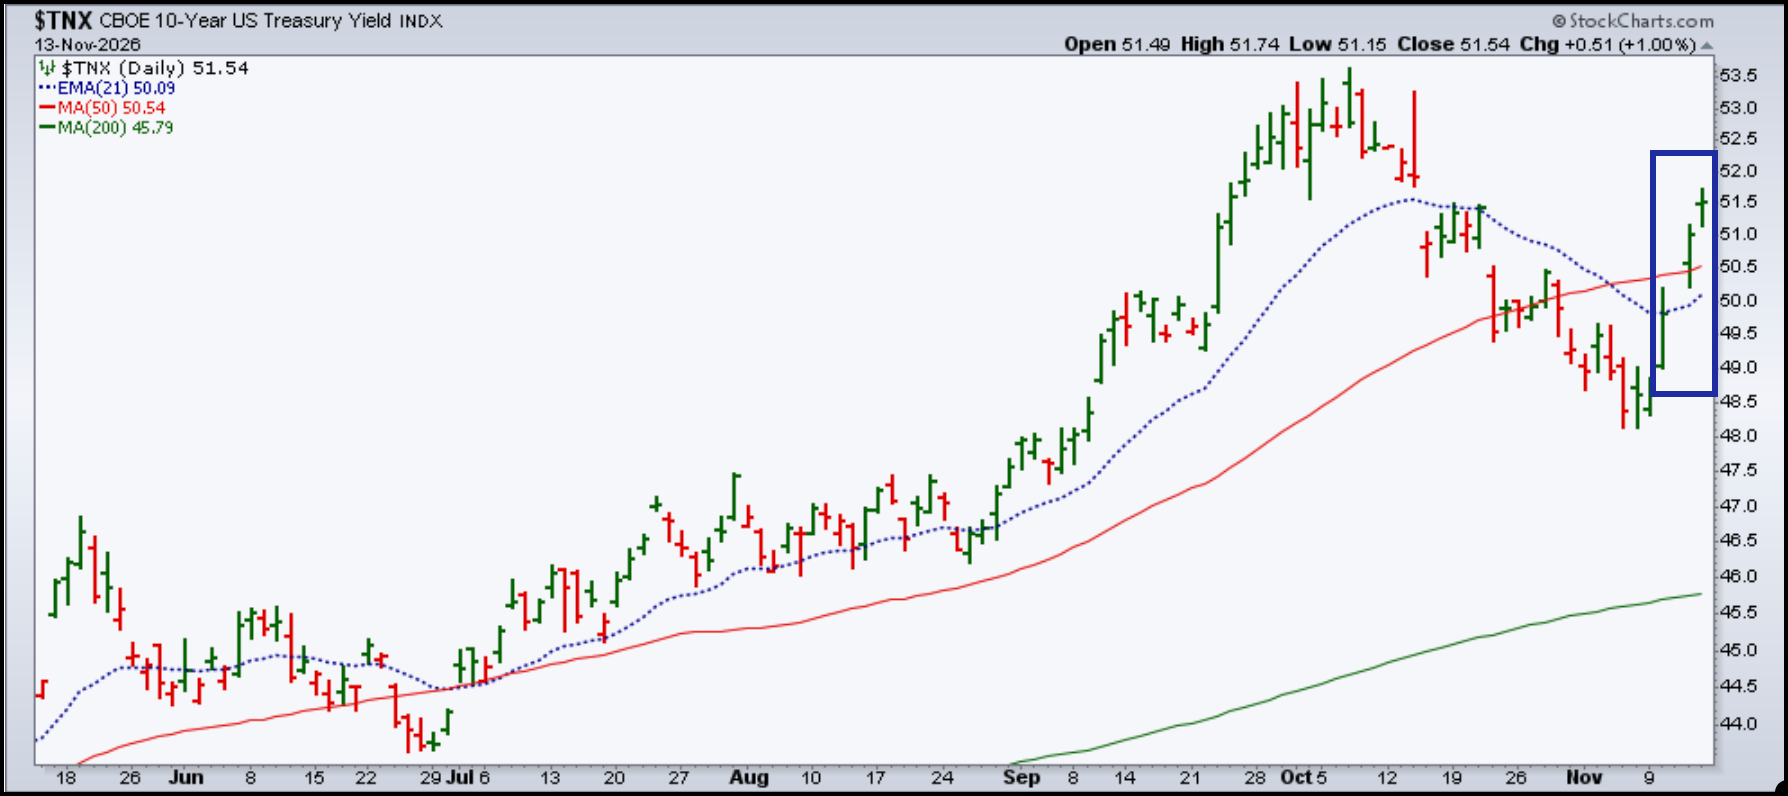
If yields continue to rise, stocks could face a headwind when they’re trying to recover.
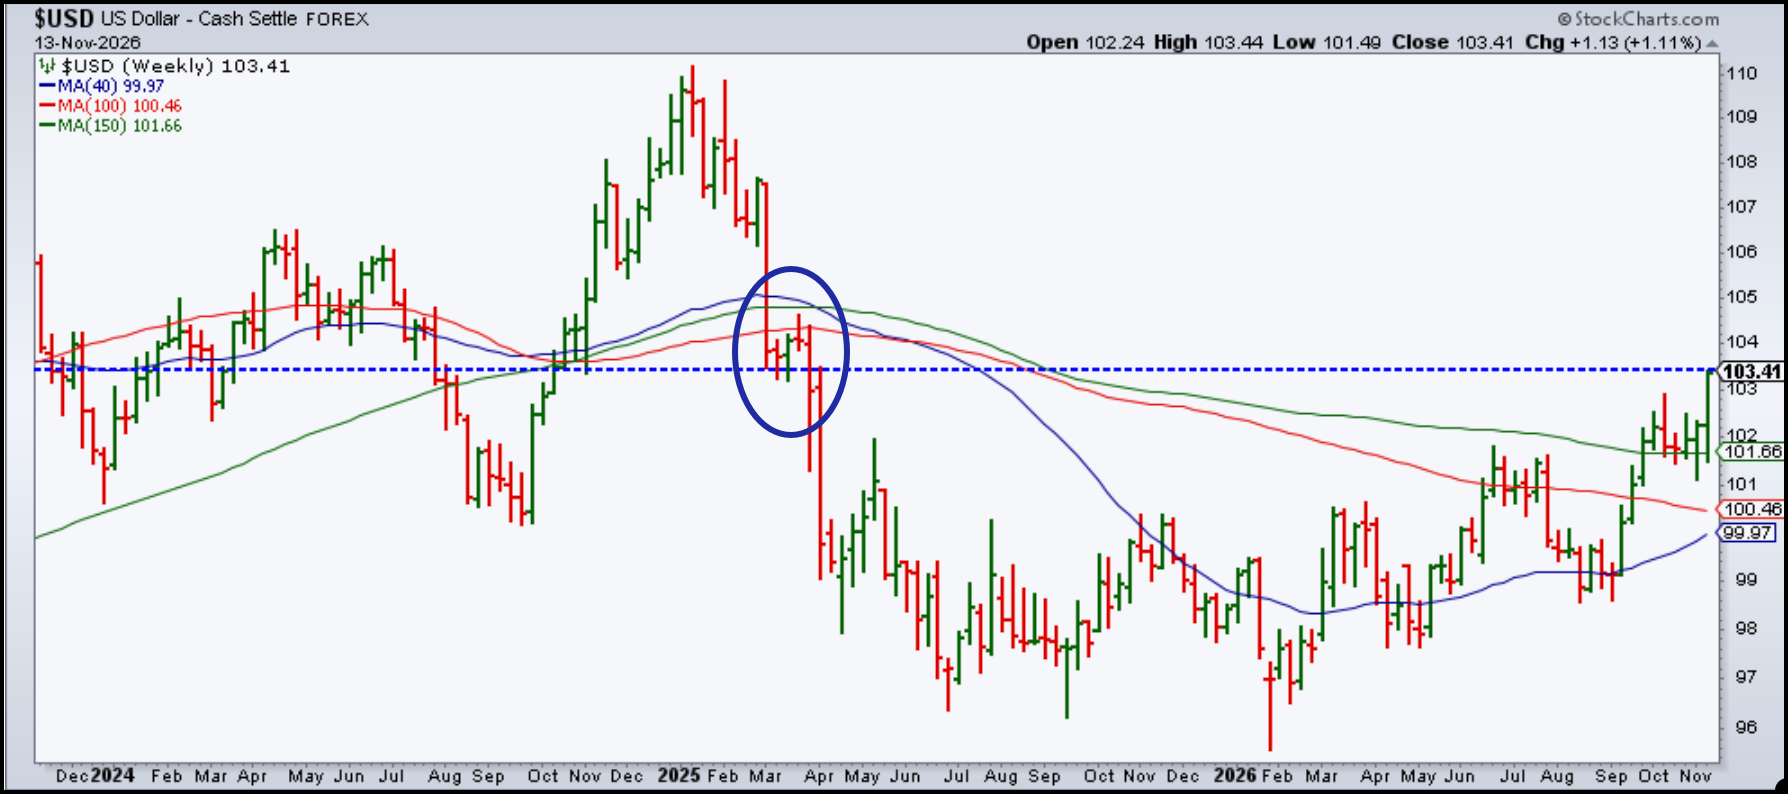
And let’s not forget the U.S. dollar. The U.S. Dollar Index ($USD) reached a 52-week high on Friday, reaching levels last seen in April 2025, which is when the S&P 500 hit a low. At that time, the dollar retreated from a high of around 110. So there’s the possibility that the dollar continues strengthening, which could add further pressure on stocks and precious metals.
The Bottom Line
NVIDIA and technology stocks may be taking up a lot of real estate, but don’t let that district your from the bigger picture. Rising Treasury yields, a strengthening U.S. dollar, and inflation concerns could have a much broader impact on the stock market than one company’s news. Elections, earnings, and breaking headlines can have short-term impacts on the stock market, but inflation, interest rates, and the broader economic environment play an important role in shaping the larger market trends.
The silver lining is that the Cboe Volatility Index ($VIX) is below 20, implying investors aren’t in “fear” mode. Keep an eye on the Nasdaq’s 200-day SMA, Treasury yields, and the U.S. dollar.
Ready to see the market through a wider lens? Head to the Market Summary page and dive into the Intermarket Analysis panel for a real-time read on stocks, bonds, commodities, oil, gold, and the dollar, all in one place.
Disclaimer: This blog is for educational purposes only and should not be construed as financial advice. The ideas and strategies should never be used without first assessing your own personal and financial situation, or without consulting a financial professional.