Is Wall Street Facing a Growth Scare? Copper, Oil, and Stocks Flash Warning Signs.

Key Takeaways
- Copper's 4% plunge, falling crude oil, and a jumpy dollar signal troubling intermarket signals for economic growth and risk assets.
- The S&P 500 tests its 200-DMA, with a potential downside target near 6600 if a bearish pattern triggers.
- A VIX spike into the mid-30s could signal a market washout and set the stage for a year-end recovery.
Prognosis negative? Despite a relief rally in NVIDIA (NVDA) after its double-beat and raise Tuesday night, plus a modest lift in equity futures into the middle of the week, there's no shortage of data points for the bears to embrace. The latest comes not from the stock market, but from commodities.
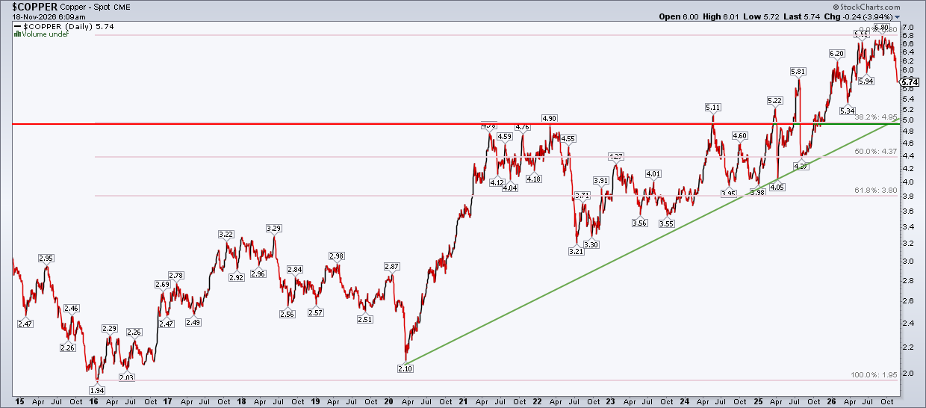
Dr. Copper plunged on Wednesday, shedding 4% and dropping to its weakest level since April; the chart could easily be mistaken for shares of a chip company or data center player. The breakdown is an old-school Wall Street warning that economic growth might not be as sturdy as some forecasters predict. It’s that time of year, after all, when the street is littered with year-ahead outlooks and sleek charts (which often get tossed to the curb as soon as some unforeseen volatility event strikes).
Keeping it simple, spot copper may have its eyes on $5. That's where uptrend support comes into play (using the log-scale chart, which is often preferred to gauge the true rate of a trend), along with perhaps some messy horizontal polarity seen below. The $5 spot level is also close to a 38.2% Fibonacci retracement of the rally from early 2016 to September 2026. That would represent a more-than-25% decline from the record high, perhaps to the delight of Fed Chair Kevin Warsh and the 11 other voting members of the FOMC.
The S&P 500's Major Support Zone Put to the Test
Copper's downturn came after it initially bounced off its now-flattening long-term 200-day moving average. The 200-DMA gets plenty of attention right now, as the S&P 500 ($SPX) also settled on that mark ahead of NVIDIA earnings on Tuesday. Now through Black Friday could be the bulls' moment of truth.
The SPX has reached a critical support zone between 7238 and 7350. What's more, a bearish rounded-top feature has sparked chatter about a possible head-and-shoulders pattern. Should that trigger, a downside measured-move target of 6600 would be in play, based on the height of the consolidation and the breakdown point.
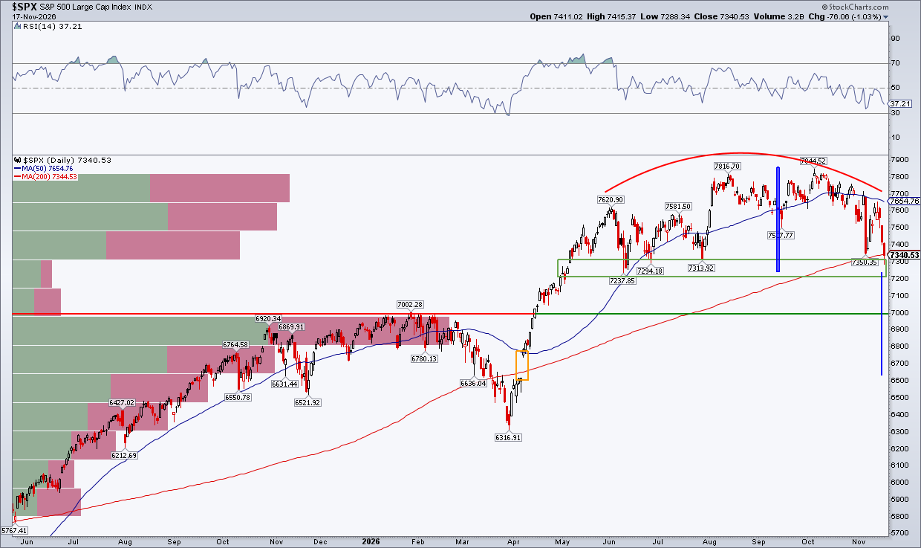
Also look at what's found near 6600 on the SPX. It's the old April 8, 2026, gap, back when risk-on sentiment ignited across asset classes amid optimism that the ongoing conflict in Iran would dissipate. Equities kept going higher in Q2, not thanks to a cooling of Middle East tensions, but because of the AI boom and stratospheric daily gains in semiconductor stocks.
Oil & the Dollar Add to the Pressure
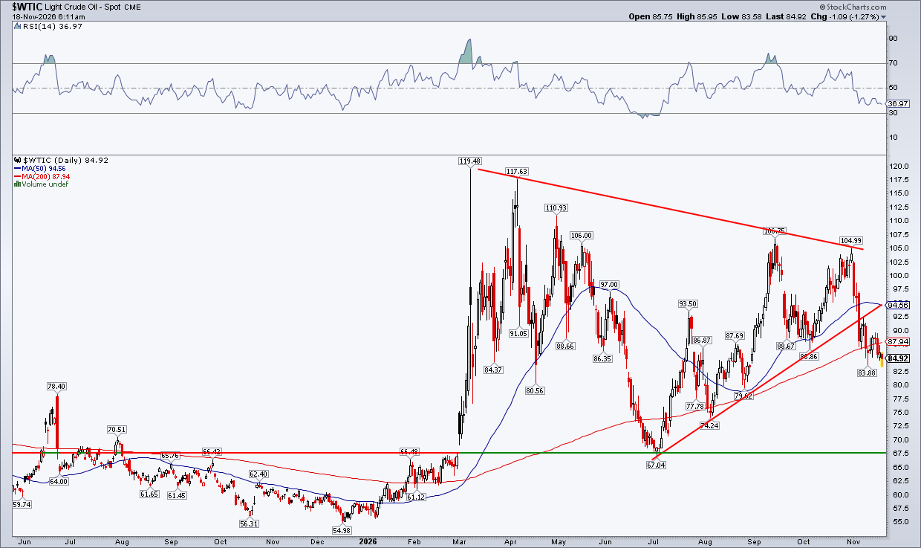
Fast-forwarding to today, the backdrop is quite different. In fact, WTI crude oil ($WTIC) broke to multi-month lows of its own midweek. Now trading below $85 per barrel and featuring nearly its worst RSI momentum since early July, there are clear rhymes with what's happening in copper right now. Long-term support on oil's SharpChart is another $15–$20 lower.
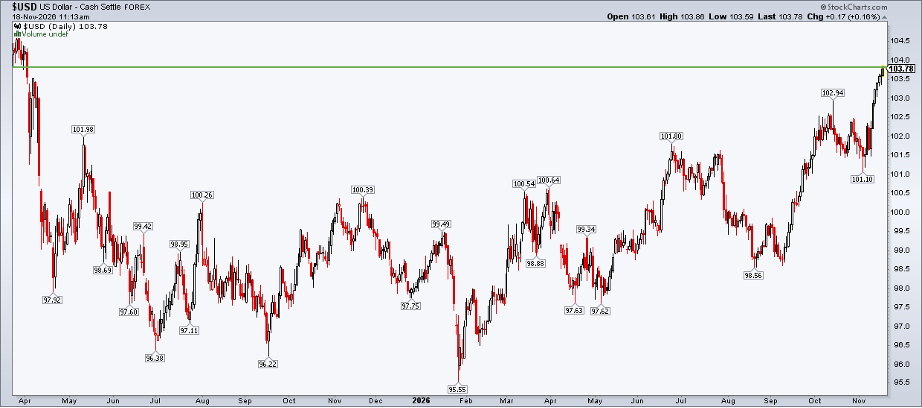
And then there's the dollar. The US Dollar ($USD) is up for a seventh consecutive session ahead of President Trump's trilateral meeting with Chinese President Xi Jinping and Russian President Vladimir Putin.
I recently made the case for a move toward 108 on the $USD. Along with stubborn real yields, financial conditions are turning less friendly for risk assets, with only six weeks remaining in 2026.
All told, the intermarket landscape doesn’t feel all that favorable. Falling stocks, commodities giving way to the bears, and a firm dollar make for more of a deflationary cross-asset setup, just as all eyes are fixated on eye-popping, backward-looking CPI, PPI, and import price data points. The natural buffer in such a backdrop would be to overweight Treasuries.
10-Year Yield: Dead-Cat Bounce, Or New Highs in Sight?
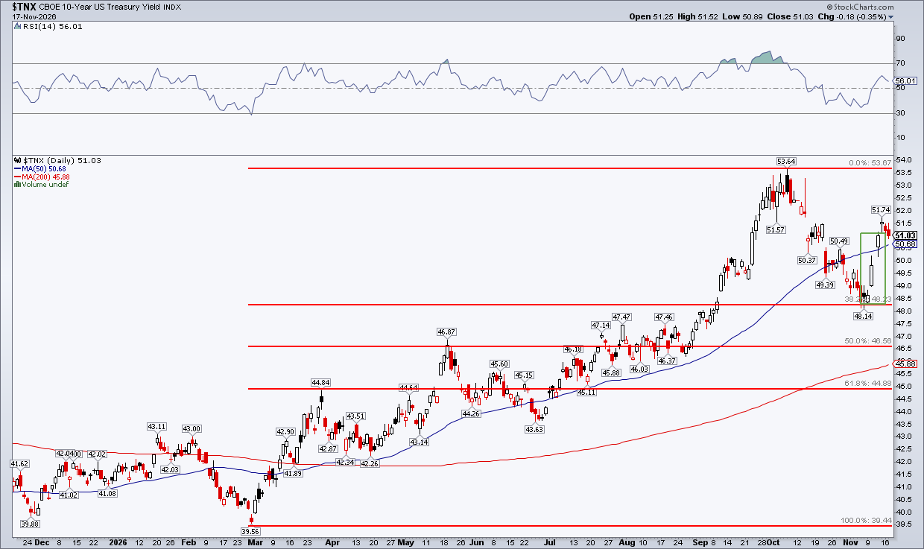
How does the 10-year yield ($TNX) look? It's doing all the right things from the perspective of a trader bearish on bonds. Notice in the chart below that the rate rose from February 27 to October 7, tacking on almost 141 basis points. The correction that completed just after the midterms was a clean 38.2% Fibonacci retracement of the 2026 advance. It also held support from the summertime highs.
The 10-year yield exploded higher in a bullish three white soldiers pattern, but the rate couldn't quite fill the October 15 gap. This might be the real intermarket test. If the 10-year yield fails, it would increase the chances of a longer-lived growth scare.
There's no shortage of indicators to keep on your screen. After the S&P 500's worst three-day rout since the March low in price and its first dip below the 200-DMA since the early-April gap higher that launched the Q2 rally, tensions are high. The Cboe Volatility Index ($VIX) is also in that scary mid-20s zone, a range that tends to favor the bears in terms of forward S&P 500 returns.
Watch for the 'Whoosh'
What might the bulls want to see? A total washout. A day when the newly ranked defensive generals, along with the AI players, get shot down. Such a move, with a VIX spike into the mid-30s, could clear the decks heading into Christmas. The 2018 post-midterms analogue feels as alive as ever.
The Bottom Line
It has not been a November to remember for the bulls. The S&P 500 is now down five of the last six months, having tested its 200-DMA ahead of NVIDIA earnings. The Anthropic (ANT) IPO is another risk-on gut check for the bulls this week; broader intermarket trends and cross-asset relationships may offer the real tell. Copper is the latest breakdown. I'll be on the lookout for a real 'whoosh' in the days and weeks ahead.
Disclaimer: This blog is for educational purposes only and should not be construed as financial advice. The ideas and strategies should never be used without first assessing your own personal and financial situation, or without consulting a financial professional.