Setting Up The Perfect Trade

It's absolutely possible to set up perfect trades. But what we must all understand is that the perfect trade setup doesn't always result in a profit. Nothing is guaranteed, and we have no way of knowing how setups will eventually play out.
So What Is the Perfect Trade Setup?
For me, it's a trade with a high probability of success with minimal risk. The best and most successful traders are those who manage risk well. If you see a stock and jump in without exercising patience or having a plan in place, you're likely to see a myriad of results, ranging from big winners to massive losers. I try to avoid the latter at all costs.
Let's say you have a $100,000 portfolio and you take a 20% hit. You'll be left with $80,000 and, at that point, you'll need a 25% gain to get back to where you started. A trader's cash is his/her product. Once it's gone, it's very difficult to get it back, especially if you're not disciplined.
If you struggle to trade successfully, make a change today. Rule #1 is DO NOT CHASE a rally. In my opinion, this is where most traders fail, always trying to make money after a major rally has already occurred. The other trading killer is holding a losing stock for way too long, allowing a small loss to become a big one. If you eliminate these two major trading mistakes, I promise your results will improve.
We provide our FREE EB Digest newsletter to give back to our community at EarningsBeats.com. While each article could discuss anything important to us, including relative strength, earnings gaps, trend lines, candlesticks, breakouts or breakdowns, chart patterns, etc., many times we simply provide a stock with a risk/reward that's either solid or approaching a price level where it becomes solid. This step is critical to trading success.
Let me give you two recent examples:
Example 1: Acadia Healthcare Company, Inc. (ACHC)
ACHC was featured on our EB Digest on August 24th. Here was an excerpt of what we passed along to our subscribers:
"One of the stocks on our Bullish Trifecta ChartList (BTCL), Acadia Healthcare Company, Inc. (ACHC), just challenged key price support near 27.00 and printed a reversing hammer candlestick, closing near its high for the day.... Just one month ago, ACHC reached a 52-week high vs. its health care provider peers ($DJUSHP), and the DJUSHP reached a 52-week high relative to the benchmark S&P 500. There's never a guarantee in stock market trading, but entering a leading stock in a leading industry group on a reversing candle at key short-term support significantly reduces risk and increases odds for success. Managing risk is probably the most overlooked piece of successful trading."
Here's the ACHC chart and what happened after our article.
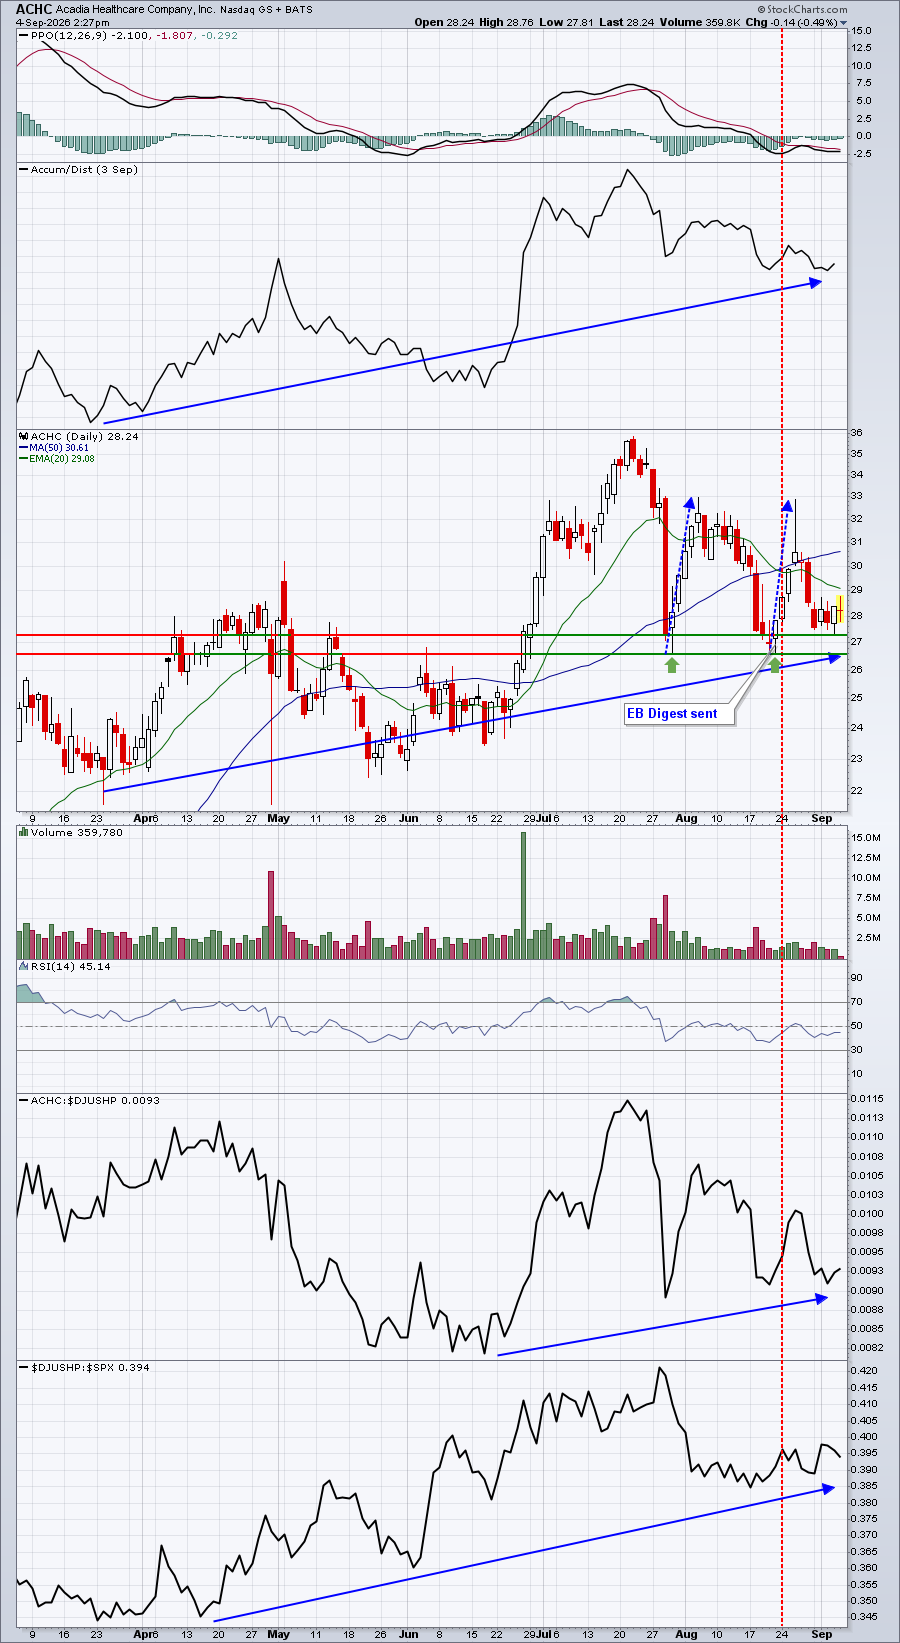
From the close on Friday, August 21st of 27.82, ACHC proceeded to climb more than $5 to 32.87 on Wednesday, August 26th. That's an 18% gain in three trading days to the high. Note that the low on August 21st nearly mirrored the July low, and the high on August 26th nearly mirrored the high from early August. This is what I consider a perfect trade setup.
While this one worked, it certainly wasn't a guarantee. Stocks break below price support all the time. But if you're habitually entering stocks at or near price support, then you're minimizing risk and increasing your potential reward.
Example 2: Prenetics Global Ltd (PRE)
PRE was featured on our EB Digest on August 26th. Here was an excerpt of what we passed along to our subscribers:
"By my count, Prenetics Global Ltd (PRE) hit 22.00 on 13 different occasions during 2026, without once closing over 23.00.....until Tuesday. Money has been rotating to health care stocks (XLV) and PRE finally benefited from it.....Medical supplies ($DJUSMS) have been improving relative to the benchmark S&P 500 since hitting a relative low in early June. Given the improving strength now in the industry and the rising AD line to support PRE's breakout, my expectation is for PRE to trade much higher in the near-term. I see a measurement to the 28.00-30.00 area, based upon the recent depth of PRE's consolidation. The one issue I have is the overall lack of liquidity of PRE throughout the past year. Just during the past month or so, there've been a few days where PRE hasn't traded 100,000 shares, which is quite low. Other than the liquidity issue, though, I see a very bullish chart above."
Here's the PRE chart and what happened subsequent to our article.
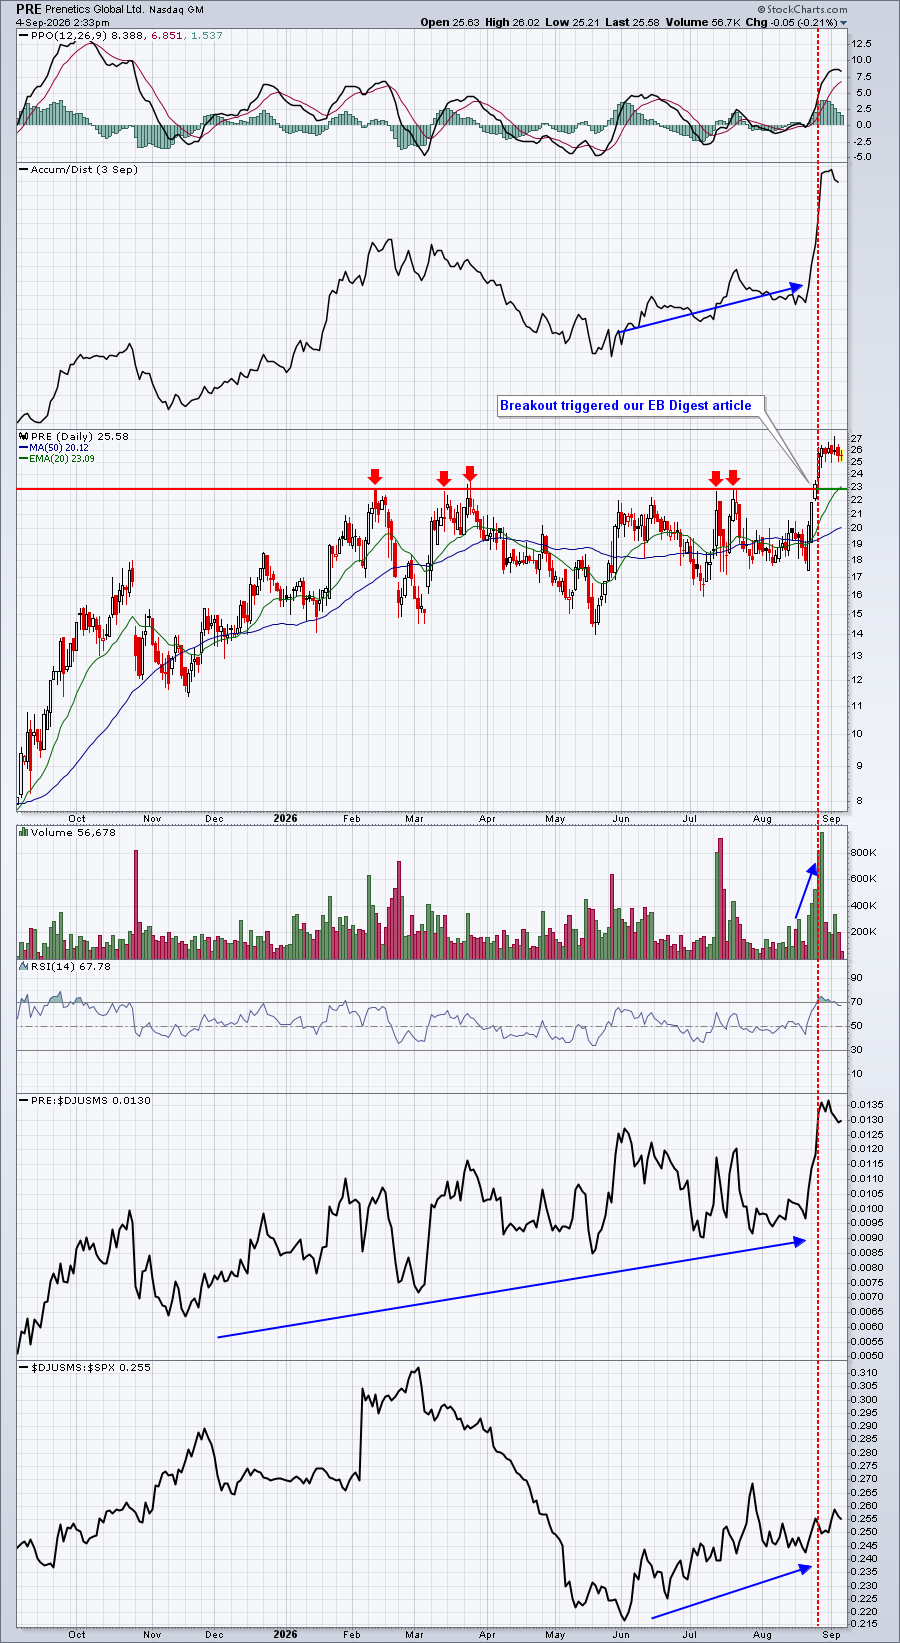
On August 25th, PRE closed at 23.25, finally clearing its overhead price resistance. The very next day, PRE jumped as high as 26.29, a 13% rise in just one trading session. This was not a trade on a pullback to a key support level, however, so the downside risks would typically be much greater. However, given the potential measurement to 30.00, the potential reward from this trade was quite solid to offset the higher risk.
If you want to learn more about risk management strategies, you'll find plenty of that in our twice weekly EB Digest newsletter. As mentioned above, subscription is 100% FREE. To register, simply CLICK HERE with your name and email address. There is no credit card required.
Happy trading!
Tom