S&P 500 Approaches Next Support as Market Jitters Rise: What Comes Next?

Key Takeaways
- The major indexes pulled back and are trading below their 21-day EMAs, but the broader trends remain bullish.
- Crude oil prices are rising but remain within a trading range.
- Semiconductor stocks are losing momentum and could present buy-the-dip opportunities.
Headlines continue to rattle the stock market. Last Friday’s price action had the look of a potential correction taking shape. Will the weakness spill over into this week? Let’s see what the charts are telling us.
A Walk Through the Charts
Last Friday, the S&P 500 ($SPX) slipped below its 21-day exponential moving average (EMA). Since then, the index has failed to close above the EMA, which has now started to trend lower. The S&P 500 is now approaching its 50-day simple moving average (SMA), which would be the next support level.
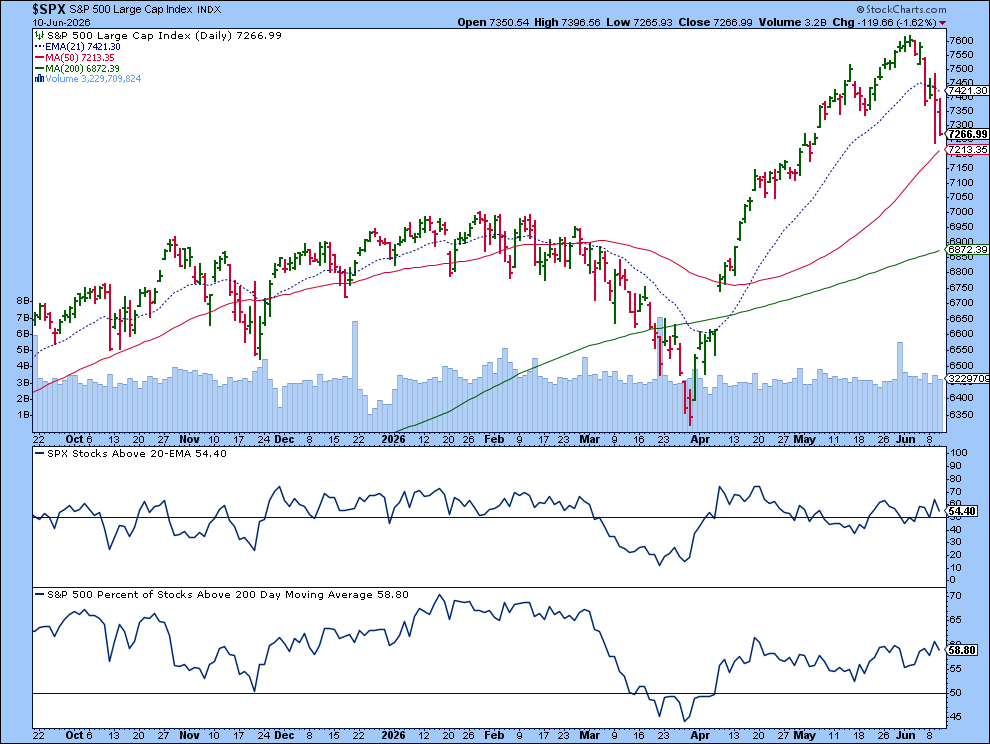
The market breadth indicators in the lower panels, i.e., the percentage of S&P stocks trading above their 20-day EMA and the percentage of stocks trading above their 200-day SMA, are above 50. A fall below that level would be an indication that breadth is narrowing.
The May Consumer Price Index (CPI) was in line with estimates, confirming that consumer prices are rising at a rate of 4.2% year-over-year. But this alone may not have been the reason for Wednesday's selloff, as renewed tensions between the U.S. and Iran may have been the more influential factor.
Tech stocks continue to get hit hard. The Nasdaq Composite ($COMPQ), like the S&P 500, is close to its 50-day SMA. The index bounced off the SMA on Tuesday, but reversed course and headed back down to revisit that level.
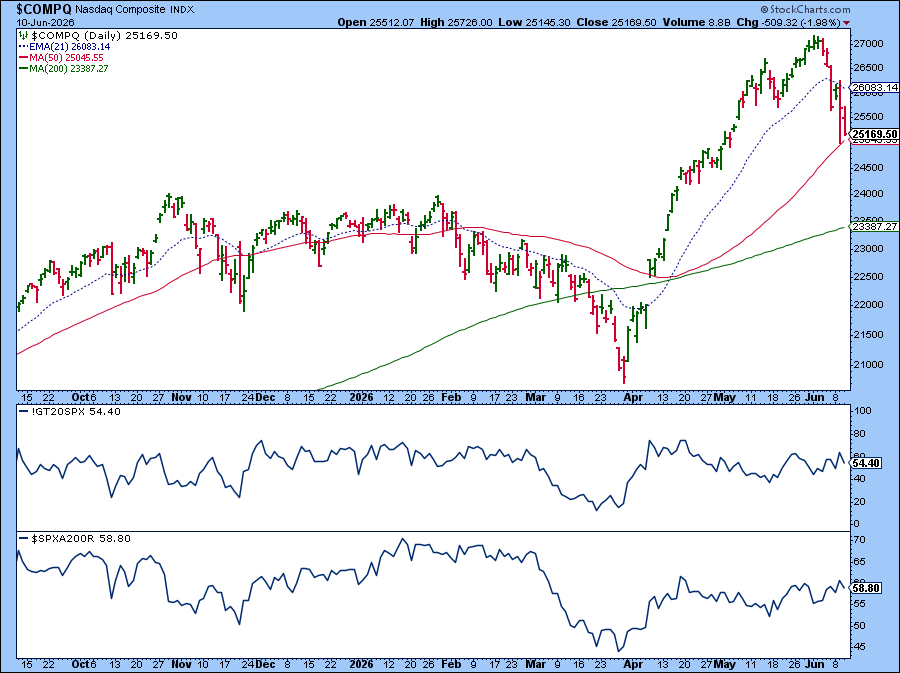
Even in the Nasdaq Composite, the breadth hasn't contracted enough to warrant any panic.
One point to not ignore is that we are seeing declining momentum in semiconductor stocks, the asset group that has led the stock market higher. The VanEck Semiconductor ETF (SMH) broke below its 21-day EMA. In the chart below, notice that while SMH was steadily rising, the Relative Strength Index (RSI) started declining at the end of April. If you had exited your long position when you noticed the divergence between price and RSI, you could have missed out on a sizable move.
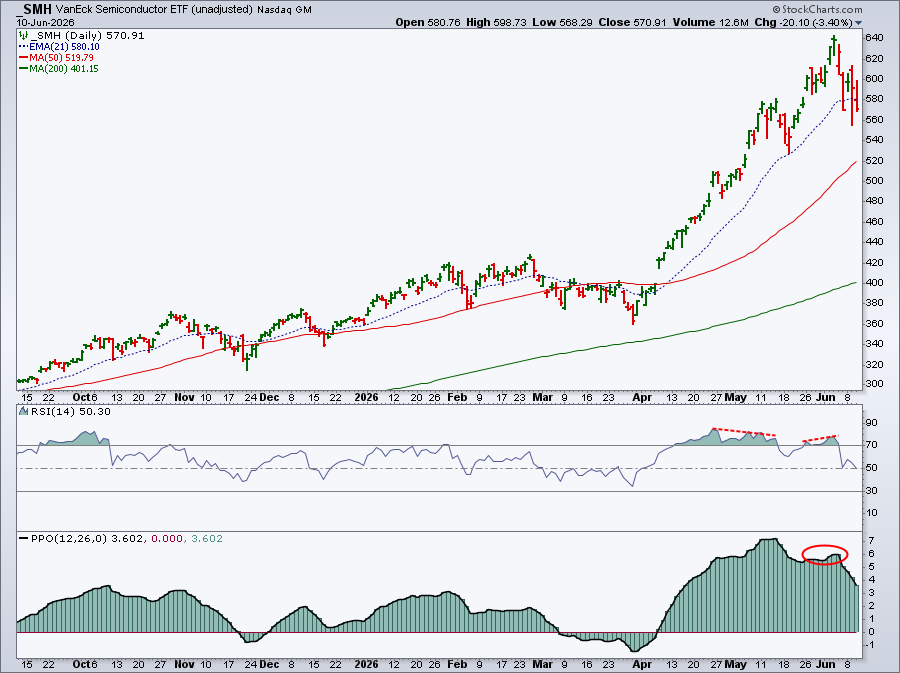
A more confirming signal would have been the lack of upward movement in the Percentage Price Oscillator (PPO). Notice how, after the May pullback, the PPO was pretty stagnant, not reaching the levels it did before the May pullback.
Watch for the next support level at the May low or 50-day SMA. If price bounces off that level with a reversal in momentum and a strong follow-through, it could present a potential entry point in some of the beaten-down chip stocks.
The Dow Jones Industrial Average ($INDU) is faring a little better than its two cousins, managing to hold above its 21-day EMA. However, it also broke below that level on Wednesday.
While market breadth indicators may not be showing signs of extreme panic, investor fear is back. The Cboe Volatility Index ($VIX) closed at 22.21, above the 20 threshold level.
Although price action in the shorter-term charts may look like it is starting to break down, the longer-term charts, such as the 20-year monthly and five-year weekly charts, show that the bullish trend is still intact.
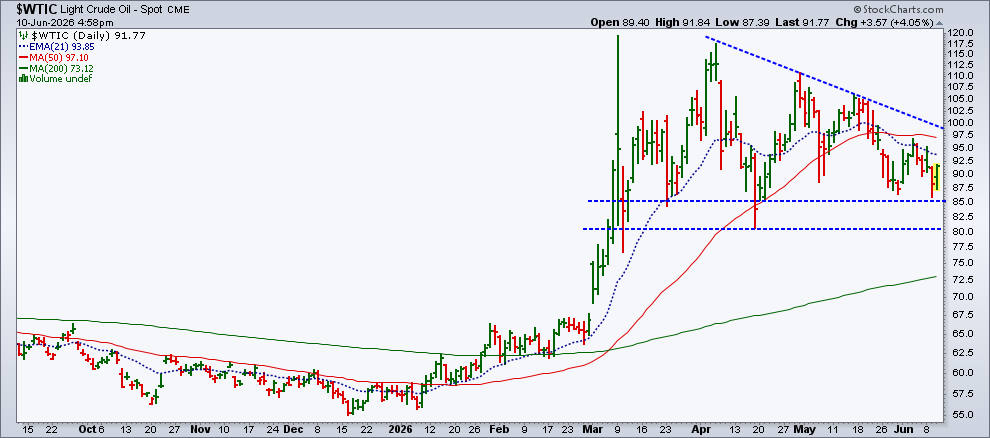
All Eyes On Oil
With tensions between U.S. and Iran back in the forefront, investors should keep a close eye on the price action in crude oil. Prices did rise on Wednesday but are still within a trading range.
Oil prices are well off their early March highs and trending lower. You can see from the chart below that prices are approaching key support levels. However, so far, we haven't seen a decisive move in either direction.
Looking Ahead
There could be several headlines that influence the stock market's price action in the next few weeks. The possibility of higher Fed rate hikes in 2026 may put renewed pressure on stocks. Further tensions in the Middle East may increase investor fear. There's also the SpaceX IPO on Friday, which could go either way depending on investor sentiment.
For now, the daily charts need close monitoring, but don't lose sight of the bigger picture. Check the weekly and monthly charts before making any major exit or entry decisions.
Disclaimer: This blog is for educational purposes only and should not be construed as financial advice. The ideas and strategies should never be used without first assessing your own personal and financial situation, or without consulting a financial professional.