Utes and Energy Show Strongest Breadth; Utilities SPDR Extends on Bullish Signal
Key Takeaways
- Utilities, Energy, and Financials sectors are showing the strongest breadth.
- The Utilities SPDR (XLU) is extending after bullish signals.
Long-term breadth captures the market mood here in July. Technology, Consumer Discretionary, and Communication Services are lagging, while Energy, Utilities, and Financials are leading. Despite relative weakness in three key groups, there is a bull market somewhere because some 65% of S&P 500 ($SPX) stocks are above their 200-day EMAs. Today's report will rank sector breadth and show bullish signals for the Utilities SPDR.
Utilities, Energy, Financials Show Strongest Breadth
The table below shows the percentage of stocks above their 200-day EMAs for the S&P 500 and the 11 sectors. SPX %Above 200-day EMA (!GT200SPX) is in the middle at 65.2%, which means 65% of S&P 500 stocks are in long-term uptrends. This also means that that there's a bull market somewhere. Sectors with more stocks above their 200-day EMAs are part of this bull market and show relative strength, while sectors with fewer stocks in long-term uptrends show relative weakness.
One sector stands head and shoulders above the rest: Utilities. XLU %Above 200-day EMA (!GT200XLU) is at 90%, which is by far the highest of the 11 sectors. XLE %Above 200-day EMA (!GT200XLE) is in second place at 81%. We are also seeing strength within Financials, Real Estate, and Industrials. All show more stocks above their 200-day EMAs than the S&P 500.
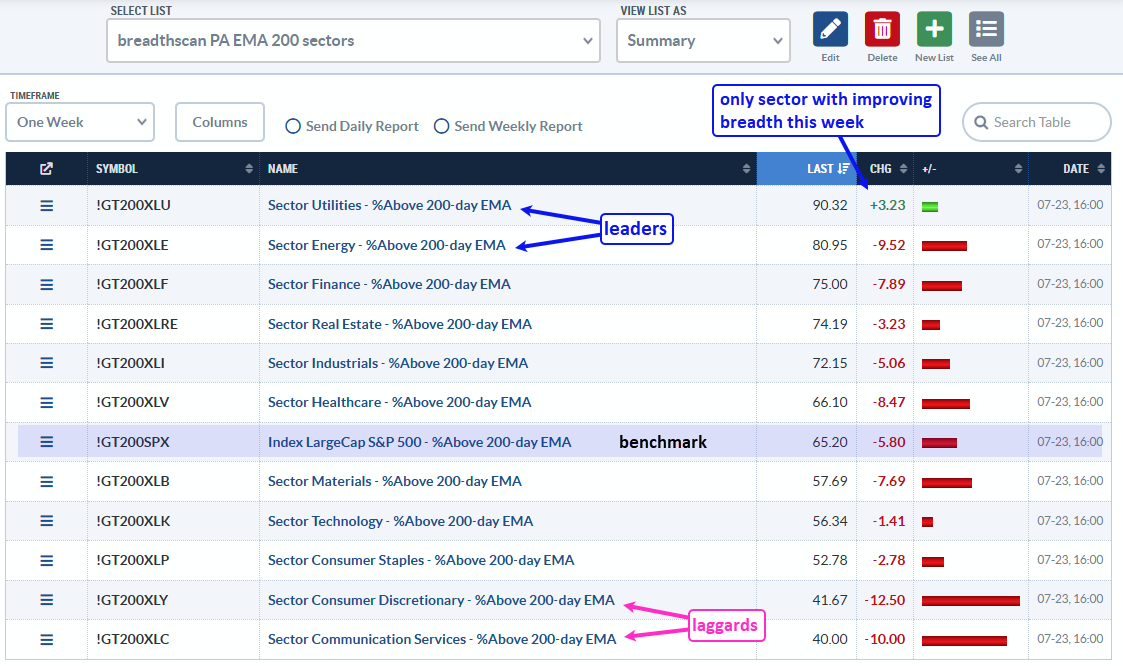
The bottom half of the chart shows the laggards (Materials, Technology, Consumer Staples). Even though more than 50% of their stocks are above their 200-day EMAs, they show relative weakness (internally). Consumer Discretionary (!GT200XLY) and Communication Services (!GT200XLC) are the weakest with fewer than 42% of stocks above their 200-day EMAs. This means more than 58% of component stocks are in long-term downtrends.
In short, Utilities and Energy are the leaders with the most uptrends. Technology is lagging the broader market. Most of the stocks in the Consumer Discretionary and Communication Services sectors are in downtrends.
TrendInvestorPro featured four energy ETFs on July 7th and four energy-related stocks on July 8th. These energy ETFs were correcting within long-term uptrends and hitting Bullish Setup Zones (setting up bullish). TrendInvestorPro specializes in finding tradable pullbacks within long-term uptrends. Click here to learn more and take a trial.
Utilities SPDR Extends After Bullish Signals
The next chart shows XLU with the 5/200 day EMAs in the top window. XLU is in a long-term uptrend because the 5-day EMA (blue line) recently crossed above the 200-day EMA (June 15, 2026). As with all moving average crossover signals, there will be whipsaws and bad signals, such as the tariff-induced whipsaw in April 2025 and the negative cross in early June 2026. Trend-following signals work in the long-term because the winning signals more than make up for the losing signals. The active signal is the most important and it remains bullish as long as the 5-day EMA holds above the 200-day EMA.
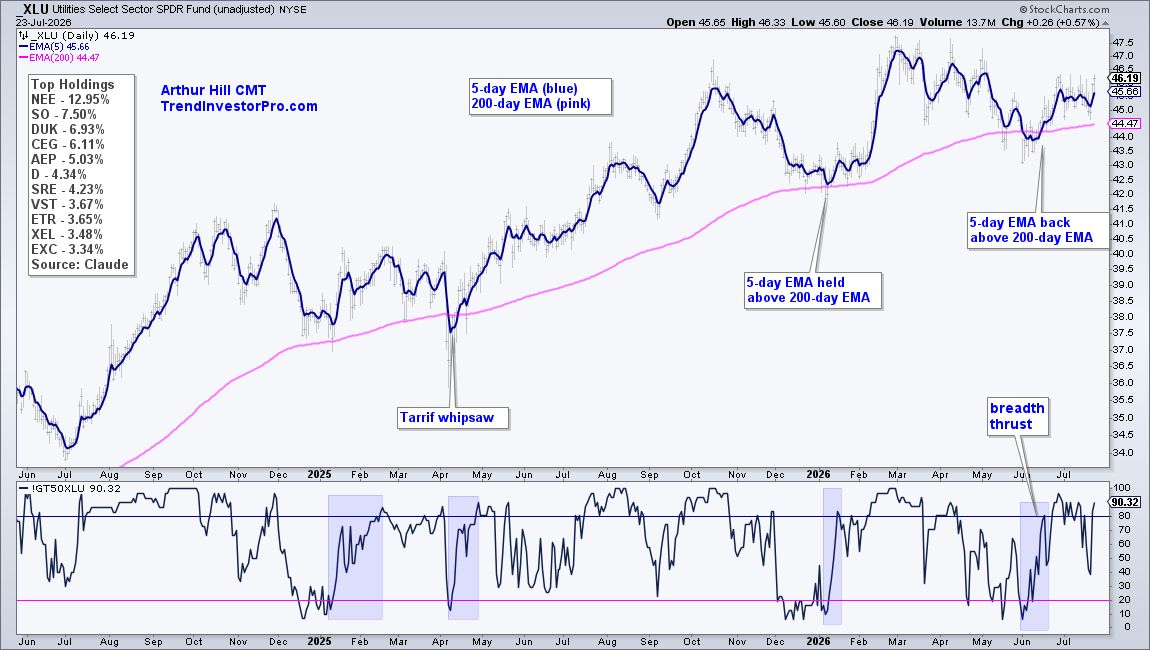
The bottom window shows XLU %Above 50-day EMA (!GT50XLU). This indicator is used to identify bullish breadth thrusts, which trigger when the indicator is below 20% and surges above 80%; the quicker, the better. The blue shadings show prior thrusts in February/April 2025, and January/June 2026. The thrust on June 16th confirmed the bullish EMA cross, which triggered on June 15th.
Once a sector shows strength, attention turns to stocks within the sector. The strategy is to look for tradable pullbacks/corrections within long-term uptrends. TrendInvestorPro featured two utility stocks with bullish setups on July 23rd. Click here to take a trial and gain full access.