The S&P 500's Summer Roadmap: Four Possible Outcomes

We’re labeling the S&P 500 ($SPX) chart as a basing pattern, with the recent highs and lows basically representing a sideways trend in price action. Until and unless the price breaks out of this basing pattern, the trend will remain in a consolidation phase.
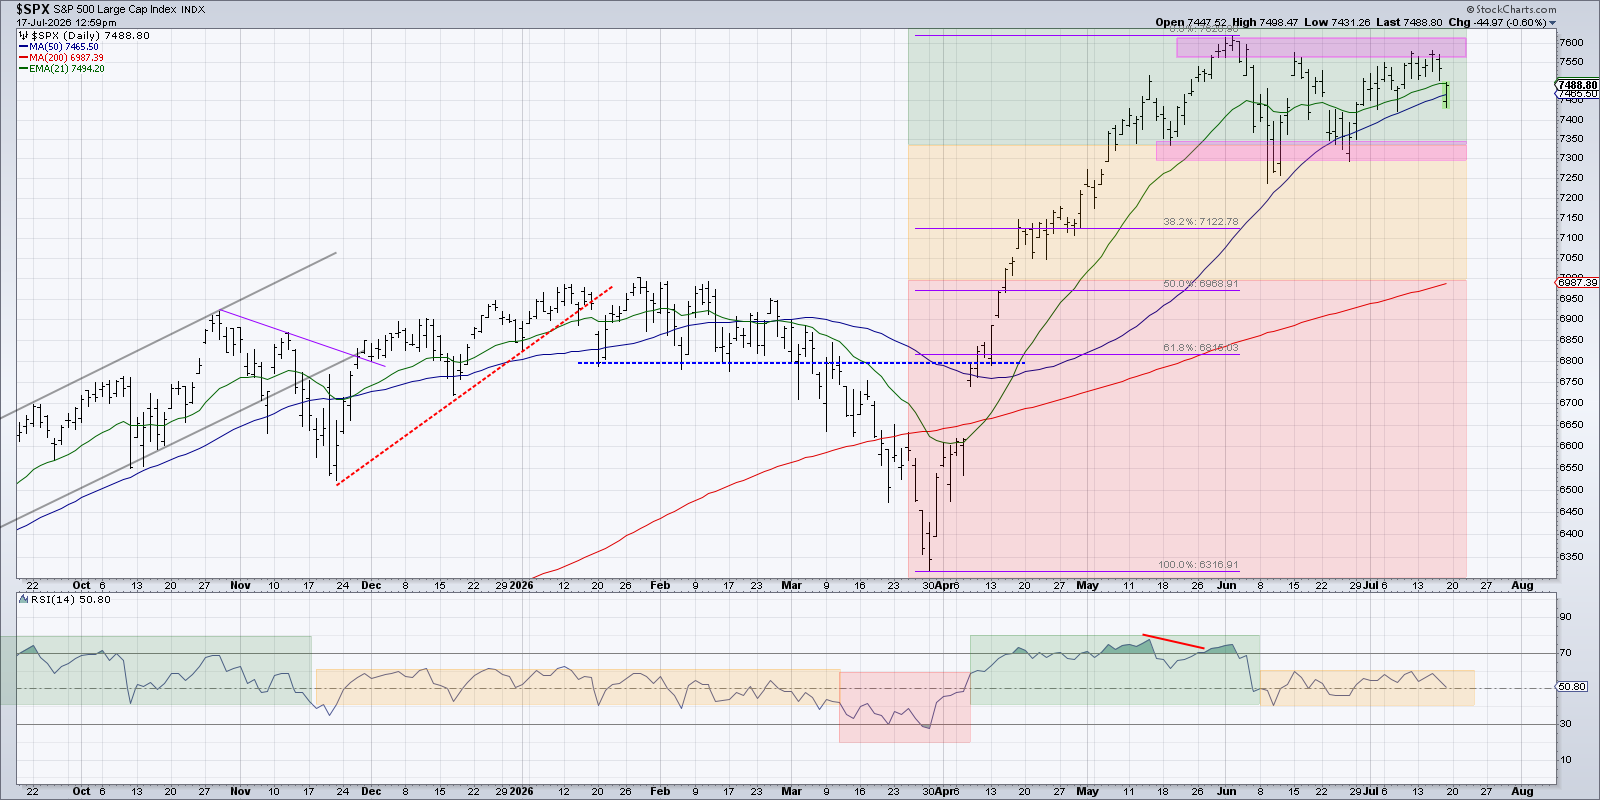
But whether you label the current S&P 500 chart as a coil pattern, an ascending triangle pattern, or something completely different, it’s worth considering some alternative paths for the major equity averages.
Yes, it’s time again for an exercise in “probabilistic analysis” where we consider four different future scenarios in a “choose your own adventure” style exercise about the S&P 500. I’ve long found that, by actively considering different future paths today, we’ll be much better prepared for whatever happens tomorrow.
Before we get to the current chart and four outcomes for the S&P 500, let’s revisit our most recent exercise back in June. We laid out four scenarios for the Nasdaq 100 ETF, and it turns out that the actual path sat right between two of our scenarios!
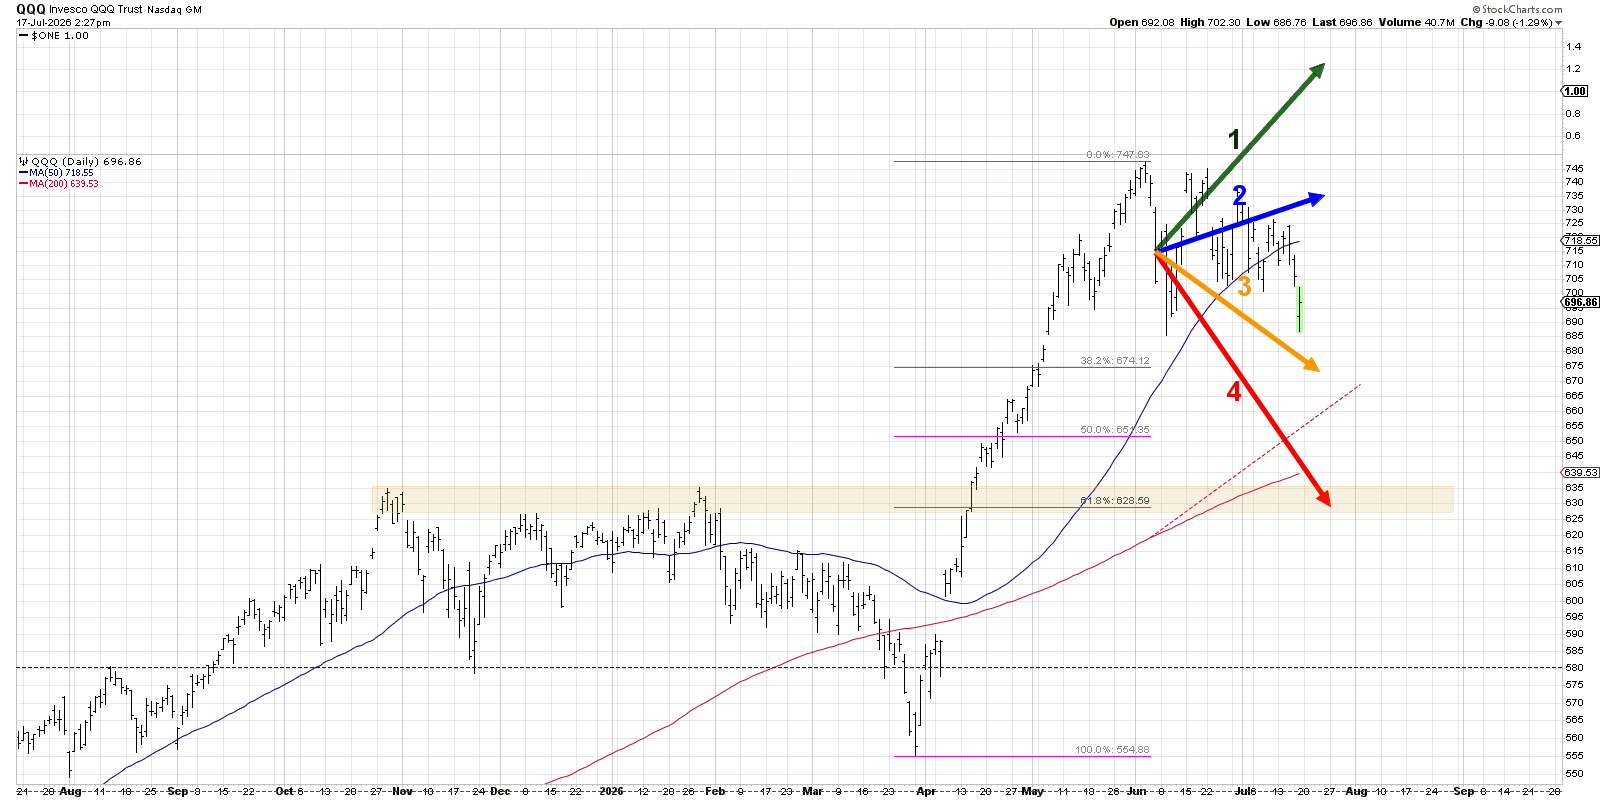
The QQQ was tracking the Mildly Bullish Scenario going into this week, but the weakness in semiconductors has placed the price almost exactly in the middle between scenarios 2 and 3. There’s still time to recover to that Mildly Bullish Scenariobut, overall, it seems like a “seriously sideways” vote would have been the most correct one for that video.
Back to the current markets, let’s review the four scenarios for the Nasdaq 100 ETF between now and the end of August 2026. As a friendly remember, the point of this exercise is threefold:
- Consider all four potential future paths for the ETF, think about what would cause each scenario to unfold in terms of the macro drivers, and reflect on what signals/patterns/indicators would confirm the scenario.
- Decide which scenario you feel is most likely, and why you think that's the case. Don't forget to drop me a comment and let me know your vote!
- Think about how each of the four scenarios would impact your current portfolio. How would you manage risk in each case? How and when would you take action to adapt to this new reality?
Here’s the chart we’ve created to illustrate the four scenarios. You’ll find a breakdown of each scenario below, along with the probability I’ve assigned for each scenario. Disagree with me? Jump over to my YouTube channel and drop a comment- tell me why I’m wrong!
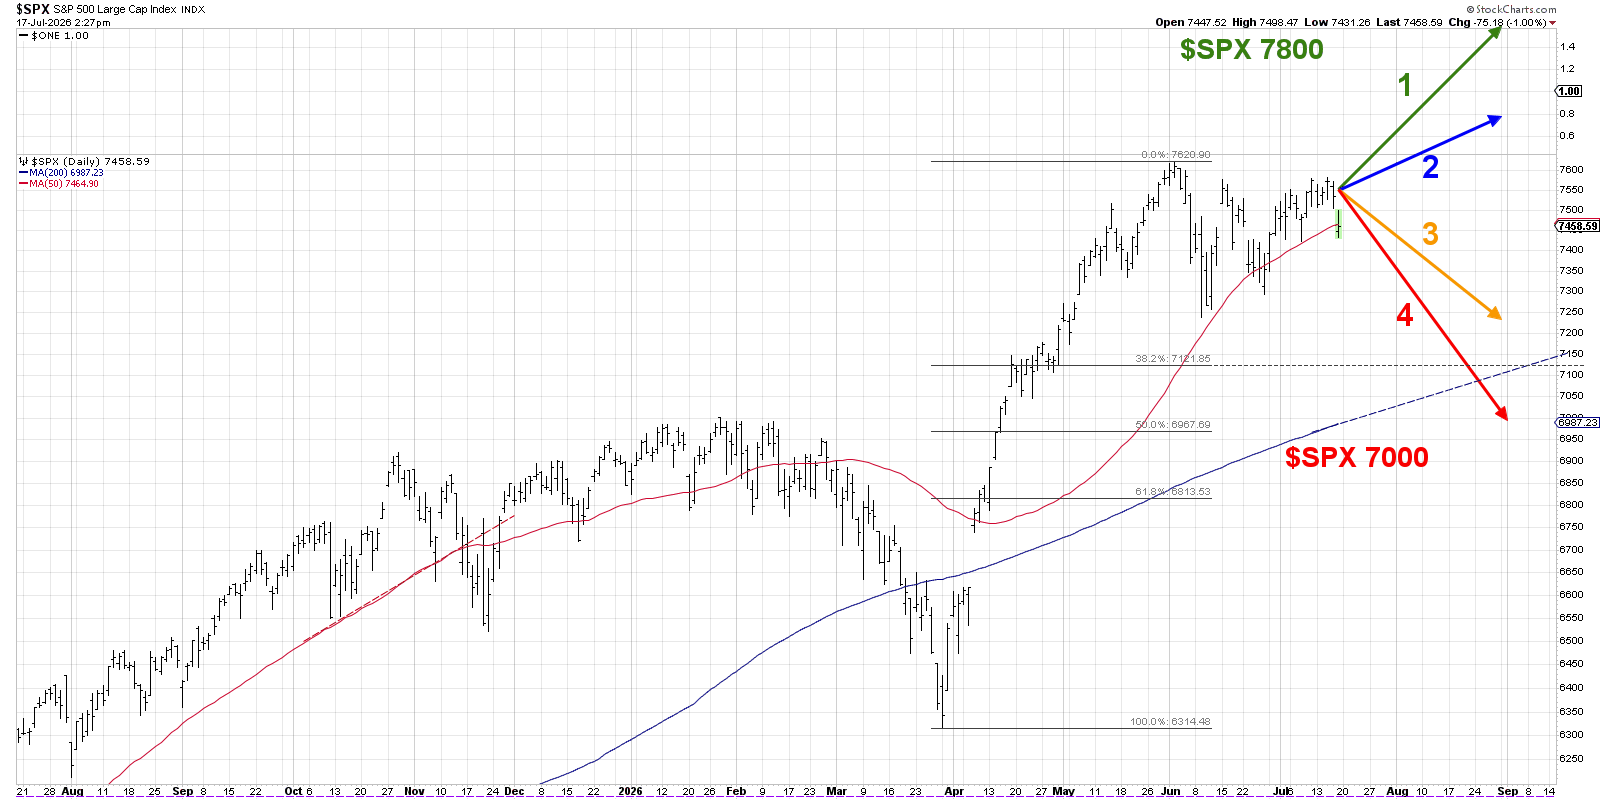
Let’s start with a super bullish outcome, where the S&P 500 bounces higher in the coming weeks and just keeps improving from there.
Scenario 1: The Super Bullish Scenario
What if the recent pullback in semiconductors is shortlived, and a quick recovery in growth stocks ignites a new influx of buying power? There has been so much optimism over the AI trade in 2026 that it’s not unreasonable to imagine a return to that mentality. Also, with the latest inflation readings coming in lower than expected, the pressure appears to be off for the Fed to need to raise rates anytime soon.
If Technology returns to an uptrend phase, and other sectors move higher in tandem, the S&P 500 could be approaching 8000 going into September.
Dave’s Vote: 5%
Scenario 2: The Mildly Bullish Scenario
What if semiconductors continue to struggle, and earnings in the coming weeks don’t seem to help that particular group, but the strength is still there for other sectors like Financials and Industrials? I could see the S&P 500 drifting higher in a low volatility condition, with the S&P 500 resuming a slow uptrend while the VIX remains below 20.
In this case, it would mean further leadership rotation, as value sectors continue to outperform and Technology more and more becomes “that sector that used to look really strong but now is struggling.”
Dave’s vote: 25%
Scenario 3: The Mildly Bearish Scenario
If we remain in a consolidation phase over the next six weeks, then it’s reasonable to expect the S&P 500 to revert lower to test the 7300 level once again. Perhaps Q2 earnings don't go as well as expected, and the recent drop in AI stocks turns into a larger decline.
With investors losing confidence in the tech sector, instead of just rotating into other sectors, they start to get really defensive in their positioning. Perhaps the situation in the Middle East continues to escalate, and higher crude oil prices have investors concerned about the ripple effects of higher inflationary pressures.
Dave’s vote: 60%
Scenario 4: The Super Bearish Scenario
We always need a doomsday scenario, and in this case the S&P 500 deteriorates to the point where the 200-day moving average doesn't hold as support. Investors go full risk-off, the VIX spikes back above 20, credit spreads widen, and it becomes clear that we are in a full distribution phase.
Defensive sectors most likely outperform in this scenario, but probably go down in absolute terms. By the end of August, we’re debating a possible retest of the March market low around S&P 6300.
Dave’s vote: 10%
Which Scenario Gets Your Vote?
If I had to summarize the four paths:
- Scenario 1 assumes a return to the Great Bull Market off the March lows.
- Scenario 2 envisions a gentle uptrend as growth leadership struggles.
- Scenario 3 suggests a more meaningful pullback and rotation to defensive stocks.
- Scenario 4 assumes the recent weakness is just the beginning of a broader distribution phase through the summer months.
The purpose of this exercise isn't to be right. The purpose is to prepare. By considering multiple outcomes before they occur, we're far less likely to be surprised by market behavior. More importantly, we can identify the signals that would increase or decrease the probability of each scenario and adjust our positioning accordingly.
So, which scenario do you find most compelling?
RR#6,
Dave
P.S. Ready to upgrade your investment process? Check out my free behavioral investing course!
David Keller, CMT
President and Chief Strategist
Sierra Alpha Research LLC
marketmisbehavior.com
https://www.youtube.com/c/MarketMisbehavior
Disclaimer: This blog is for educational purposes only and should not be construed as financial advice. The ideas and strategies should never be used without first assessing your own personal and financial situation, or without consulting a financial professional.
The author does not have a position in mentioned securities at the time of publication. Any opinions expressed herein are solely those of the author and do not in any way represent the views or opinions of any other person or entity.