The Best Five Sectors This Week #74
Key Takeaways
- The sector portfolio underperformed the S&P 500, widening the gap to -8%, driven by negative contributions from the industrials sector.
- Health Care surged in sector rankings, moving from sixth to third, impacting portfolio weight distribution.
- Technology remains the top sector but shows short-term weakness, while financials exhibit strong upward momentum.
- Real Estate dropped in rankings, struggling with a narrow price range and weakening relative strength.
Industrials Put a Drag on Performance
This past week, the market (SPY) gained just under 1%. However, the portfolio’s positions contributed negatively, widening the performance gap with the S&P 500 to about 8% by week’s end. The primary drag came from Industrials, which had a notably negative impact.
The sector rankings saw significant movement:
- Technology remains in the top spot.
- Industrials hold second place.
- Health Care made a substantial leap from sixth to third.
- Financials moved up from fifth to fourth.
- Real Estate dropped from third to fifth.
In the lower half:
- Utilities gained a spot to reach sixth.
- Materials fell sharply from fourth to seventh.
- Consumer Staples stayed at eighth.
- Consumer Discretionary moved up to ninth, pushing energy down to tenth.
- Communication Services remains at the bottom.
Impact on Portfolio Weighting
Health Care’s rise is particularly impactful, as it’s a large sector with a 13% market capitalization. This shift reduced Technology’s weight in the portfolio from 59% to 53%. Industrials decreased to 12%, Financials to 19%, and Energy remains at 3%. The combined market cap of the top five sectors now stands at 68%, returning to levels seen from July 2025 to January 2026. This means the portfolio is now less concentrated in Technology and more evenly spread across the top four sectors: Technology, Industrials, Health Care, and Financials.
- (1) Technology - XLK [53%]
- (2) Industrials - XLI [12%]
- (6) Health Care - XLV [13%]*
- (5) Financials - XLF [19%]*
- (3) Real Estate - XLRE [3%]*
- (7) Utilities - XLU*
- (4) Materials - XLB*
- (8) Consumer Staples - XLP
- (10) Consumer Discretionary - XLY*
- (9) Energy - XLE*
- (11) Communication Services - XLC
Weekly RRG
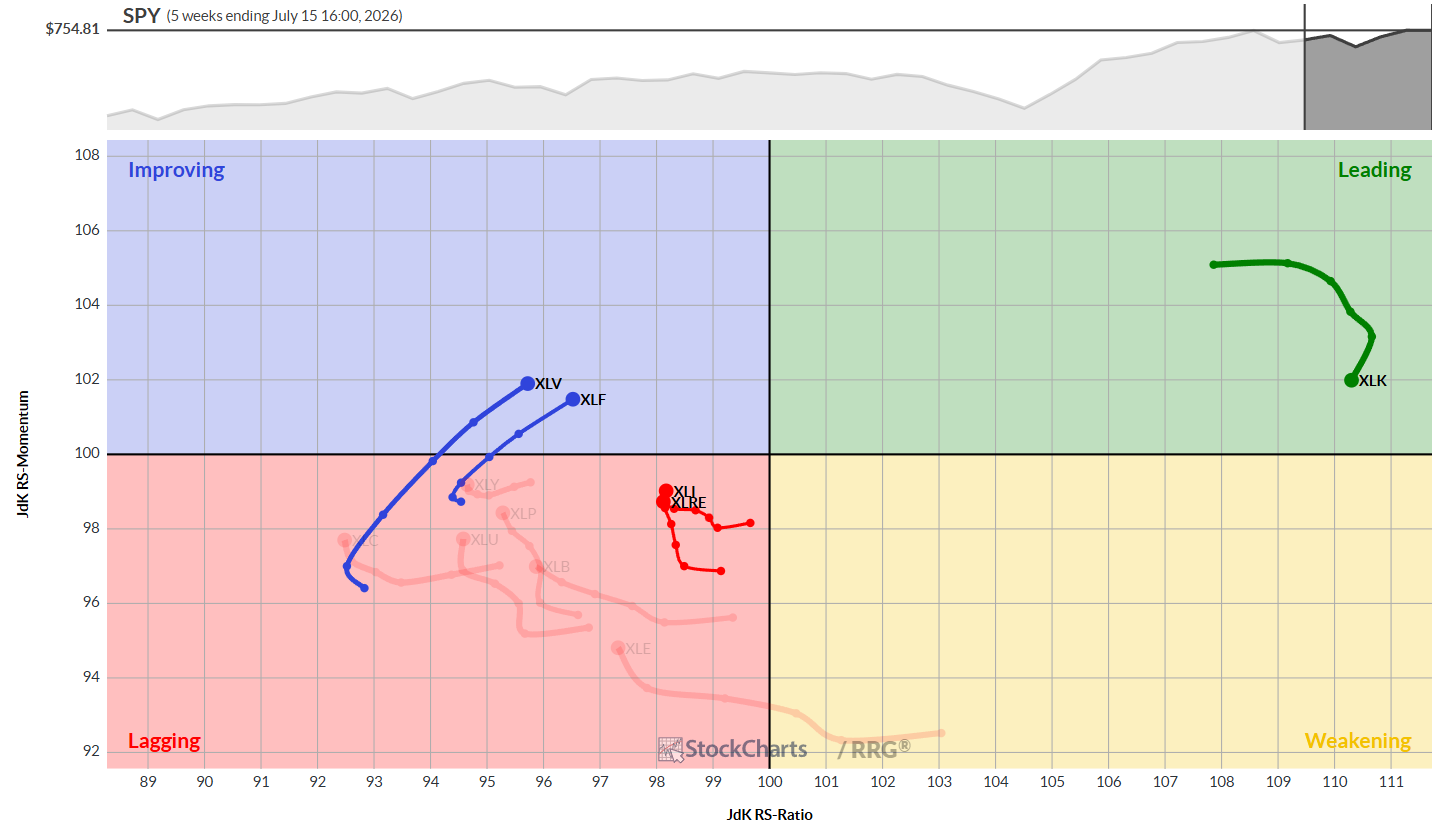
On the weekly Relative Rotation Graph (RRG):
- Technology remains deep in the leading quadrant but is losing relative momentum and strength, indicating a negative short-term trend. However, its high RS-ratio still offsets these negatives.
- Health Care and Financials are moving strongly into the improving quadrant, heading back toward leadership.
- Industrials and Real Estate are still lagging but are picking up relative momentum.
Daily RRG
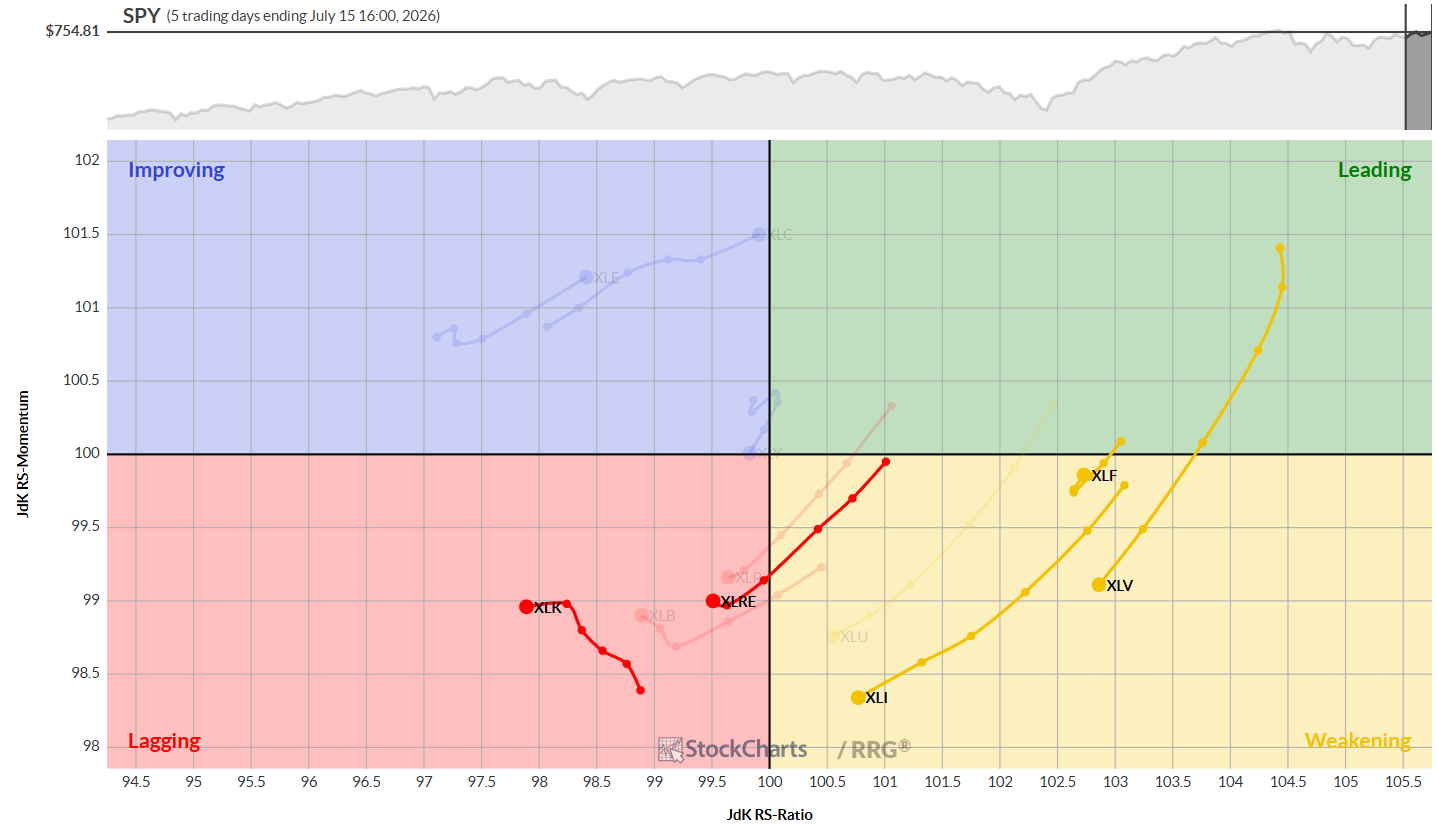
The daily RRG shows a more negative rotation for the top five holdings:
- Technology is moving further into the lagging quadrant, but its strong weekly position keeps it as the top sector.
- Real Estate is also in the lagging quadrant on both daily and weekly RRGs, dropping in the rankings and warranting close monitoring.
- Industrials and Health Care are in the weakening quadrant, moving lower. Health Care’s strong weekly performance suggests this is a temporary setback.
- Financials show a sharp upward move within the weakening quadrant on the daily RRG, which is typically a strong sign. The sector is holding up well on both timeframes.
Sector Highlights
Technology
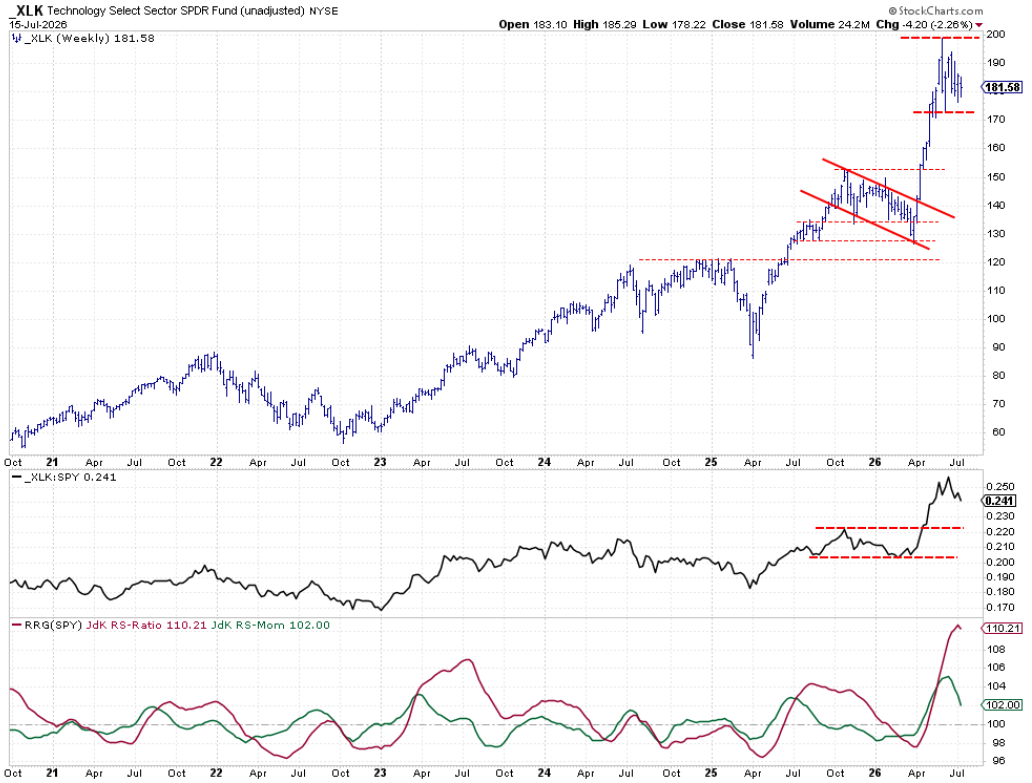
The Technology sector is moving sideways on the price chart. The raw RS line is rolling over, causing the RRG lines to ease. The RS-ratio remains at a five-year high and RS-momentum is still above 100. The sector is consolidating; a new upward move could begin once the RS line finds a low and starts rising.
Industrials
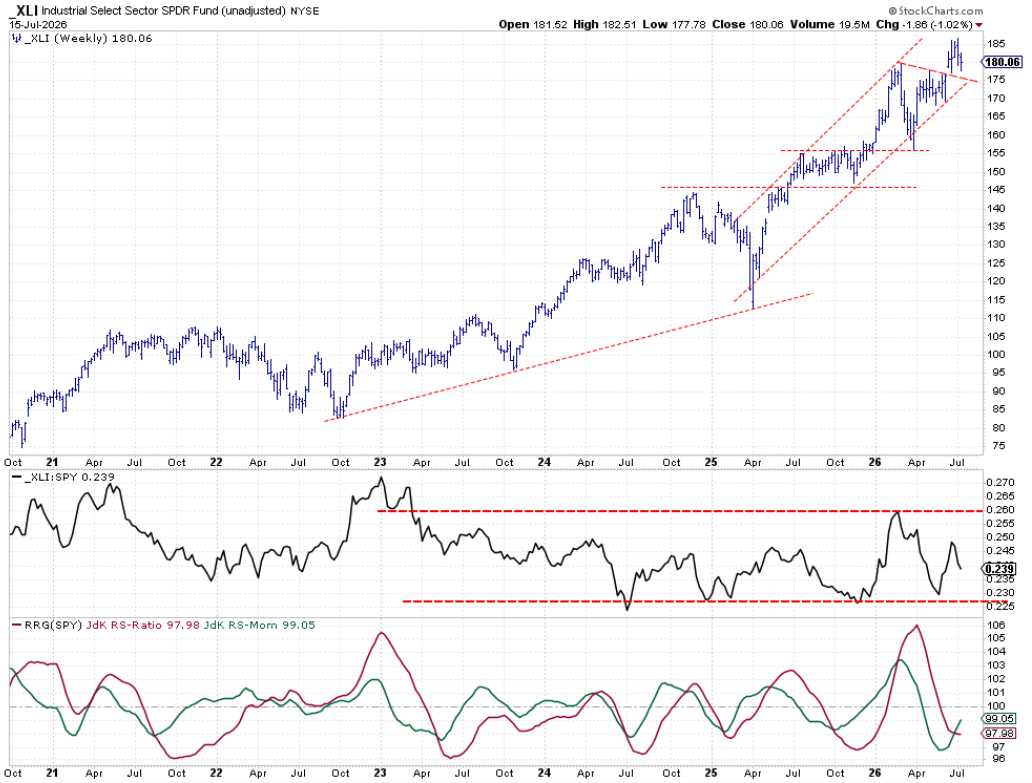
Industrials are holding up after breaking out of a consolidation pattern and remain in an uptrend. The raw RS is in a broad trading range, but RRG lines have bottomed out, and RS-momentum is climbing toward 100, pulling the RS-ratio higher.
Health Care
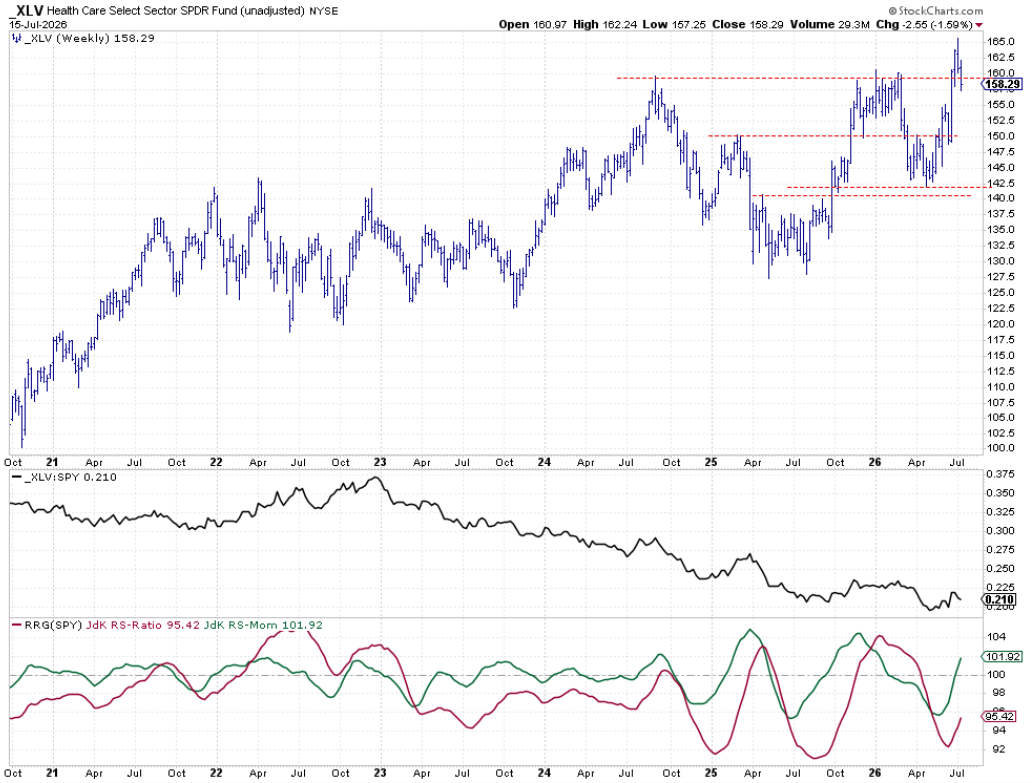
Healthcare broke out last week but is now testing old resistance as support. The sector made the biggest jump in the rankings, but the raw RS line is still below its previous peak. Both RRG lines are moving higher, indicating a positive outlook for the coming weeks, though confirmation of a new uptrend is still pending.
Financials
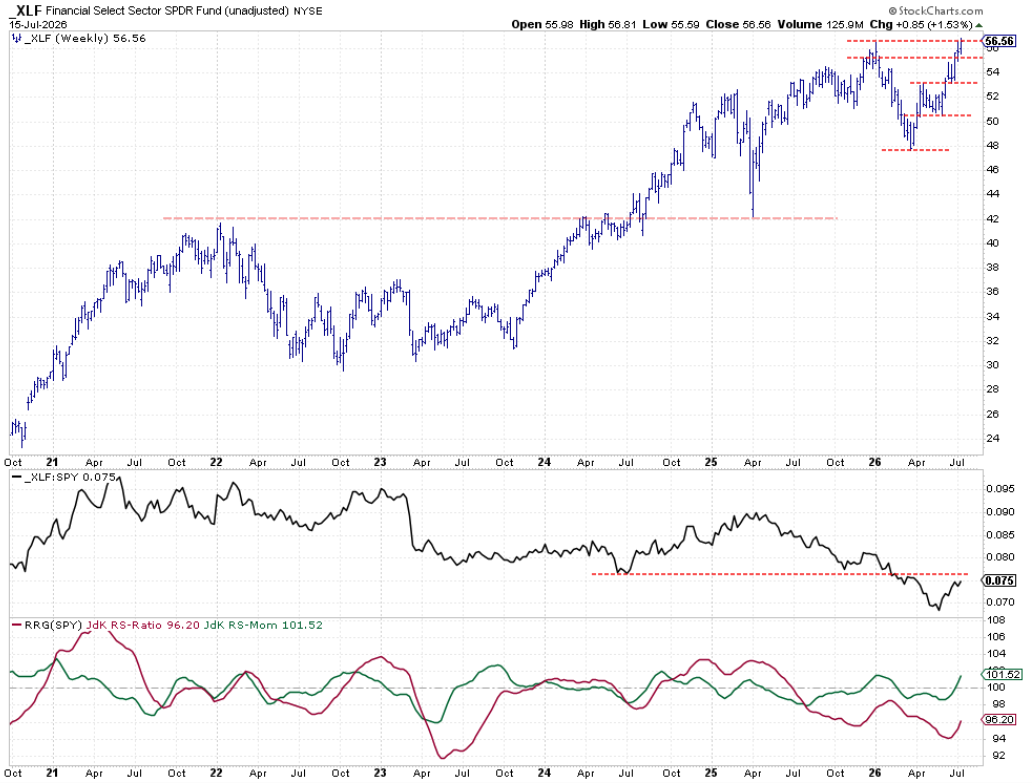
Financials moved up in the rankings and are pushing against overhead resistance around 56.50. A breakout could trigger further gains and positively impact the RS line. Both RRG lines are rising, with RS-momentum well above 100.
Real Estate
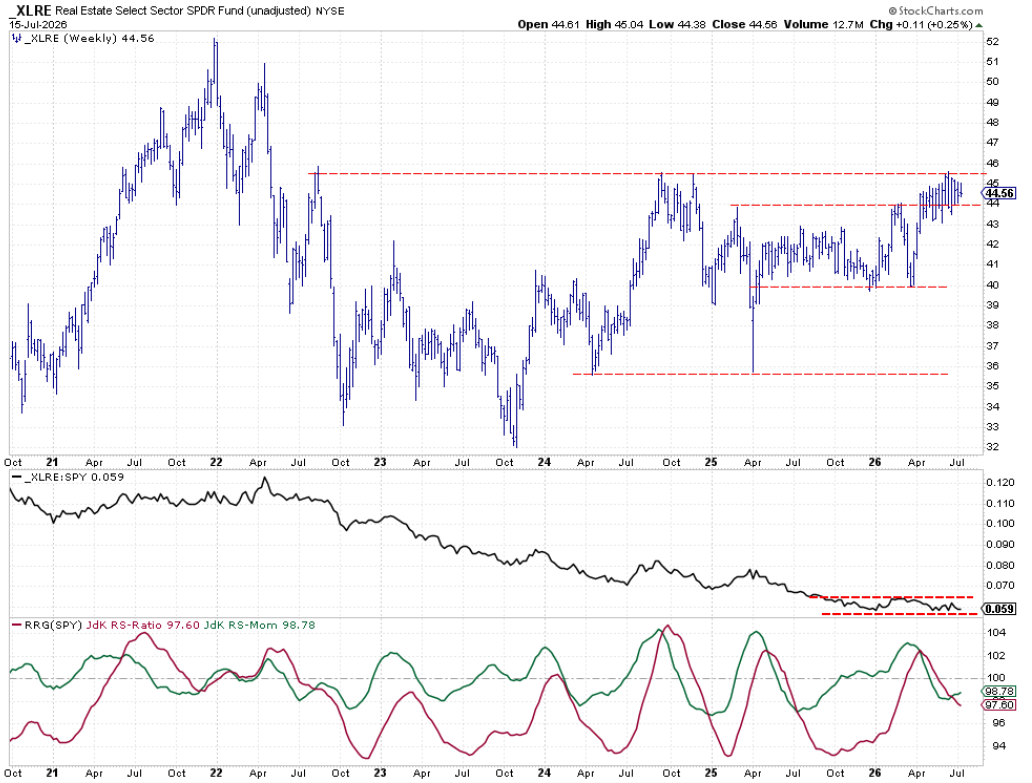
Real Estate has been trading in a narrow range between 44 and 45.5 for the past month and a half. The RS momentum line has begun to rise, but the RS ratio needs to follow suit for the sector to maintain its top-five position. Real Estate dropped from third to fifth in the rankings, so it needs stronger relative strength soon.
Portfolio Performance

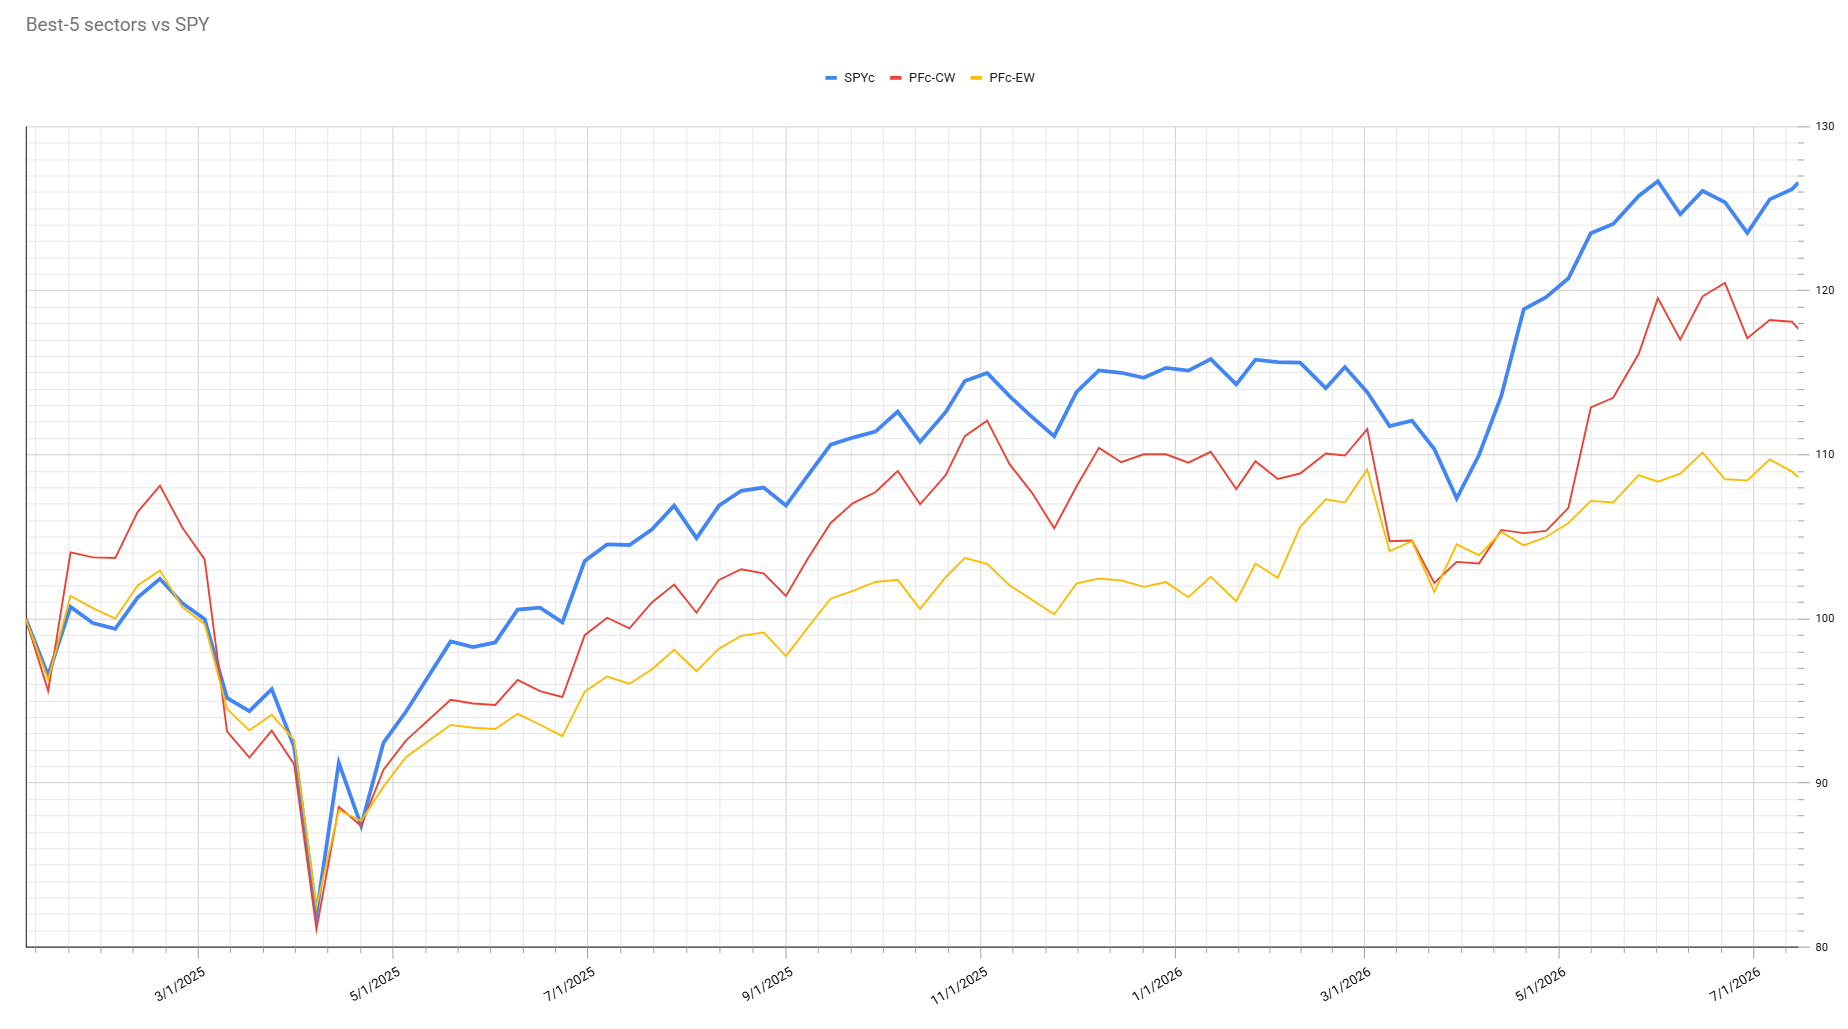
The portfolio’s underperformance widened slightly to -8% versus the S&P 500. The S&P’s line on the performance graph moved higher, while the portfolio’s capital-weighted line also rose but lagged behind the benchmark.
We will continue to monitor this strategy closely and see how sector rotations and portfolio performance evolve in the coming week. The Technology sector's declining weight in the top five and the addition of other growth sectors will have a twofold effect:
- The portfolio will be less sensitive to only the moves in technology.
- The portfolio is now seemingly more geared toward growth sectors, including Technology, Industrials, and Financials.
Health Care is traditionally seen as a defensive sector but, with the rise of healthcare tech stocks, that is sometimes debatable.
#StayAlert,
Julius de Kempanaer.