The U.S. Dollar Holds Firm as Long-Term Signals Turn Positive
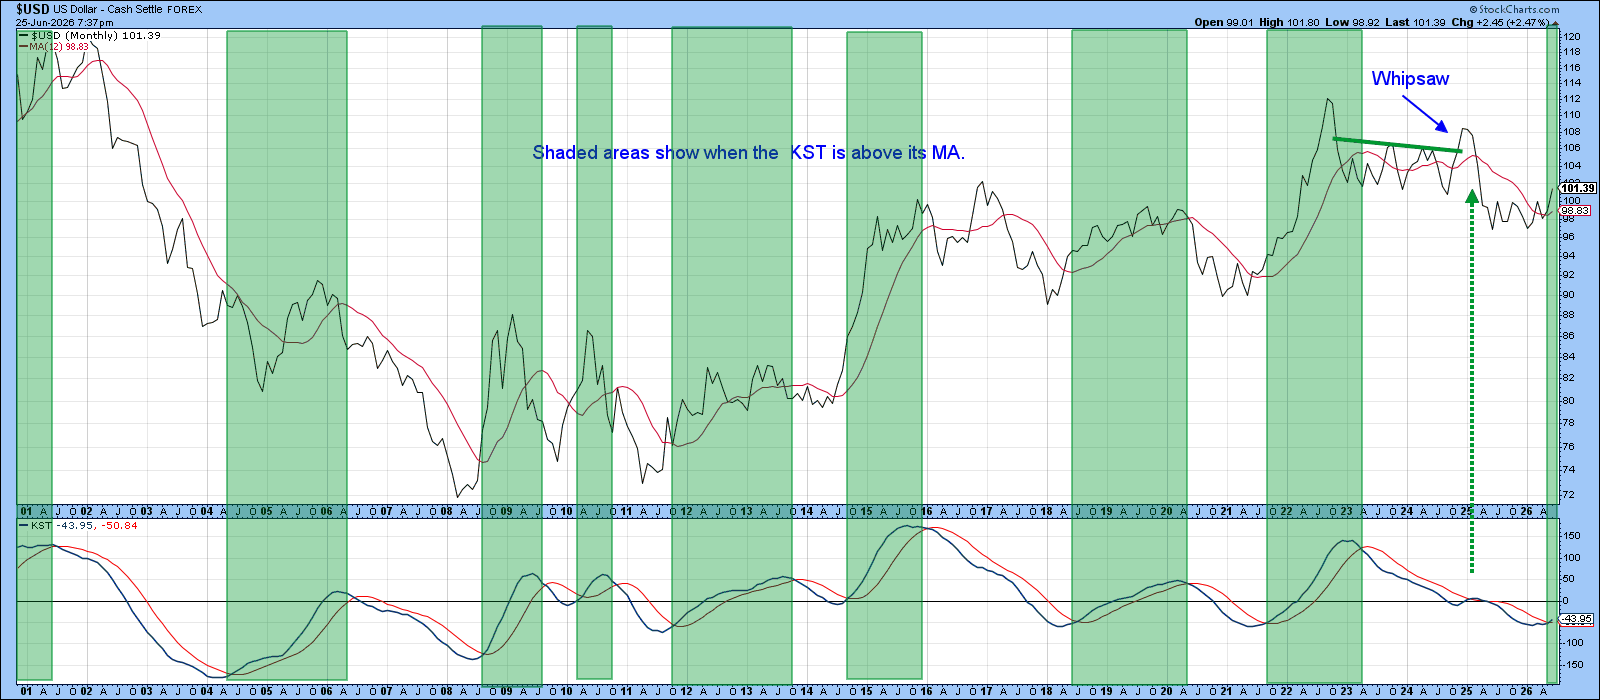
One simple way to evaluate the trend of any market is to check whether the price is above its 12‑month moving average and whether the long-term KST indicator is in a positive position above its own moving average.
Chart 1 shows that the U.S. Dollar Index ($USD) has remained above its 12‑month moving average for the past couple of months, while its KST has only recently started to move above its moving average. The green-shaded areas highlight periods when the KST has been above that average. Although this approach is not flawless, it provides a reasonably objective way to assess the overall trend.
Additionally, the index broke above its 2022–2025 trading range, with the move confirmed by a KST buy signal in late 2024. However, this breakout turned out to be false, serving as a textbook example of how bull traps such as this are often followed by unusually sharp declines.
When the U.S. dollar begins a new trend, it typically influences other markets and financial relationships. If those related indicators move in the same direction as the U.S. Dollar Index, they provide additional confirmation that the trend is valid.
In this context, Chart 2 compares the Dollar Index with three related measures: the SPDR S&P 500 ETF relative to the MSCI EAFE ETF (SPY/EFA), U.S. versus international bonds using iShares products (AGG/BWX), and a confidence-related relationship, treasuries vs. corporate high yield (TLT/HYG). When the momentum of these relationships and that of the Dollar Index move in the same direction, confidence in the dollar’s signal increases. The green-shaded areas represent periods when the dollar index KST (displayed in teal) is in a positive trend and accompanied by these relationships.
Currently, the rising Dollar Index is supported by a positive AGG/BWX ratio and a positive TLT/HYG trend. However, the SPY/EFA relationship is still declining. Despite that weakness, the overall picture remains broadly consistent with a bullish outlook for the U.S. dollar.
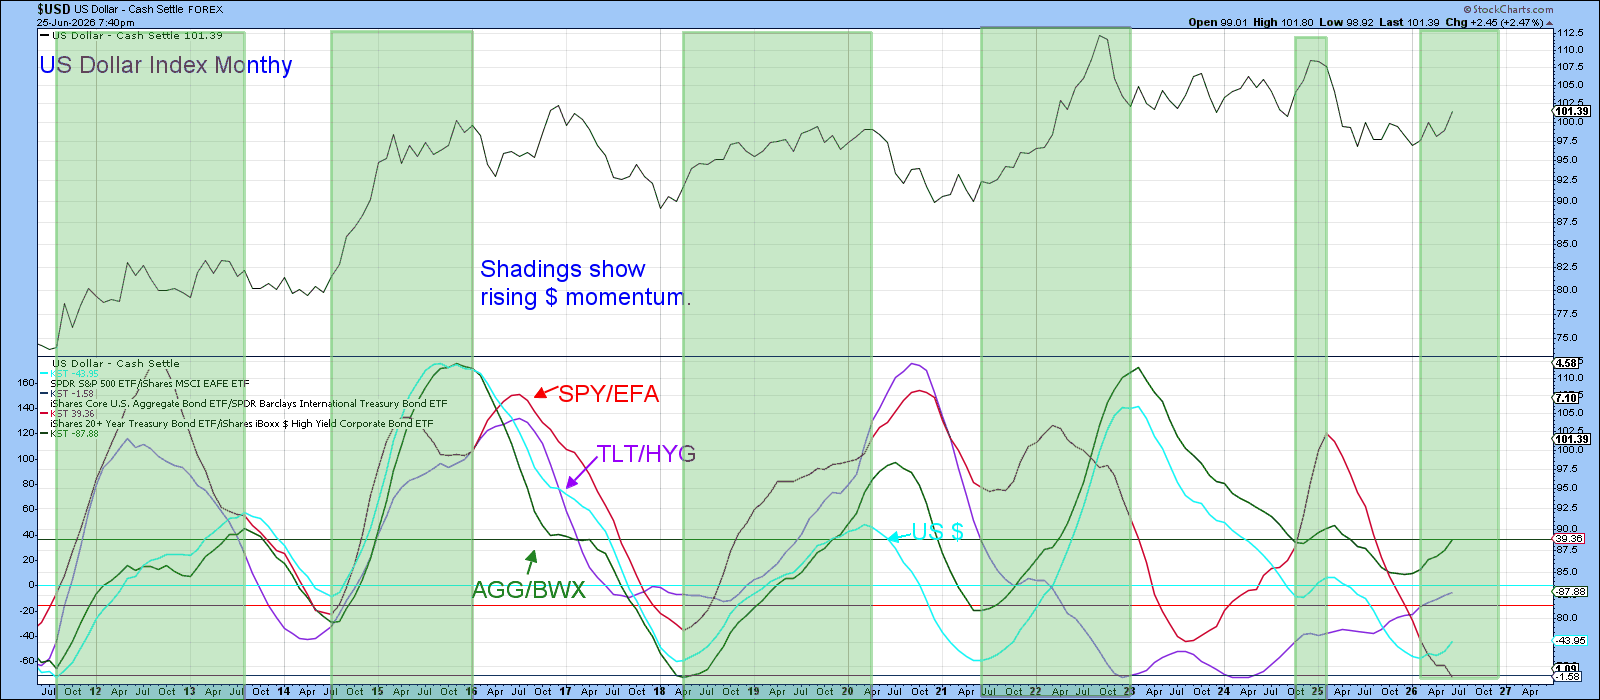
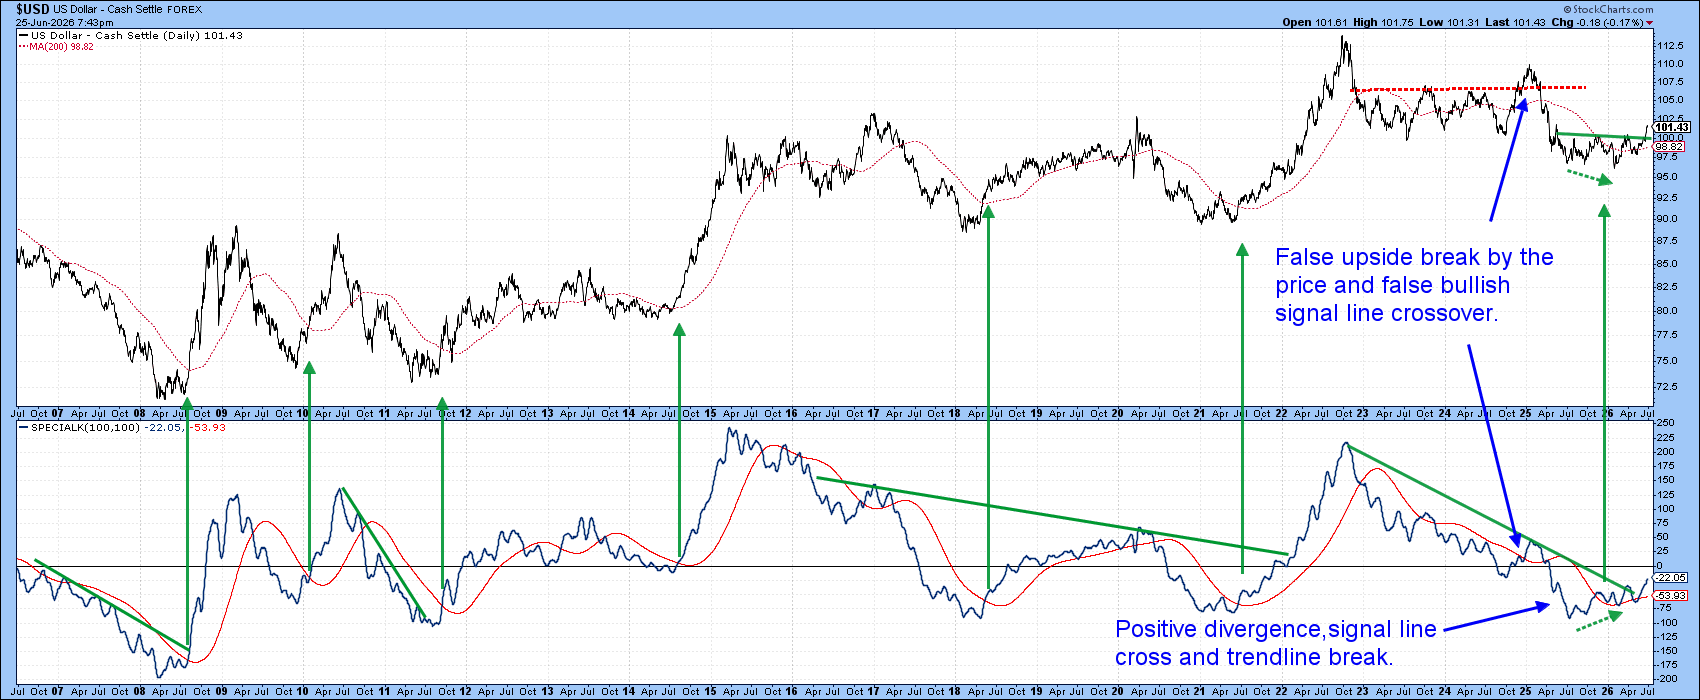
Chart 3 shows that the Special K (SPK) has consistently generated bull market signals when it moves decisively above its signal line. Earlier this year, another bullish crossover occurred; this signal was reinforced by a positive divergence between the SPK and the Dollar Index and a decisive break above the momentum downtrend line that began in 2023.
The most important development, however, was the breakout in the index itself, which added further confirmation to the bullish outlook.
Its significance is more apparent in Chart 4, where the horizontal trend line can be traced all the way back to 2022. Initially, it served as a support zone; following its violation, that role reversed to one of resistance. The Index is now back above the 65-week EMA. We can also see that both KSTs are in a positive mode, thereby supporting the breakout. Also important is that neither of these indicators is overstretched and, therefore, unlikely to constrain the rally’s potential.
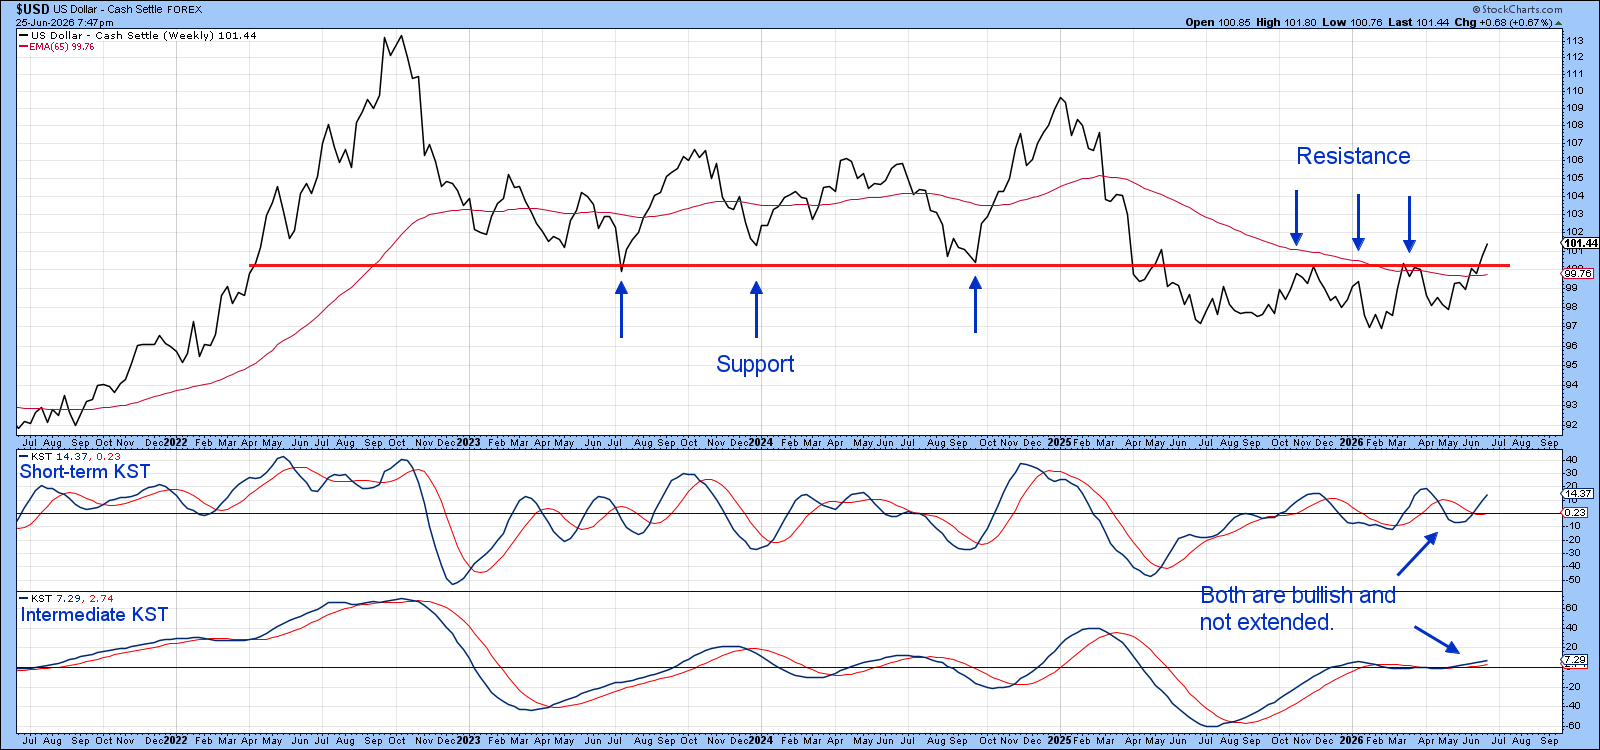
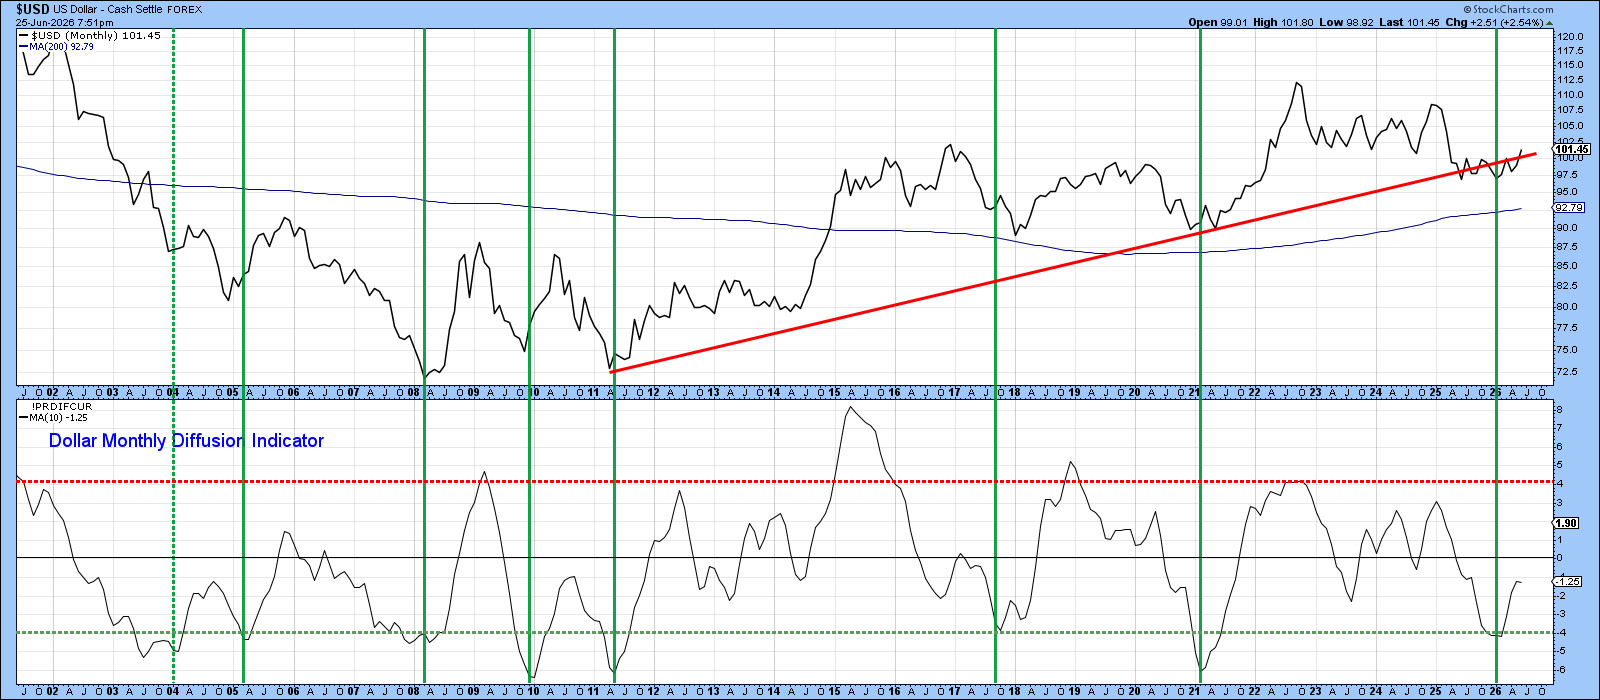
Chart 5 compares the U.S. Dollar Index with an oscillator derived from multiple cross‑dollar relationships experiencing a positive trend. One important observation is that, over the past two years, the index has broken below its red secular uptrend line several times but has now moved back above it. Those prior declines are likely to have been false signals, as the oscillator has recently turned upward from a level at or below the green-dashed oversold line. Similar instances in the past are marked by vertical lines on the chart. In virtually every case, these reversals have led to meaningful rallies, with the notable exception of the 2004 signal.
In early 2025, there was widespread expectation that the dollar would decline significantly. However, it managed to remain resilient, defying those premature predictions of weakness. While a consolidation or digestion of recent gains may occur in the near term, the broader message from long-term indicators points upward, suggesting an overall bullish direction for the dollar.
Good luck and good charting,
Martin J. Pring
The views expressed in this article are those of the author and do not necessarily reflect the position or opinion of Pring Turner Capital Group of Walnut Creek or its affiliates. The Six Stages of the Business Cycle are followed each month in Martin Pring’s Intermarket Review.