Can AI Really Pick Winning Stocks? Try Using This Instead
Key Takeaways
- AI can save you time by summarizing large amounts of information, but it should not make your stock-selection decisions.
- StockCharts helps you analyze stock market trends, leadership, and price action with transparent data.
- Scans can narrow thousands of stocks into a focused list of stocks that are worth a closer look.
Interest in using AI to select stocks has surged. In many ways, it resembles the neural-network craze of the mid-1990s. Some investors may remember the expensive software packages and late-night infomercials promising extraordinary returns. Some of these systems even worked, right up until market conditions changed.
A similar trend is unfolding today. Social media is filled with claims that AI can help investors build wealth, find the next market leader, or generate profitable trades on demand.
But can you trust AI to choose stocks that will deliver strong returns? Let's unpack!
Using AI To Pick Stocks: The Pros and Cons
AI can be useful for analyzing financial data, summarizing news, identifying trends, and screening stocks. It can also save time by condensing earnings reports, economic releases, market data, and the constant stream of headlines.
But getting this information is only the beginning. You still need to analyze the information and decide how it fits into your investment strategy. This is where using AI to select stocks becomes challenging, even dangerous.
Similar to earlier neural networks, the most widely-used AI models, such as ChatGPT, Claude, and other large language models (LLMs), study past data and apply these patterns to current information. The problem with this is that a model can become too closely fitted to the past, resulting in biased results. In hindsight, a strategy may look impressive but, when market leadership changes, volatility rises, or investor sentiment changes, AI tools could provide misleading recommendations.
In addition, it can be difficult to know what data an AI application is using or how current that information is. When making investment decisions, data quality is of the utmost importance. Inaccurate financial data, misleading social media posts, absence of tail risk events, and outdated data can affect the quality of an AI-generated recommendation. The result may be entering a trade too late or too early, poorly sized positions, or unnecessary overtrading.
Importantly, AI recommendations are only as good as the prompts a user provides. Social media is full of posts promising "the perfect prompts" for finding winning trades. Unfortunately, most of them lead to little more than clickbait, questionable advice, or phishing scams.
A Smarter Approach
While AI may be useful for summarizing information, you'll need more than a summary to select stocks. You need dependable data, you need to analyze price action, and you need to apply your own strategies and risk-management rules.
This is where StockCharts can play an important role. StockCharts, through the power of simpler and more targeted tools than LLMs, processes large amounts of market data and presents it in a clear, visual, and structured format. Instead of relying on black-box recommendations, you can see the charts, define your own criteria, and understand why a stock appears in your results. There's no curve-fitting, the data is accurate, and no prompts are required. You decide what matters, build scans, review charts, and determine if a potential trade fits your investment goals.
The Market Summary page, for example, brings the broader market into focus. At a glance, you can review the performance of the major indexes, sectors, industry groups, bonds, commodities, and other key areas of the market. Once you have this information, you can examine the charts and determine if the broader market indexes are still trending higher, if they’re pulling back within the uptrend, or if they’ve reached a key support level and are getting ready to reverse.
Once you’ve figured out the market environment, you can use the StockCharts Scan Engine to identify stocks that match the conditions you’re looking for.
A Step-by-Step Stock-Picking Process
So how can you incorporate StockCharts' AI functionalities into your research and stock-selection process?
Let's start with the Equities panel on the Market Summary page. If we suppose, for this example, that the major U.S. indexes are trending higher, trading in the direction of the broader trend can help put the market’s momentum on your side.
So, which stocks deserve a closer look?
Long-Term Trend-Following Scan
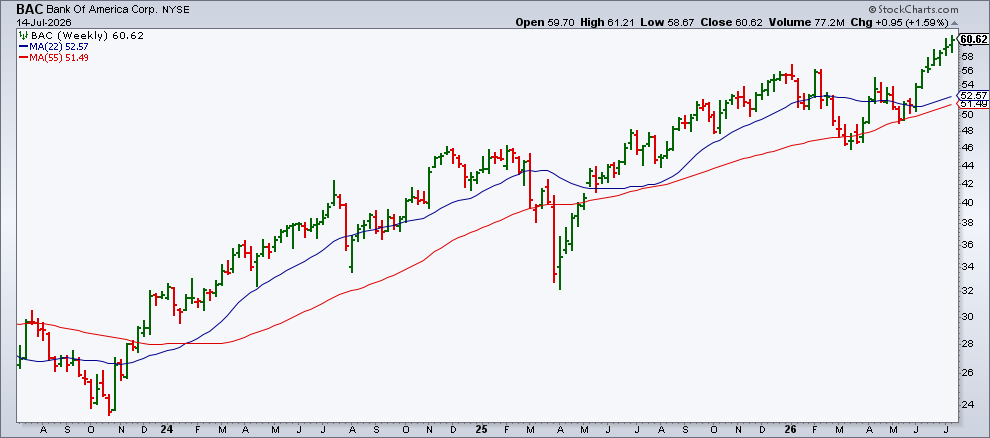
For a long-term trend-following strategy, you could begin with a simple scan that identifies S&P 500 stocks whose shorter weekly moving average is above the longer weekly moving average.
[group is SP500]
AND [SMA(22, Weekly Close) > SMA (55, Weekly Close)]
When the market is trending higher, this scan can return a long list of stocks. This is where broader market context becomes valuable.
Going back to the Market Summary page, suppose you see that the Financials sector is reaching new highs. You can sort your Scan results by sector and focus on stocks in the Financials sector, or add a sector condition directly to the scan.
AND [group is FinancialSector]
This creates a focused list of stocks that are participating in a long-term uptrend and an area of market leadership.
Below is a chart of Bank Of America (BAC), one of the stocks that was in the scan result. Notice the weekly trend is in a confirmed uptrend.
Swing Trading System
Even in a bullish market, stocks and indexes don’t move higher in a straight line. Pullbacks can create opportunities, especially when prices approach a key support level and begin to stabilize.
The following scan looks for stocks that just moved below their lower Bollinger Band®.
[[group is SP500] OR [group is SP 400] OR [group is SP600] OR [group is NASDAQ100]]
AND [Yesterday’s Daily Close >= Yesterday’s Daily Lower BB(20,2)]
AND [Today's Daily Close = Today's Daily Lower BB(20,2.0)]
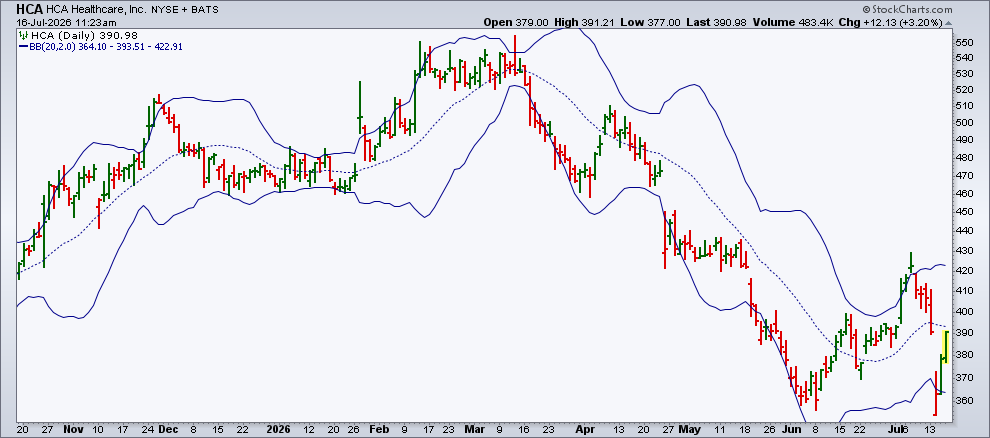
Moving below the lower Bollinger Band doesn’t guarantee a reversal, but it can highlight stocks that are oversold and could move higher. You can review each chart for additional evidence such as stronger volume, improving momentum, and a follow-through to the upside.
On July 14, 2026, HCA HealthCare (HCA) moved below its lower Bollinger Band, and appeared in the scan results. The stock then reversed and moved back toward its 20-day moving average (dashed line). By monitoring the chart after it appeared in the scan, you could have looked for a long entry near the lower Bollinger Band and considered taking profits when the stock reached the moving average.
Short-Term Momentum Trading System
Shorter-term traders may prefer stocks that are showing strong momentum and likely to spike higher.
The following scan looks for S&P 500 stocks that are trading above their 200-day moving average, have daily volume that’s above the 50-day average of volume, and have a 14-period Relative Strength Index (RSI) above 50.
[group is SP500]
AND [close > SMA(200, close)]
AND [daily volume > daily sma(50,daily volume)]
AND [RSI(14) > 50.0]
Run this scan, review the results, and save them to a ChartList.
These examples represent a small fraction of what you can do with the StockCharts Scan Engine. You can modify the criteria, combine conditions, or build new scans that align with your investment goals and trading style. Once you've created scans for different strategies and market conditions, running them becomes a quick and repeatable part of your routine.
The Bottom Line
Building a scan is like designing a kitchen or bathroom. You have plenty of individual choices, but the finished result depends on how well those elements work together and if they support the outcome you want.
StockCharts gives you a more transparent, hands-on process than relying on recommendations generated by an LLM. You can review the overall stock market, define conditions that are important to you, scan for qualifying stocks, and evaluate the charts. The tools narrow your field. The final decisions about what to buy, when to enter, how much to risk, and when to exit are yours.
Find the setups. Skip the noise. The Scan Engine gets you straight to the charts that matter.
Disclaimer: This blog is for educational purposes only and should not be construed as financial advice. The ideas and strategies should never be used without first assessing your own personal and financial situation, or without consulting a financial professional.