Energy Sector Power Play: Why Exxon and Chevron Could Win Into Year-End

Key Takeaways
- XOM and CVX break to new highs ahead of earnings and as global oil prices hold above $115.
- Cooling crack spreads pressure refining stocks, with the CRAK ETF falling below key technical support, triggering intra-sector rotation.
- Bullish chart patterns and favorable year-end seasonality could give XOM and CVX further upside this quarter and beyond.
Brent crude oil traded through $115 per barrel as the Fed prepared its policy rate decision. Companies continue to battle elevated energy costs, while U.S. consumers face record-high pump prices for this time of year. All of it comes ahead of next Tuesday's midterms. But traders are watching other volatility catalysts in the oil patch. On Friday, the Energy sector's two stalwarts, Exxon Mobil (XOM) and Chevron (CVX), serve up Q3 results. They are not surprisingly a pair of S&P 500 winners year-to-date.
I'll dig into those names and their charts in a moment, but other storylines are unfolding in the sector. Crack spreads were on everyone's macro radar over the summer. The price difference between crude oil and its distilled products mooned amid strained global refinery capacity and steep shipping insurance and transportation costs. Slowly, cracks have drifted from the zeitgeist. The most widely followed gauge (the 3-2-1 crack spread) has eased from above $75 to under $60, a potential boon for transport stocks. Still about double the year-ago price, the very near-term trend is lower.
Refiners Lose their Luster
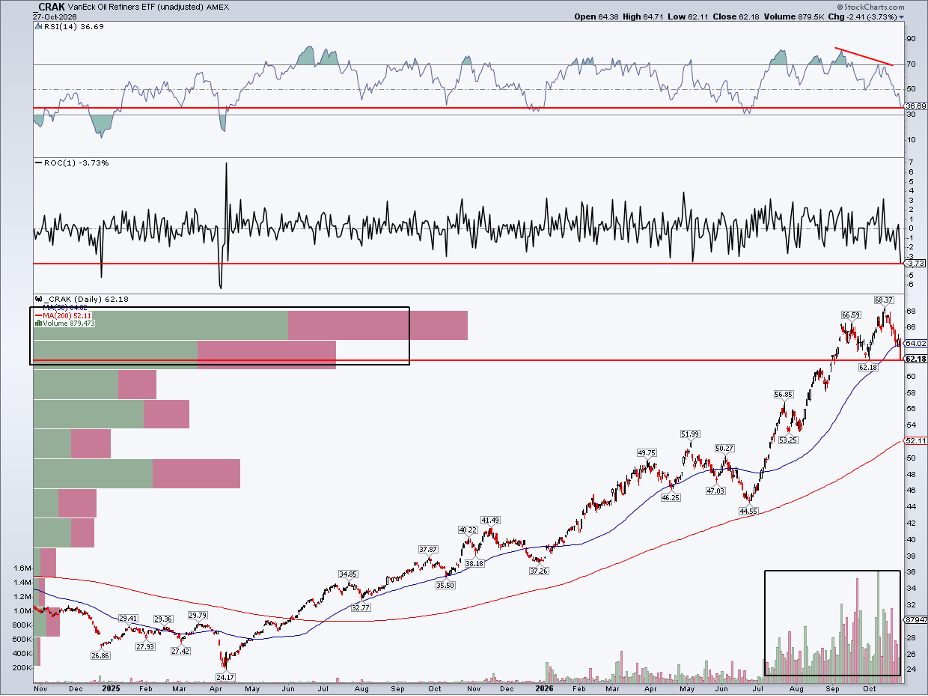
Why should stock traders care? Well, ebbing gasoline cracks have been bad news for one of 2026's hottest trades: refining stocks. Players like Valero (VLO), Phillips 66 (PSX), and Marathon Petroleum (MPC) have settled back. Indeed, on Tuesday, the broader VanEck Oil Refiners ETF (CRAK) suffered its worst session since early April 2025. The refiners ETF retreated 3.7%, falling through its rising 50-day moving average and closing at its lowest level since late August. CRAK's RSI momentum oscillator confirms the price breakdown, notching lows going back four months.
CRAK's chart is interesting in that it became such a popular trade first at the start of the conflict in Iran, then again in the second half of the year. You can see that in the massive volume increase in Q3. A result is many so-called "dead bodies," or traders who bought shares and are now underwater. A high amount of volume by price exists from $62 to $68, which will likely make rally attempts tough on the bulls.
Exxon Takes the Lead
If the refiners trade is shut down for now, how does that affect the rest of the sector? For now, XOM and CVX appear to be in the catbird seat.
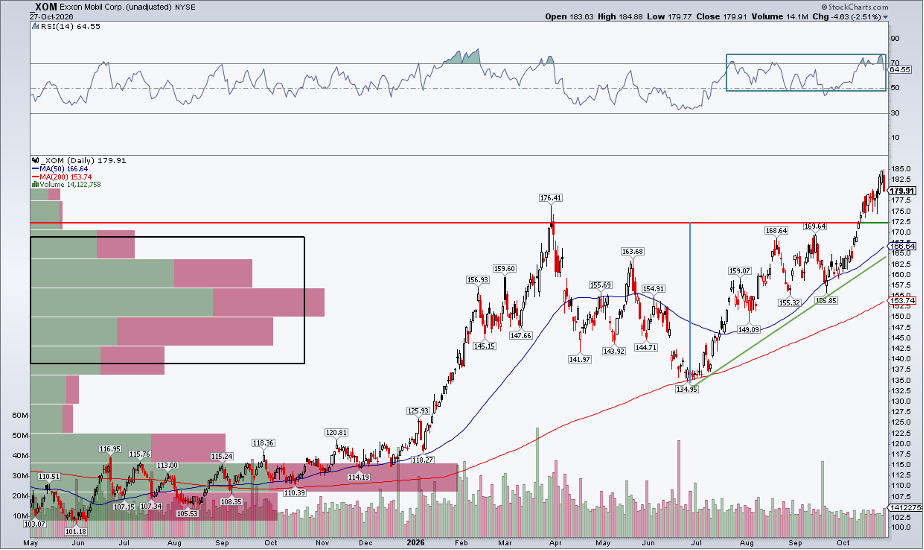
Starting with XOM, the integrated giant tagged new record highs earlier in the week on very strong RSI momentum. Its long-term 200-DMA has been rising all year, but shares initially peaked very early in the U.S.-Iran war. $176 was the high-water mark until just earlier this month, and the presumption is that former resistance becomes new support. What's more, high-volume activity lies just under the March peak, which should offer a cushion on pullbacks.
Elsewhere technically, XOM's RSI appears strong, unlike CRAK's. Ranging from 40 to 80, it's a bullish zone for the momentum oscillator, helping to confirm price action. While a broad support area from the high $160s to mid-$170s is in play, we can calculate a measured-move upside price target based on the March-through-September consolidation. That $35 range, added to the breakout level, yields about $210. It's not a precise objective, but a ballpark idea of how much higher XOM could run.
Perhaps Friday's Q3 report will be yet another bullish spark. As it stands, the options market prices in a very small 2.9% earnings-related stock price swing based on the at-the-money straddle expiring this week. You can view all the key options data in the StockCharts OptionsPlay Strategy Center.
Want to get more from the OptionsPlay Add-On? Tony Zhang's blog posts and videos can help you better understand options strategies and put these tools to work in your trading process.
CVX's Clean Breakout & How High it Could Go
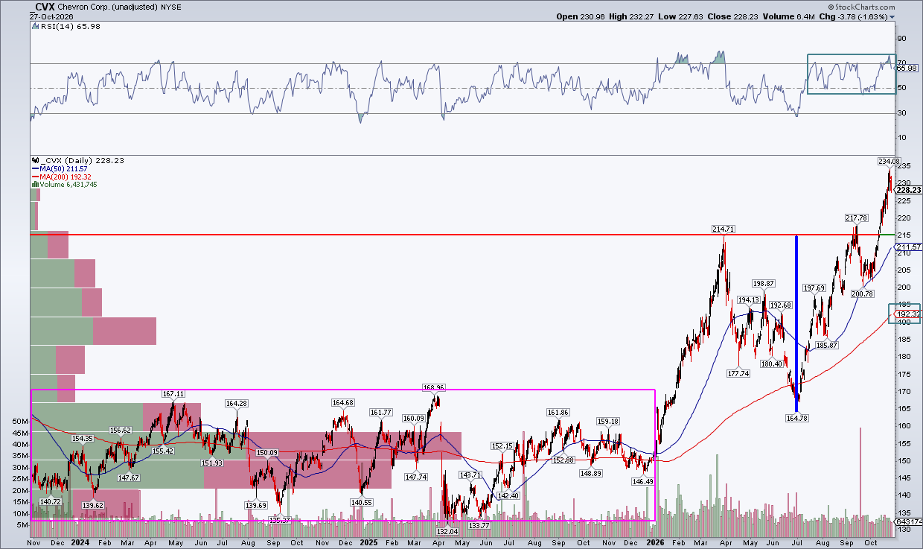
Chevron has similar vibes. Here, I zoomed out to three years to show how the oil majors did a whole lot of nothing leading into 2026. That was a firm base, but it also laid the foundation for a sustained advance since January. CVX peaked at $215 in March, plunged to $165 mid-year, tested the Q1 high in September, then ultimately broke out to new highs this month.
With earnings on tap, a classic cup-with-handle pattern augurs for an eventual move to $265. If we see a negative reaction to the Q3 report, look for support in the $215 to $220 zone.
Energy's Year-End Advantage
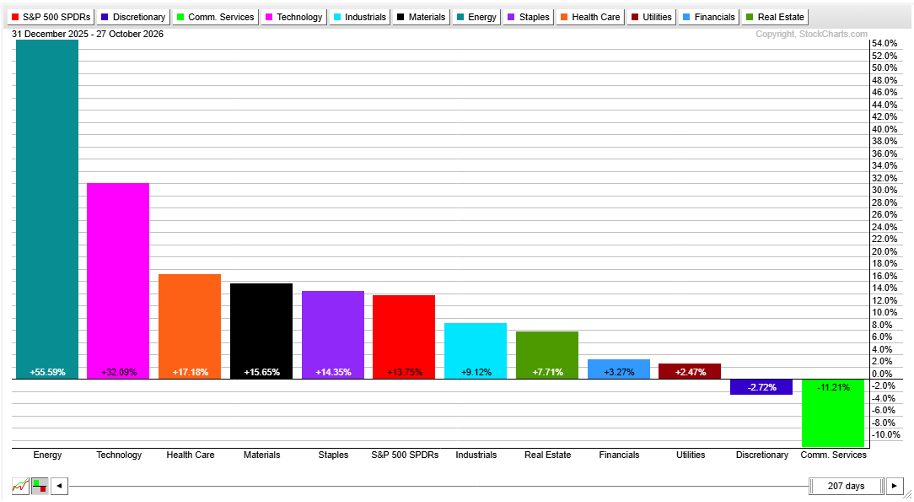
Something else to consider is the seasonal effect of tax-loss selling. There obviously won't be much of that in the Energy sector. Oil & gas stocks (XLE) are collectively up 56% YTD, seemingly running away with the 2026 sector performance title. Information Technology (XLK) is the runner-up so far, returning just 32%. Traditional Wall Street wisdom asserts that in positive years, a Q4 chase for performance tends to play out. If that's true this time, XLE (namely XOM and CVX) could be where you want to be.
By now, we all know that equities tend to perform well leading into and through the midterm election, and for XLE, November and December are nicely green in the year's final two months when scanning data since 1998.
The Bottom Line
Exxon and Chevron now lead the Energy sector. Refiners were the spicy plays as the Strait of Hormuz shuttered and crack spreads burst higher. For now, that trade is in the penalty box, given weak price action in the CRAK ETF. XOM and CVX have taken control, and with earnings imminent, be on the lookout for trend continuation into year-end.
Disclaimer: This blog is for educational purposes only and should not be construed as financial advice. The ideas and strategies should never be used without first assessing your own personal and financial situation, or without consulting a financial professional.