StockCharts Insider: 5 Bullish Candlestick Patterns — Ranked, Tested, and (Mostly) Easy to Spot
Before We Dive In…
Do you know how many candlestick patterns are out there in the technical pattern universe? Just a little over 100. However, not every candlestick pattern has proven to be reliable or effective based on historical consistency. For this article, I want to zoom in on five of them, all of which are bullish reversal patterns. Four look really good, statistically, and one’s close to 50/50. Still, they’re worth knowing and easy to screen. But do they have an edge over other candlestick patterns? That’s a more nuanced question.
Patterns with an Edge
First off, what constitutes an edge? Well, an edge comes in many forms. Informational edges and execution edges can give you a real advantage but, as a retail trader, you won’t have access to those. That’s often the domain of big institutions with access to computing power most individuals can’t access. So let's scratch those. There are also behavioral and niche-informational edges, which you can develop over time.
To get down to the general definition, though, an edge is a statistically-verified advantage that’s been tested across a large sample of trades.
Insider Tip #1: If You Can Access Current Statistical Data, Check It First.
There are different ways of getting statistical data on patterns and systems. One resource I frequent is Thomas Bulkowski’s site based on his Encyclopedia of Chart Patterns and Encyclopedia of Candlestick Charts. While I had to buy the books, his site is a free resource. Checking patterns against large, real-world sample sizes is practically the only way to spot patterns with statistical significance. And these resources are what I am using for the following patterns.
Five Patterns - Strongest to Weakest
1 - Morning Star: Picture a long declining candle, a short middle one separated by a gap leading to and from it, and then a long rising candle. The market started off overwhelmingly bearish, enough to create a gap the next morning. That’s followed by a narrow range of indecisive trading and, after that, a strong rally. That’s a morning star, and its reliability is pretty high. Take a look.
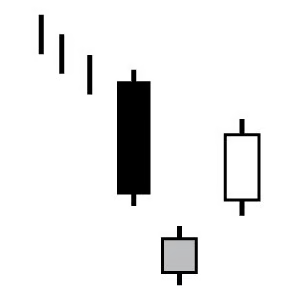
Statistically, its reversal rate stands at around 78%. Reasonably significant. The not-so-sunny news: it occurs moderately. Doesn’t happen often. But when it does, the odds are in your favor, more often than not.
2 - Piercing Line: You see a long declining candle. The next day, it opens even lower. Instead of sinking, however, it undergoes a strong rally. So we have strong bearishness followed by a bullish change in direction.
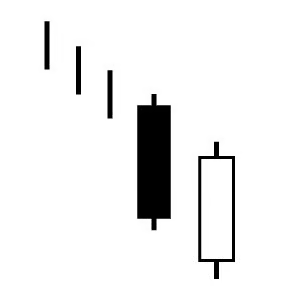
The piercing line has a 64% reversal rate, which makes it relatively reliable. It doesn’t show up frequently, though it does show up more often than the morning star.
3 - Three White Soldiers: Pay attention to this one. With this pattern, we have three long and steady candles rising in a row. Each one opens within the last candle's body, so you can see a steady advance. No long wicks signaling disagreement between bulls and bears. Buyers are in full control.
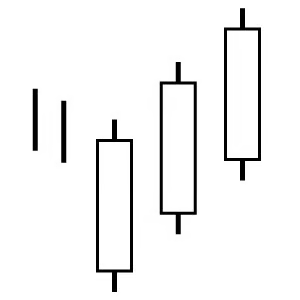
The numbers are as striking as the visual—it has an 82% reversal rate. Referencing the Bulkowski rankings I mentioned earlier, this pattern ranks #3 among all 103 that he’s tested. But there’s a catch: they’re extremely rare. He compares it to finding a $5 bill on the street. But with that rarity comes a high level of reliability. It’s a strong signal if you get the chance to trade it.
4 - Bullish Engulfing: A smaller declining candle gets swallowed up (engulfed) by a larger rising candle the next day. The bullish candle’s open is below the declining candle’s close, yet its close is above the bearish candle’s open. It’s simpler to demonstrate with an image.
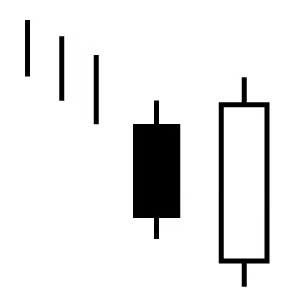
At around 63%, the reversal rate is decent. You’ll also see it frequently, as it’s the most common of the five. However, the quality of the move after the reversal—i.e., the follow-through—can be less reliable. Bulkowski ranks this pattern 84th out of 103. In short, the reversal does happen, but what happens afterwards tends to be underwhelming.
5 - Bullish Harami: Here you’ll see a big black (declining) candle followed by a small white one that fits entirely inside the previous one.
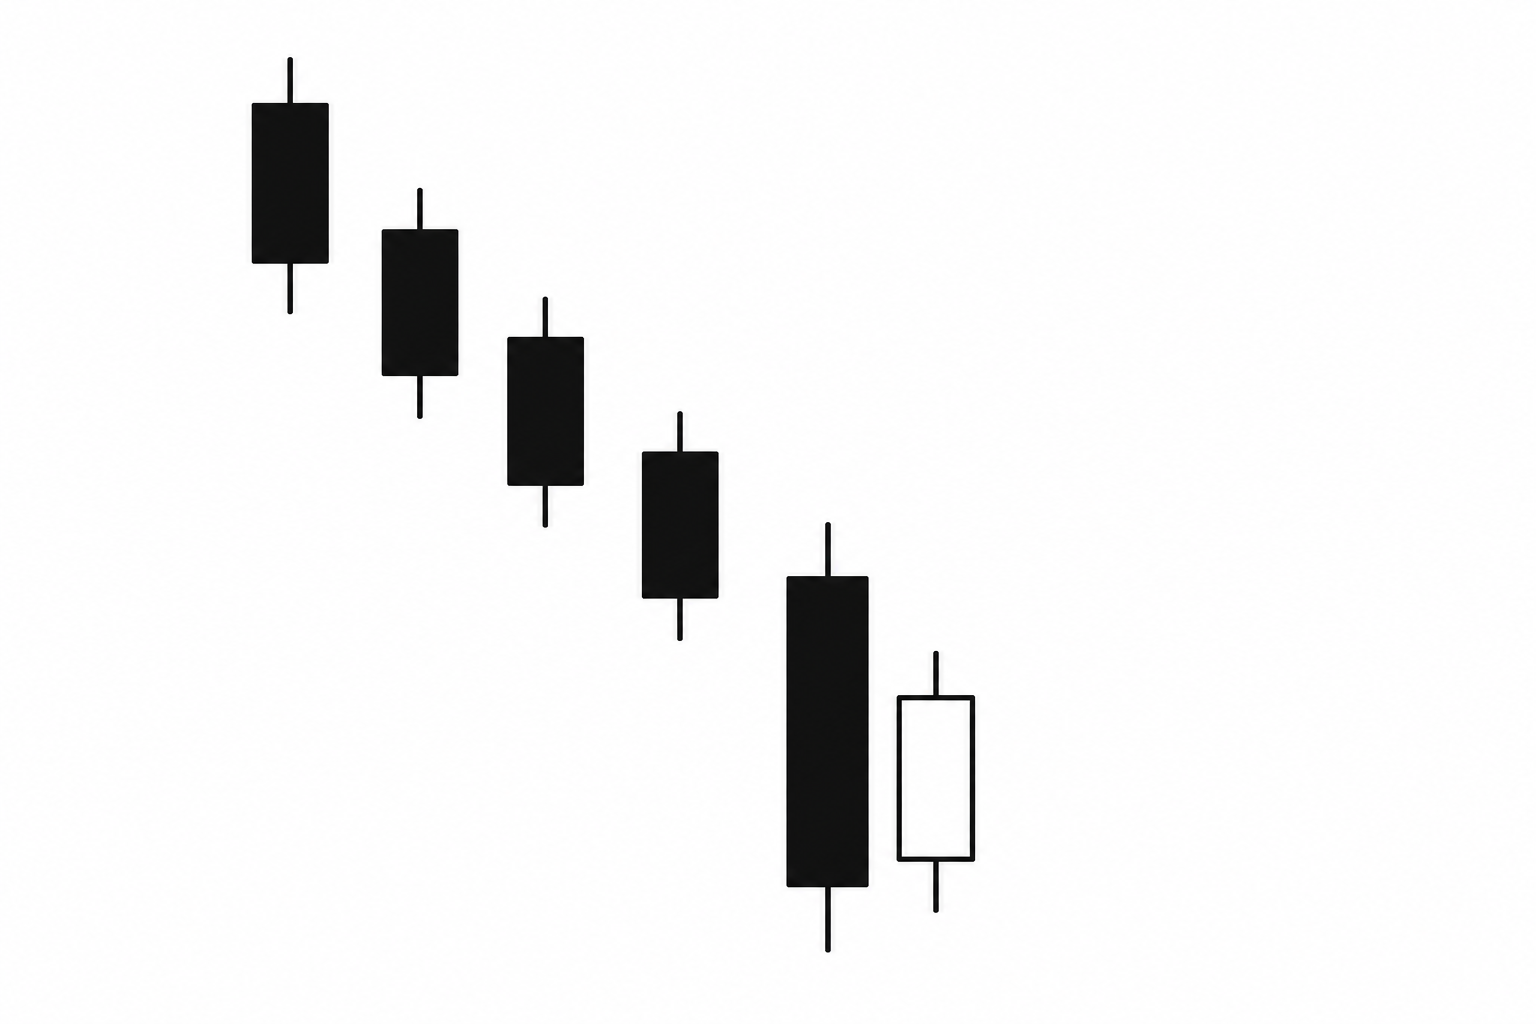
The pattern looks like selling pressure ran out of steam and is now about to flip to the upside. It’s also a very common pattern to find. The thing about it, however, is that it only reverses around 53% of the time. That’s virtually a coin flip. This doesn’t mean you should avoid it; rather, take caution when trading this pattern and keep a stop close by, perhaps somewhere below the swing low of the last declining candle.
Insider Tip #2: Frequency, Reliability, and "Reaching Target" Are Three Different Measurements.
There are three main ways to assess these patterns:
- Frequency: How often the pattern shows up.
- Reversal rate: How often it actually reverses.
- Percentage meeting price target: How well it follows through or reaches a specific target after the breakout. This past part is tricky because traders have different ways of estimating a target.
That’s where your own research comes in. The stats above are based on a lot of data samples. Making them work depends on your ability to manage your trades and interpret the overall context. Remember that you can have the same pattern show up in different contexts.
How to Find These and Other Patterns
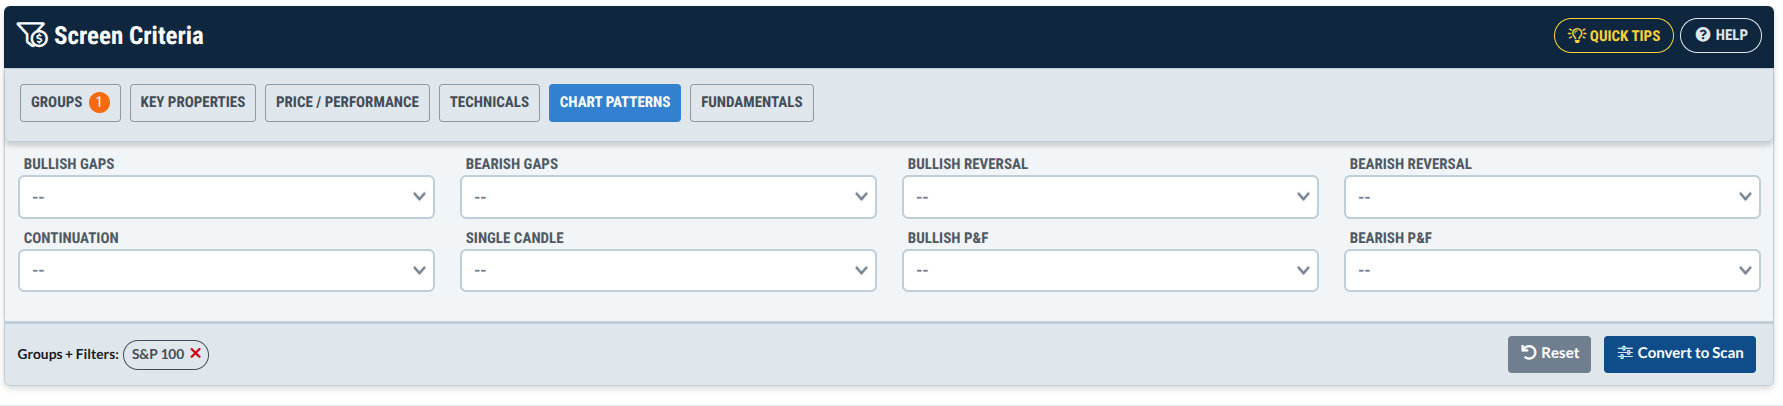
You can find these five on your Screener under Chart Patterns > Bullish Reversal.
You can find more candlestick patterns in the Sample Scan Library.
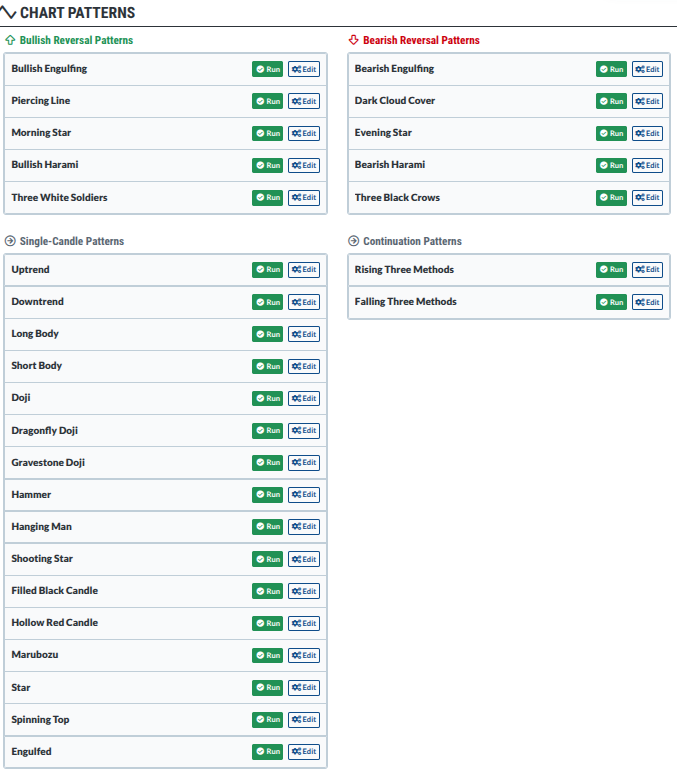
We covered just five of these patterns, but there are more to cover, both for the bullish and bearish side.
If you can get stats on the others, that would be helpful. Do remember that, beyond the stats, you’ll need to interpret the context and manage your trade setups. This is where your skill and research will come in.
The Bottom Line
There are many candlestick patterns designated bullish or bearish. Their performances will vary. Some are going to be more reliable than others. The five that we covered are all findable using the screener. The others can be found using a scan.
Give these a try. Follow their performances, keep in mind the stats we discussed, and carefully analyze the context surrounding them. Consider how you might have traded the patterns, or whether you would have avoided them altogether. In the end, the stats can help you find an advantage. Typically, traders would call that an edge. But the real edge in this case is behavioral and niche. It’s all about how you shape the opportunities based on the patterns and stats rather than relying on the stats alone.