The Dollar's Sixth Attempt at the 100 Area Looks Different

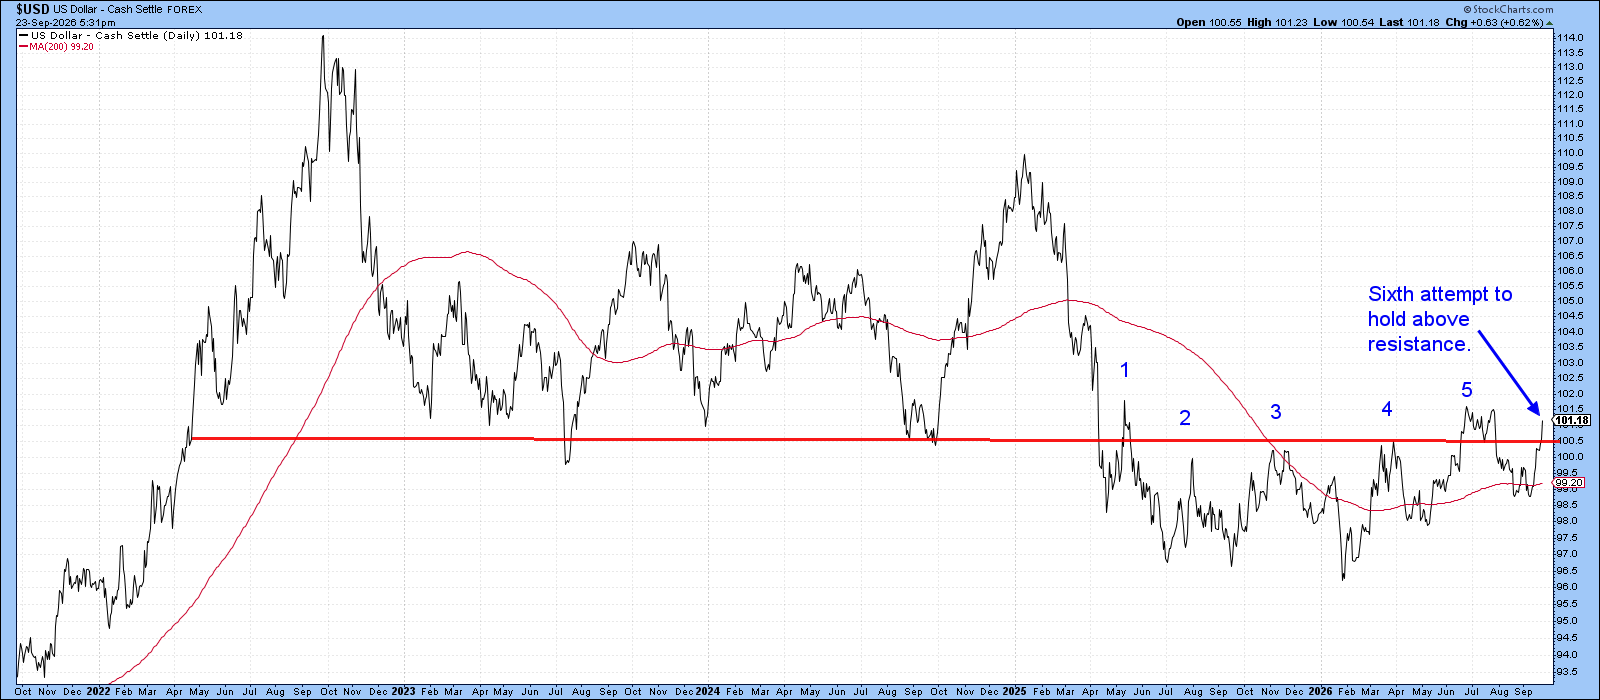
Since early 2025, the U.S. Dollar Index ($USD) has made five unsuccessful attempts to break through resistance near the 100 level. A sixth challenge is now underway, and it will be interesting to see whether this effort proves more consequential than the previous ones. I believe there’s a good chance that it will.
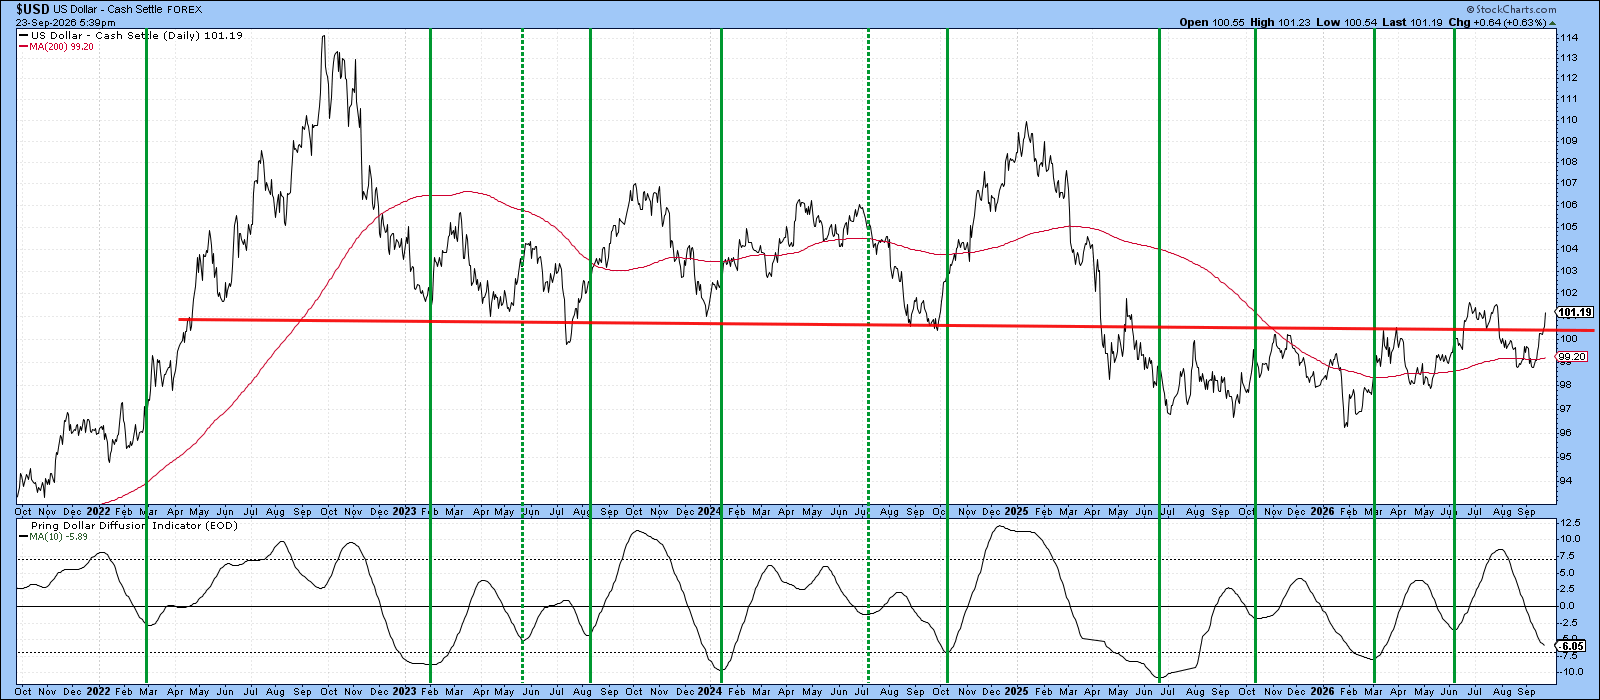
Chart 1 sets the stage by highlighting a support trendline that held from 2022 to 2025, but which subsequently reversed its role and has since acted as a major resistance line.
The Longer-Term Picture
To better appreciate the current setup, it helps to step back and examine the Dollar Index from a longer-term perspective. That picture is presented in Charts 2 and 3. Chart 2 features the long-term Know Sure Thing (KST) and highlights bullish periods when the indicator traded above its nine-month moving average.
The KST is currently in positive territory, and the Index itself remains above its 12-month moving average. Together, these conditions reflect an early cycle condition and suggest the odds are better-than-even that the current rally will finally succeed in establishing a sustained move above the 100 level.
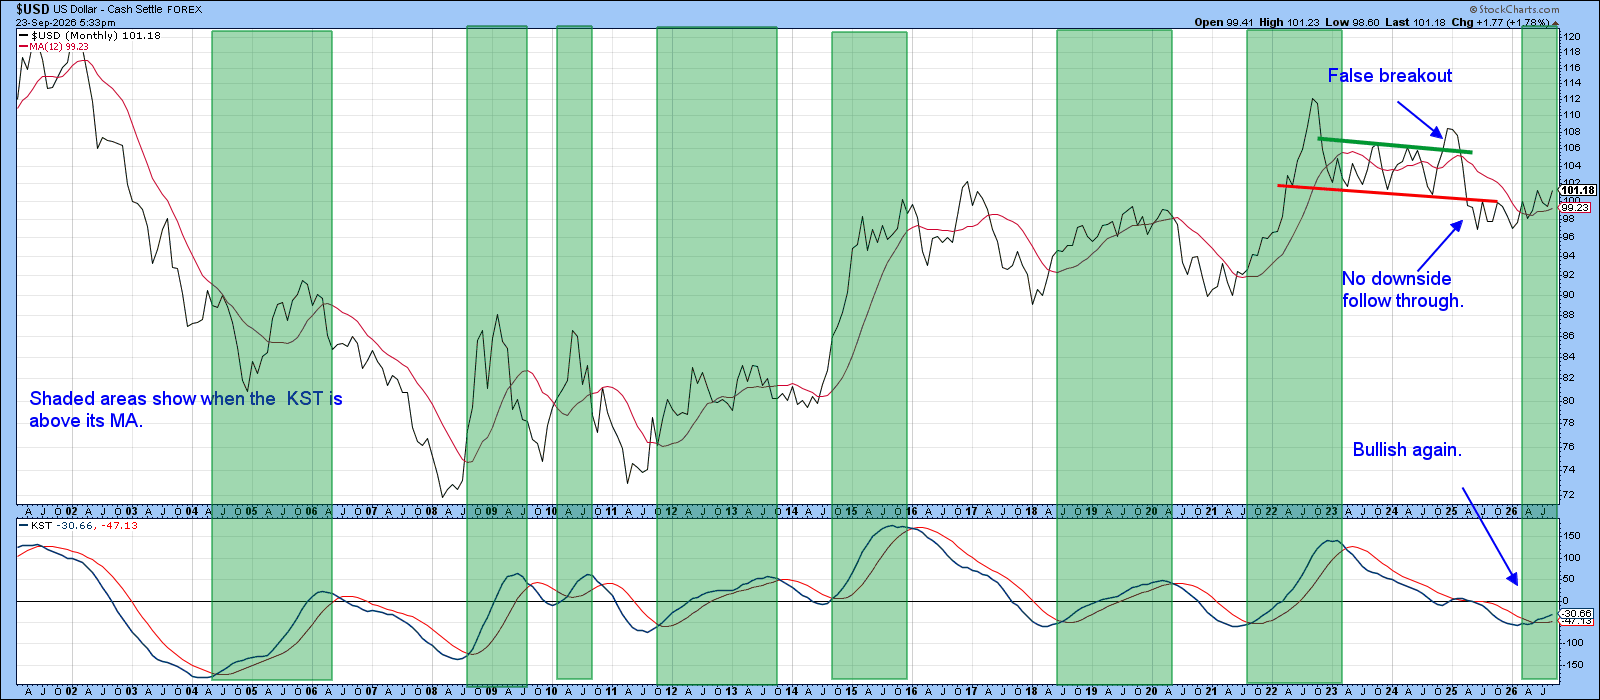
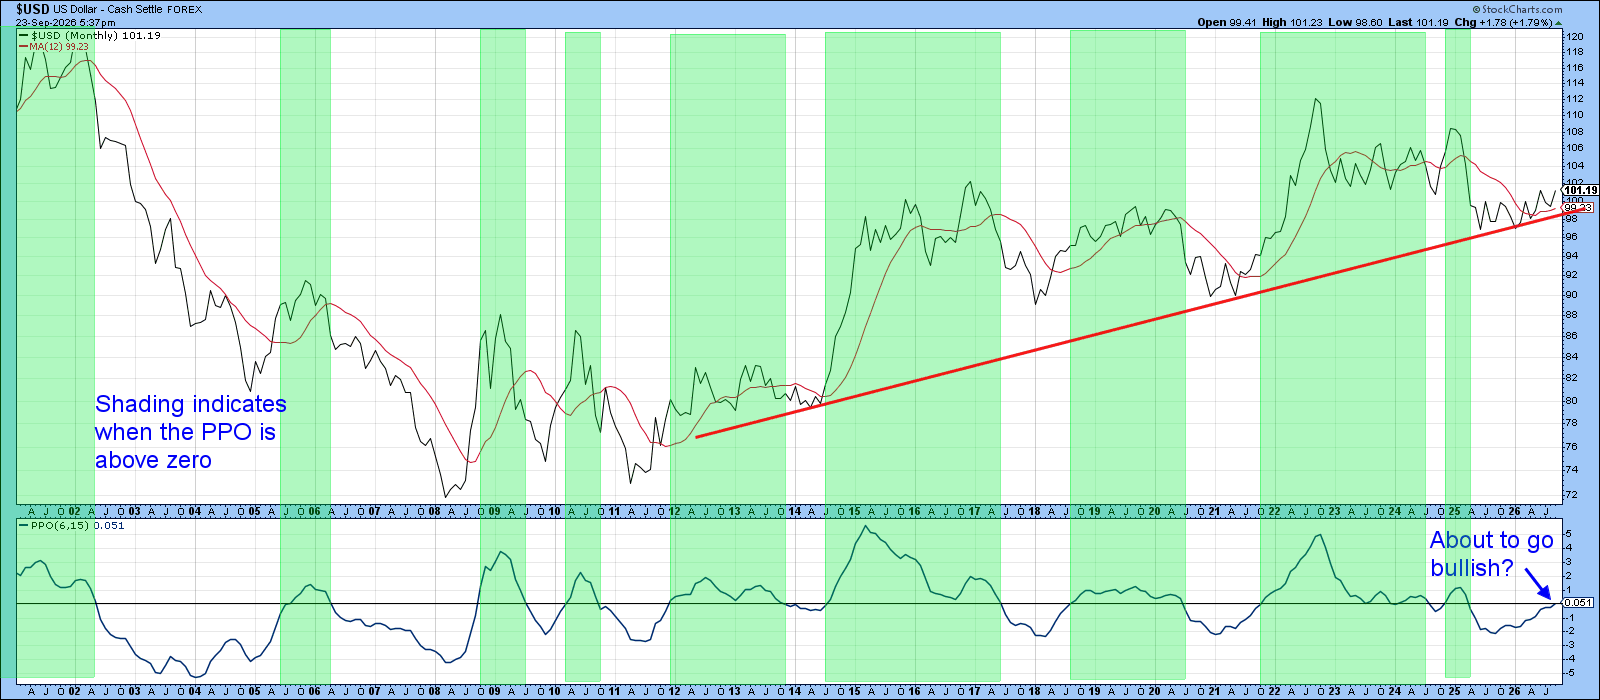
Chart 3 displays what I consider the most reliable indicator of long-term dollar performance, namely the 6- and 15-month Percentage Price Oscillator (PPO). The green shading identifies periods when the oscillator is above zero. Historically, that positive mode has captured most major dollar advances, while negative readings have helped sidestep severe declines such as those seen in 2003–05 and 2006–07.
The chart is especially relevant now because the PPO is poised to generate a fresh buy signal. If it crosses back into positive territory, it would reinforce the view that the current, sixth attempt to overcome resistance at the 100 level will prove successful. It’s also worth noting that the Index has remained above its multi-year red uptrend line, an indication that the secular bull market that began in 2009 remains intact.
Breadth About to Broaden?
Chart 4 compares the Dollar Index with my Dollar Diffusion Indicator, which tracks the percentage of dollar crosses that are in positive trends. The indicator is currently declining, a development that must be viewed as a bearish factor. However, it’s now approaching an oversold level and therefore appears close to a near-term rebound.
The green vertical lines highlight occasions when the indicator reversed to the upside from below-zero readings. Almost without exception, those reversals were followed by rallies in the Dollar Index, typically of sufficient magnitude to carry the current rally to a new bull market high.
A similar outcome now would likely be enough to propel the Index comfortably above its summer 2026 peak. We can also see that, since the February low, the Dollar Index has been tracing out a series of higher short-term peaks and troughs, a classic sign of an emerging uptrend and a definite positive for the intermediate-term outlook.
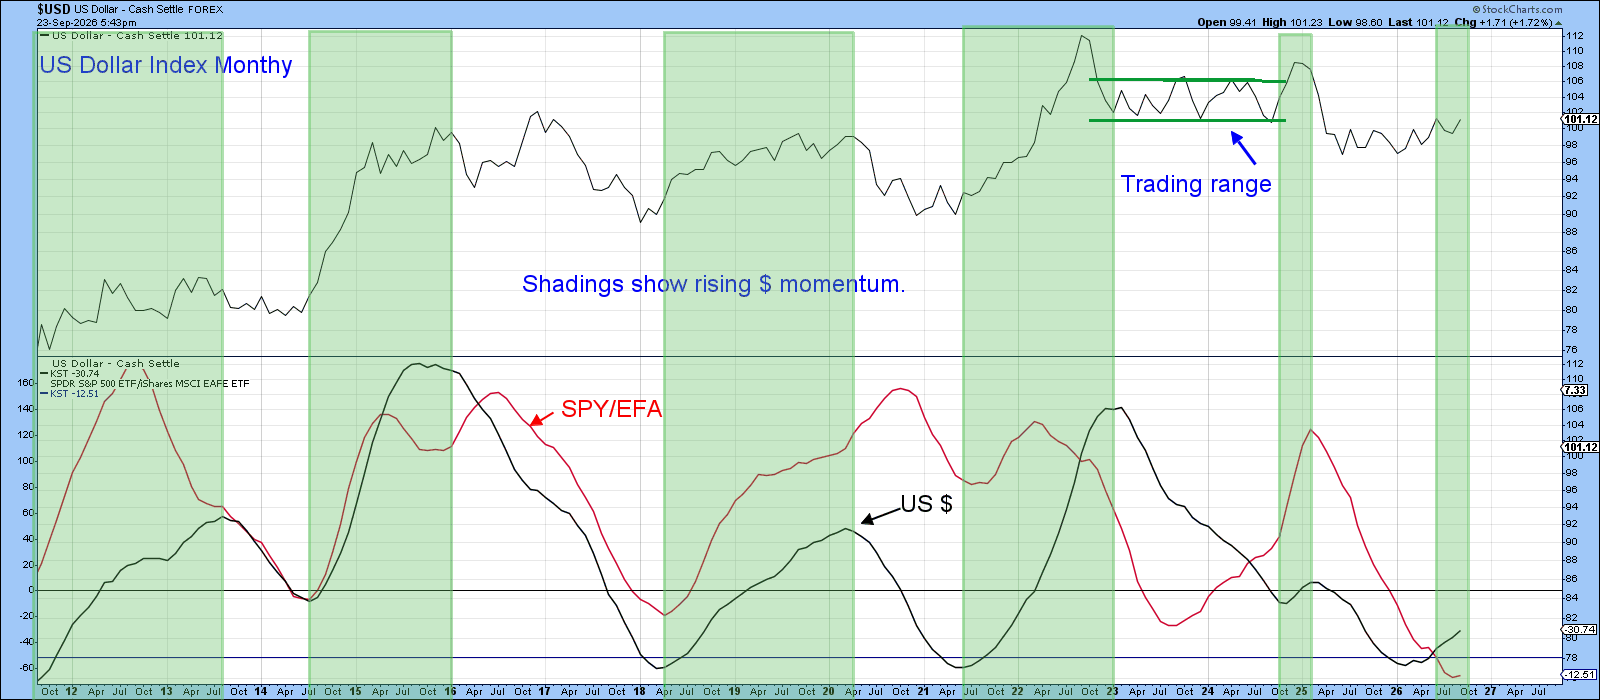
A strong U.S. stock market relative to the rest of the world is often interpreted as a sign of confidence in the U.S. economy and financial markets. As a result, it frequently moves in sympathy with the dollar.
In that respect, Chart 5 compares the momentum of the Dollar Index with that of the relative performance ratio between the S&P 500 ETF (SPY) and the iShares MSCI EAFE ETF (EFA). The shaded areas identify periods when the dollar's KST is rising. Note that the momentum of the SPY/EFA ratio, shown by the red line, has typically advanced at the same time, although there have been occasional and obvious divergences, underscoring the fact that this relationship is far from perfect. Even so, it’s encouraging that SPY/EFA momentum has recently begun to turn higher. While this development doesn’t guarantee further gains for the dollar, it suggests that the relative performance backdrop is currently aligned in a way that could support a continued advance in the Index.
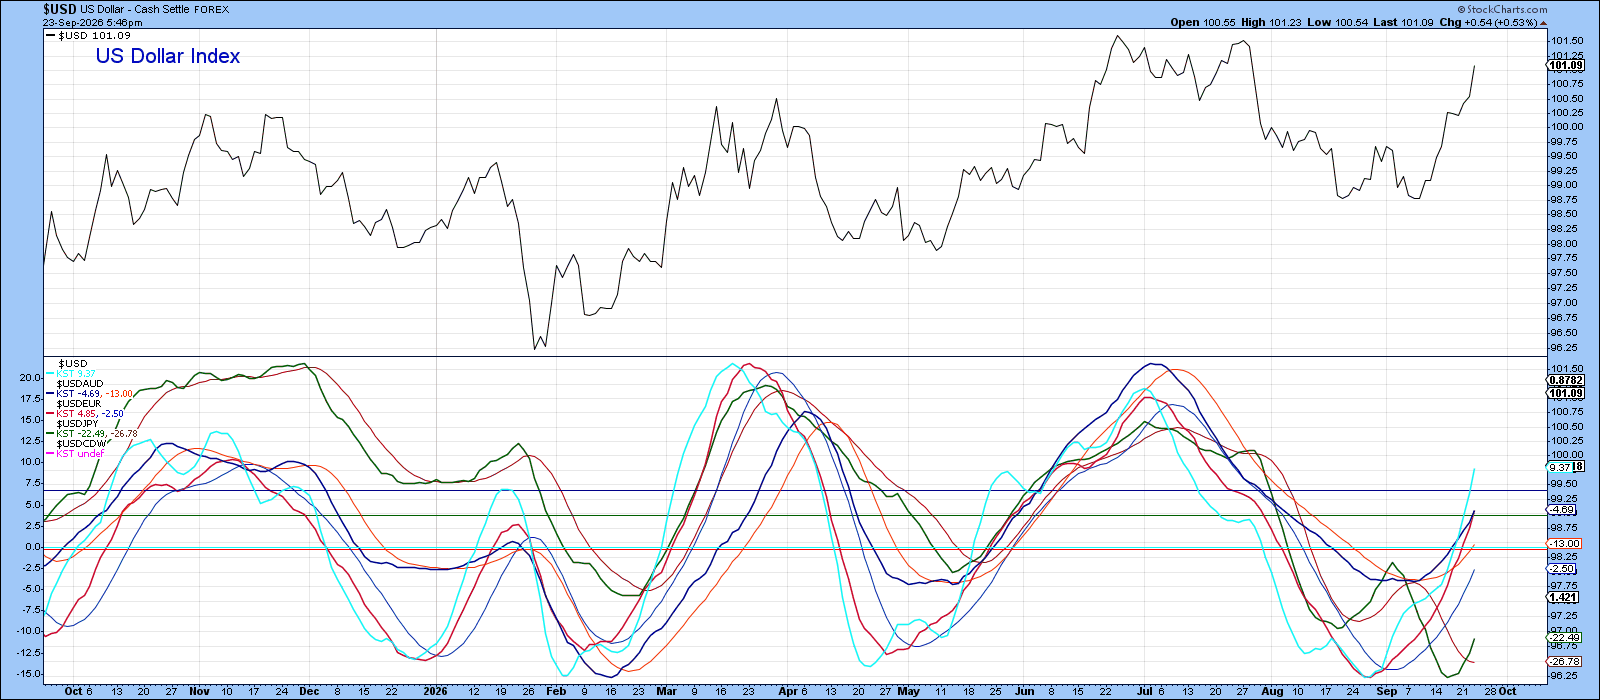
The Dollar Index is heavily weighted toward the euro and, in many respects, can be viewed as its reciprocal. However, Chart 6 broadens the analysis by displaying the short-term KSTs for several dollar-cross relationships rather than focusing solely on the euro. The encouraging feature is that all these KSTs are currently trending higher, indicating that the dollar's advance is broadly based rather than being driven by strength against a single currency. Equally important, none of the indicators appears particularly overextended at this stage. That suggests there’s still room for further gains and supports the view that the dollar's underlying tone is likely to remain firm over the near term.
The Bottom Line
The Dollar Index is making its sixth attempt to clear the psychologically important 100 level. This time, a favorable alignment of long-term trends, improving momentum, and broad participation suggests that the odds are tilted toward a successful breakout.
Good luck and good charting,
Martin J. Pring
The views expressed in this article are those of the author and do not necessarily reflect the position or opinion of Pring Turner Capital Group of Walnut Creek or its affiliates. The Six Stages of the Business Cycle are followed each month in Martin Pring’s Intermarket Review.