Meta Muse Meltdown in Financials: Is XLF’s Selloff a Buying Opportunity?

Key Takeaways
- Banks have been hammered: XLF is down 7% from its September high and has sharply lagged tech stocks.
- Key support is approaching: The $53–$54 zone aligns with the 200-day moving average, technical polarity, and heavy volume congestion.
- Q3 earnings are around the corner: JPMorgan kicks off bank earnings October 13, while oversold momentum and favorable seasonality offer potential XLF bullish-reversal catalysts.
We’re less than three weeks away from the Q3 earnings season. The big banks begin reporting July-through-September results on Tuesday, October 13. Price action within the Financials sector is always scrutinized leading into when JPMorgan Chase (JPM) kicks things off, and today it’s quite dreadful.
The Financials Select Sector SPDR ETF (XLF) is 7% below its September 3 high. Now, on its own, that’s by no means a collapse. On a relative basis, however, global banks and brokers have been taken to the woodshed, considering how well growth stocks have fared.
Blame it on Meta Muse, Moynihan?
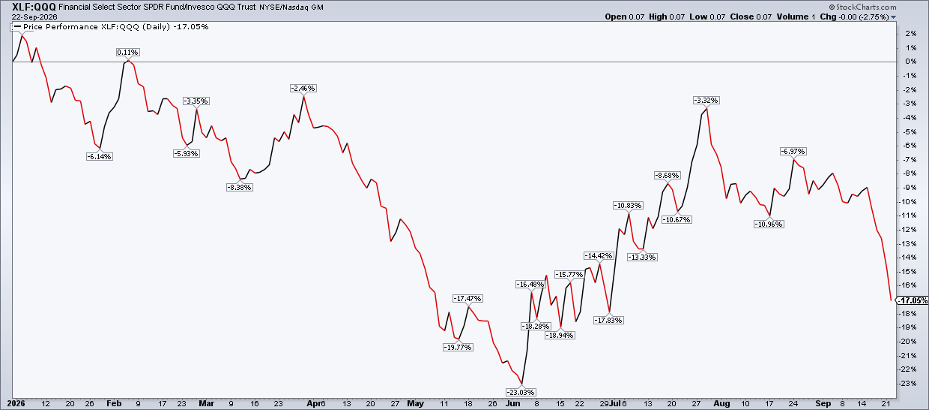
Amid Mag 7 strength, Financials has cratered versus the Nasdaq 100 ETF (QQQ) since September 15. XLF:QQQ tallied its worst six-day rout since the March 2023 Silicon Valley Bank crisis. The culprit for this week’s bank beating? Blame it on Meta Platforms (META) and its agentic AI app, Muse. Downloads have been historic, and public adoption contrasts with all the data-center disdain.
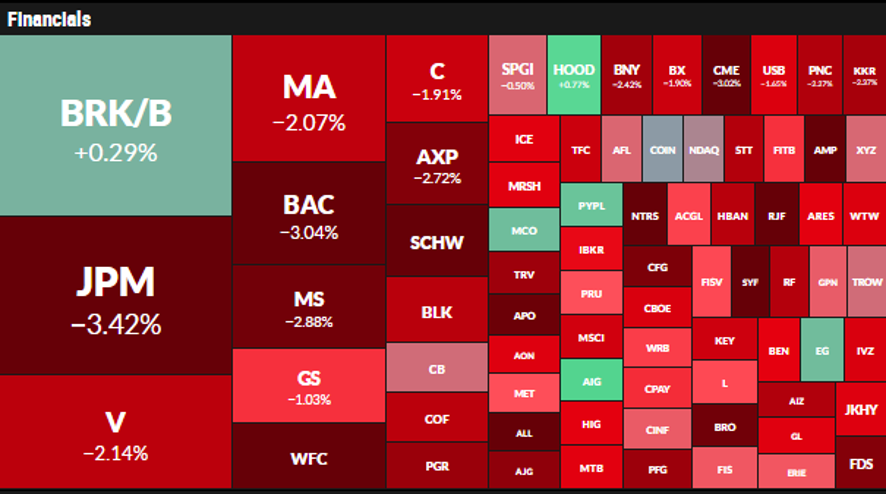
On Monday, META had one of its best non-earnings-reaction sessions since its 2012 IPO. Then, on Tuesday, names like JPM, Bank of America (BAC), Wells Fargo (WFC), Morgan Stanley (MS), and Charles Schwab (SCHW) were deep red on the StockCharts MarketCarpet. Even so-called “consumer inertia” stocks (such as Booking Holdings (BKNG), a possible DJIA replacement candidate for Nike (NKE)) were disrupted by the apparent success of Meta Muse.
Red on the screen came after cautionary comments the previous week by BofA CEO Brian Moynihan regarding its apparently sagging Q3 sales & trading revenue. Elsewhere, American Express (AXP) is among the worst Dow stocks on the year. Not great stuff.
Back to the Flat Line for Financials
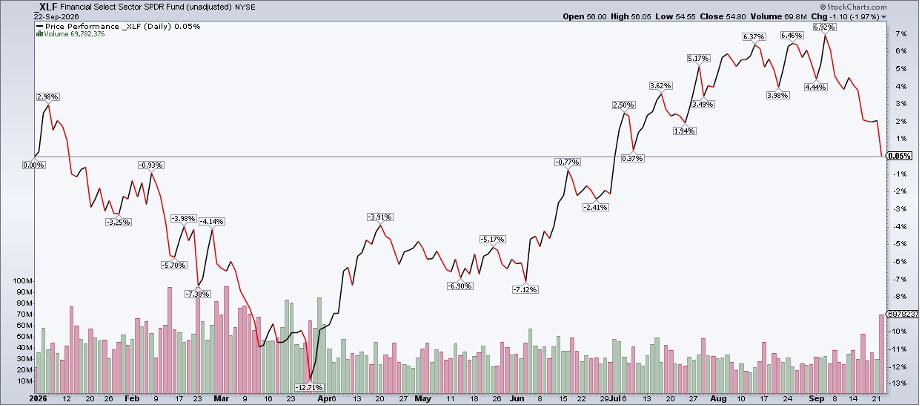
All told, for XLF, its YTD gains are gone. On a price-only basis, the ETF closed Tuesday up just 5 basis points for 2026 after peaking at +6.92% before Labor Day. I like to get granular with these data by applying the “price labels” to my SharpCharts. Volume was also huge on Tuesday, XLF’s most actively traded session since March 31. It’s a seemingly ominous setup with Q3 earnings just on the horizon.
Where will XLF go from here? Let’s allow the charts to be our guide.
Financials Sector: Technical Battleground in Play
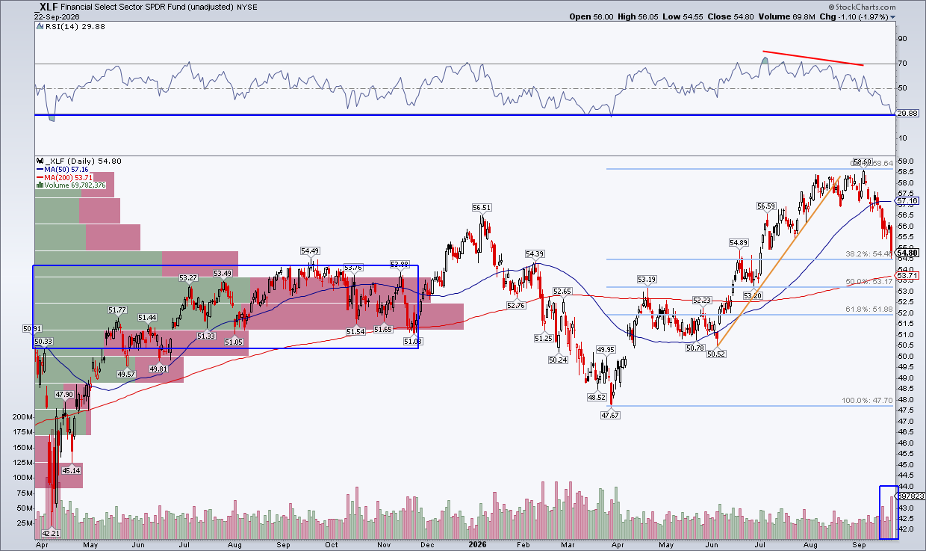
Notice in the chart below that XLF has already retraced 38.2% of the March-to-September rally. Now in a 7% drawdown and badly lagging the S&P 500, there could be a buying opportunity brewing. The long-term 200-day moving average remains on the rise, currently just 2% below Tuesday’s settle.
What’s more, there’s a solid confluence of support between $53 and $54. That’s not only where the 200-DMA comes into play, but also where XLF initially peaked in May and where buyers stepped up in late June (so there’s some polarity there).
Oversold, But Not Out
Also, look at the RSI momentum oscillator at the top of the SharpChart above. It tagged technical oversold conditions mid-week, the worst since the March low. I typically don’t see low RSIs as ideal buying setups, but this one came after XLF’s largest loss since late in Q1 and on a day where the bulls controlled almost the entire session (opening on the high, closing near the low). The RSI plunge comes after bearish divergence to price that played out over the summer; often, momentum inflects before price, and that absolutely happened with XLF.
Another support signal? The volume-by-price indicator on the left side of the chart. XLF has fallen into a high-congestion area in the low-to-mid $50s. The presumption is that previous buying and selling activity will cushion the downturn, despite a clear break of the Q2–Q3 uptrend.
Yield Curve 101
Traders must also monitor intermarket trends. As the Fed moved to hike its policy rate in mid-September, the key 2-year/10-year yield spread had compressed to just 20 basis points earlier in the week. True, banks do much more than borrow short and lend long, but this old-school Wall Street gauge has deteriorated for money-center banks since the middle of Q1. There are also fundamental fears over weaker capital markets (particularly if frontier AI is indeed paced), while the IPO market has suddenly cooled.
Price leads narrative, of course, so, if XLF bounces off support, it may indicate improvement on these fronts.
Q4 Calendar Tailwinds
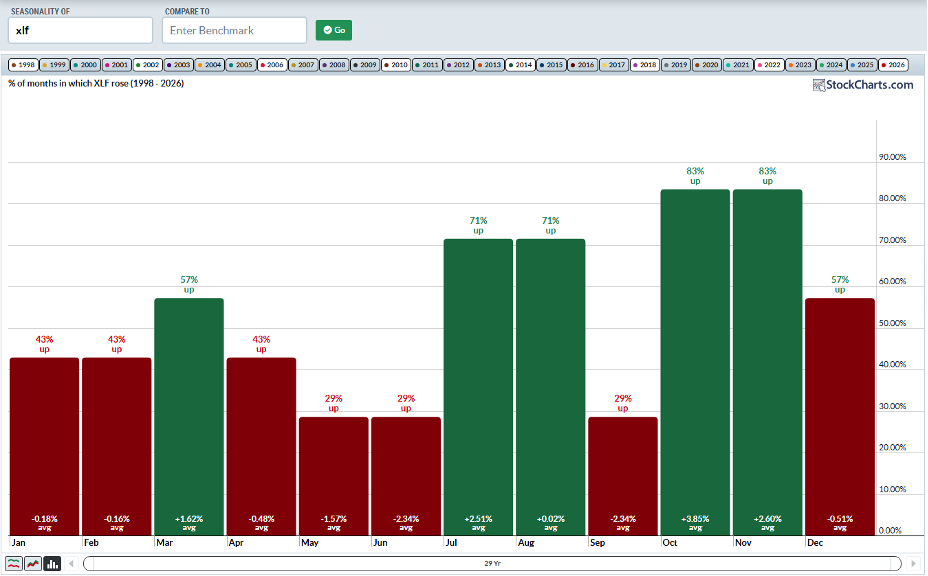
Seasonality augurs for a sanguine stance soon. Since 1998, XLF has climbed an average of more than 5% over the October through December stretch, up almost 70% of the time each month.
StockCharts’ new tool allows you to select specific years and, if we only apply midterm years, October & November gains are downright gaudy: October +3.85%, up 83% of the time; November +2.6%, with an 83% positivity rate. December is mixed.
The Bottom Line
Financials has quickly fallen out of favor. The cyclical-value sector is back to flat YTD, losing major ground to tech stocks just since mid-month. I see the dip as buyable. It might not be quite as dramatic as the Q1 SaaSpocalypse, but there are parallels. Watch that XLF Fibo level and the 200-DMA leading into the big October 13 earnings date.
Want to know what’s really moving Financials? Head to the Symbol Summary for XLF > Profile and break down its Top 10 Holdings in seconds.
Disclaimer: This blog is for educational purposes only and should not be construed as financial advice. The ideas and strategies should never be used without first assessing your own personal and financial situation, or without consulting a financial professional.