StockCharts Insider: Find Strong Dividend Stocks (and Avoid the Traps) With a Fundamental and Technical Edge
Before We Dive In…
Here’s a trick some of you might know. Sort a list of dividend stocks by yield, and most of the names on top are the ones you want to avoid. Not all, but most. Think of it like a restaurant that slashed its menu prices by half. It’s either a promo bargain or a warning about the business itself.
If you don’t know how this works, I’ll explain it. Dividend yield is a fraction. So when a stock’s price plummets, the yield goes up. If it’s in freefall, the yield looks even more attractive. That is, until the company decides to slash or eliminate its dividend altogether.
Green light, red light
Most dividend articles tell you what to look for on the balance sheet, and for good reason. Strong numbers tell you what a company can afford to keep paying. But the numbers can’t tell you if investors are quietly heading for the exits, anticipating a negative that’s not yet on paper. The reverse can happen too. Investors can rush into a stock whose underlying business is on shaky ground.
Fundamentals and technicals are different beasts despite their similar aims. My opinion? It helps to have both working in your favor.
Seeking a technical and fundamental advantage
Here are the criteria we’re going to use to get an advantage in both areas.
- Fundamentals: Dividend Growth, P/E, Price to Free Cash Flow, Debt to Equity, Return on Invested Capital, and EPS Growth.
- Technicals: 50-day simple moving average, 200-day simple moving average, SCTR, RSI, and RRG quadrants.
Lots of filters, yes. But the logic’s pretty sound once you combine them.
Insider Tip #1: Estimate the payout: There’s no payout filter on StockCharts, but you can easily estimate it. Multiply the dividend yield by the P/E ratio. If a stock yields 3% and the P/E is 15, the payout is around 45% (0.03 x 15 = 0.45).
1 - Dividend traps
Plenty of articles tell you to avoid “dividend traps,” but few demonstrate it. So, that’s what I'm going to do—create a list of dividend stocks to avoid.
Let’s use the following screen filters to find weak stocks paying over 5% in dividends.
Fundamentals (failing):
- Dividend: Over 5%
- EPS Growth (TTM): Negative
Technicals (failing):
- 200-Day Simple Moving Average: Price Below
- Price Performance: Down -20% Past 1 Year
I came up with 20 dividend trap stocks to avoid. Here are the first two rows. I’m displaying them on CandleGlance so that you can get a visual.
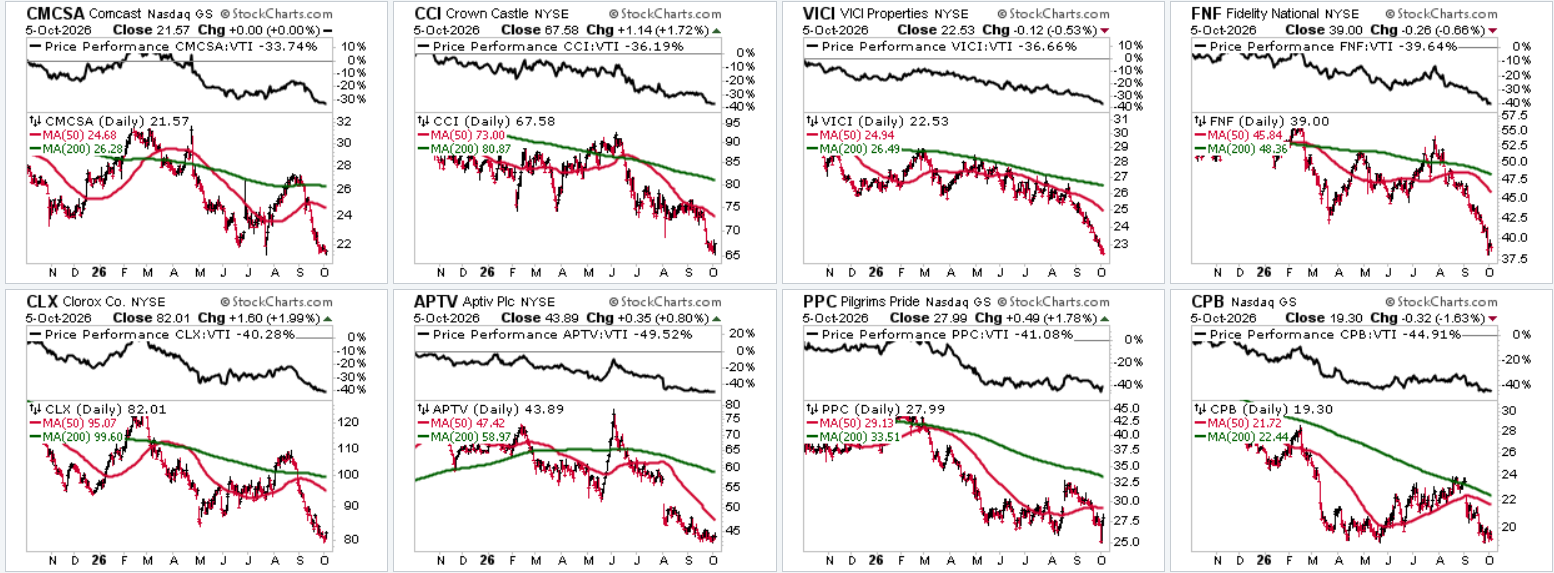
CandleGlance of dividend trap stocks.
Let’s think about these names for a second. They all offer high yields. But their earnings are shrinking and their prices appear to be in freefall. In short, they look ripe for a dividend cut. Investors are abandoning these stocks, which is probably why the dividend yields are rising.
Run this screen and see if any of the stocks on your watchlist show up. If so, you might want to take a closer look, or reconsider.
But are all of these names doomed? Not necessarily. Some companies may turn things around. But you’ll want to wait for confirmation on the chart and on paper (balance sheet).
Now, let’s reverse our criteria to find some strong dividend stocks.
2 - Sustainable income stocks
This is the opposite of the dividend trap example—it’s boring. It’s steady. Maybe that’s what you’re looking for?
Fundamentals:
- Index Membership: S&P 500
- Dividend: 2% – 5%
- Dividend Growth: Positive
- P/E (TTM): 10 – 20
- Price to Free Cash Flow: Under 20
Technicals:
- 200-Day Simple Moving Average: Price Above
The logic behind this is pretty simple. The yield and P/E ranges cap the implied payout at around 100%, weeding out companies paying out more than they earn.
Price to Free Cash Flow under 20 tells you that the company generates more free cash per share than it pays in dividends.
The 200-day filter indicates that the stock may be in a healthy technical range (as the saying goes, nothing good happens under the 200-day SMA).
So, let’s take a look. When I ran this screen, it returned 19 stocks. Here are the ones with the strongest SCTR readings.
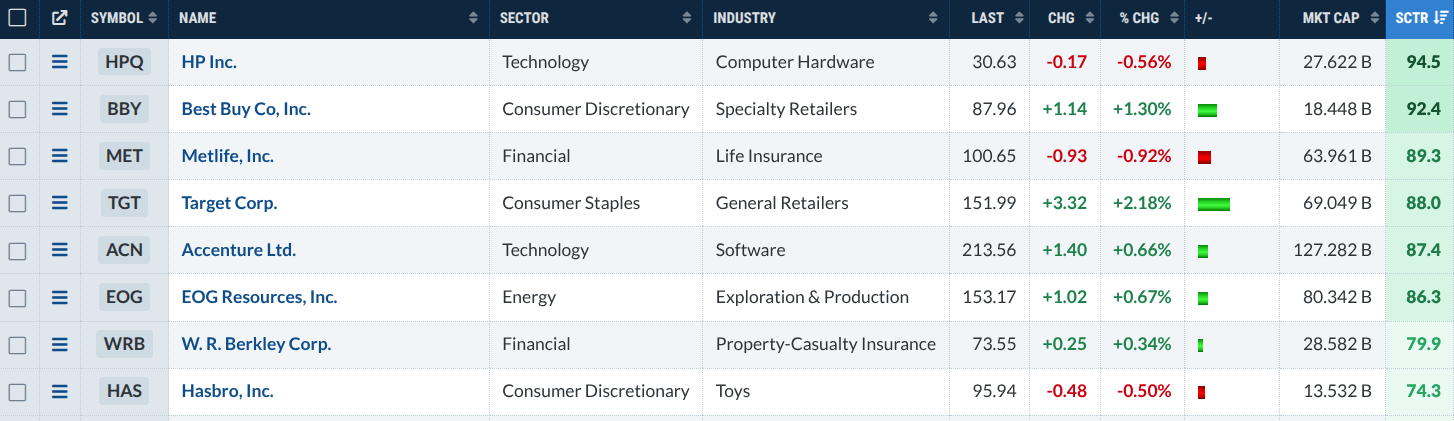
List of top 8 Screener results for sustainable income stocks.
The list is sorted by SCTR, from highest to lowest. That tells you a lot about technical strength, but not much about whether the setup is right for an entry. For that, you’ll want to pull up each chart.
For example, without diving into this too deeply, take a look at Target Corp. (TGT), the fourth on the list.
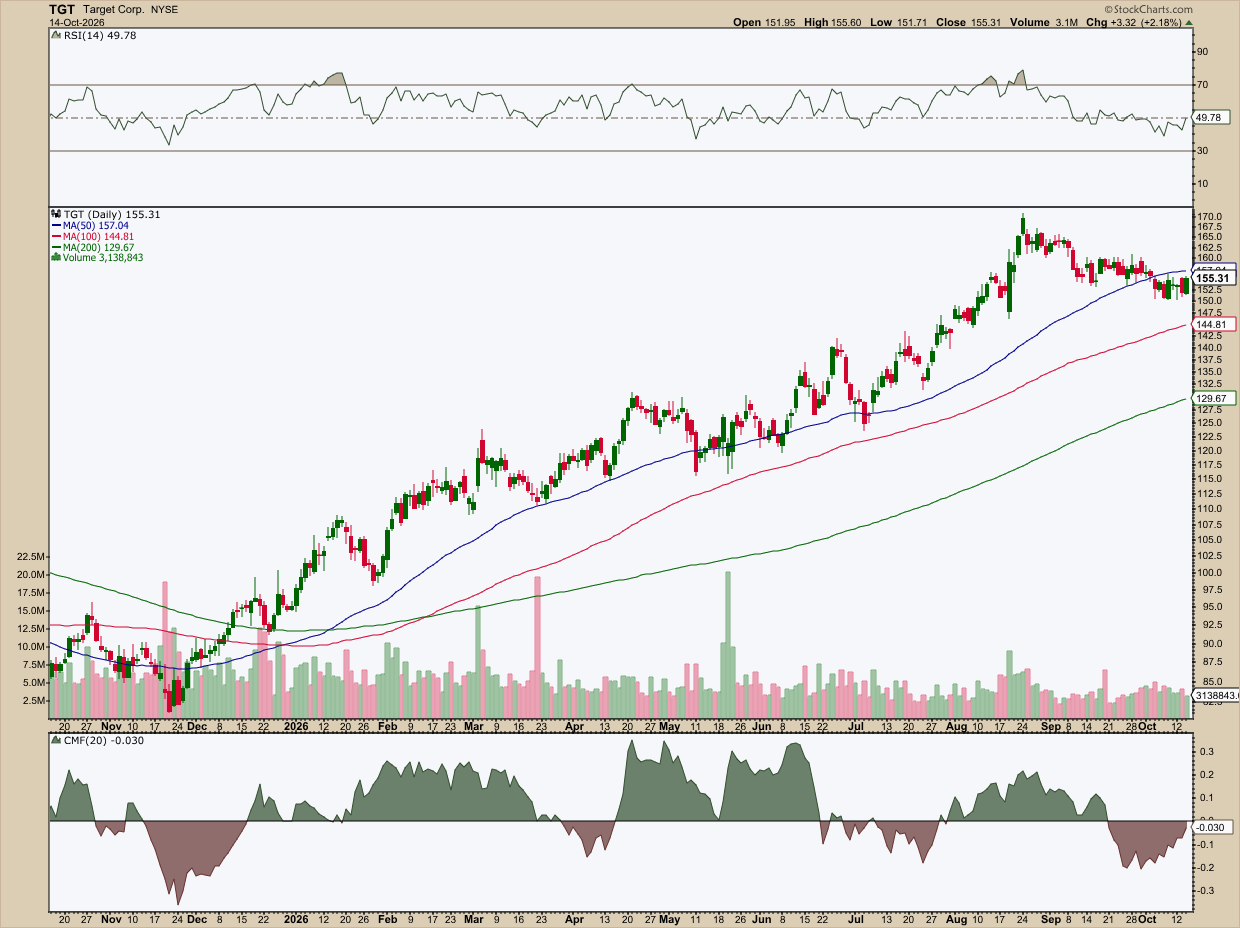
Daily chart of TGT.
Momentum seems to be waning, and the Relative Strength Index (RSI) confirms what price is displaying so clearly. But the trend appears strong and intact. The money flow is negative, according to the Chaikin Money Flow (CMF), but the selling pressure appears to be fading. Price is in tight consolidation right under the 50-day simple moving average (SMA).
Is TGT (or stocks with this kind of chart profile) a strong buy candidate? Also, do you want to be in Consumer Staples right now? Here’s where you might consult the RRG charts to get a picture of how sectors are rotating (for TGT, its sector proxy is XLP).
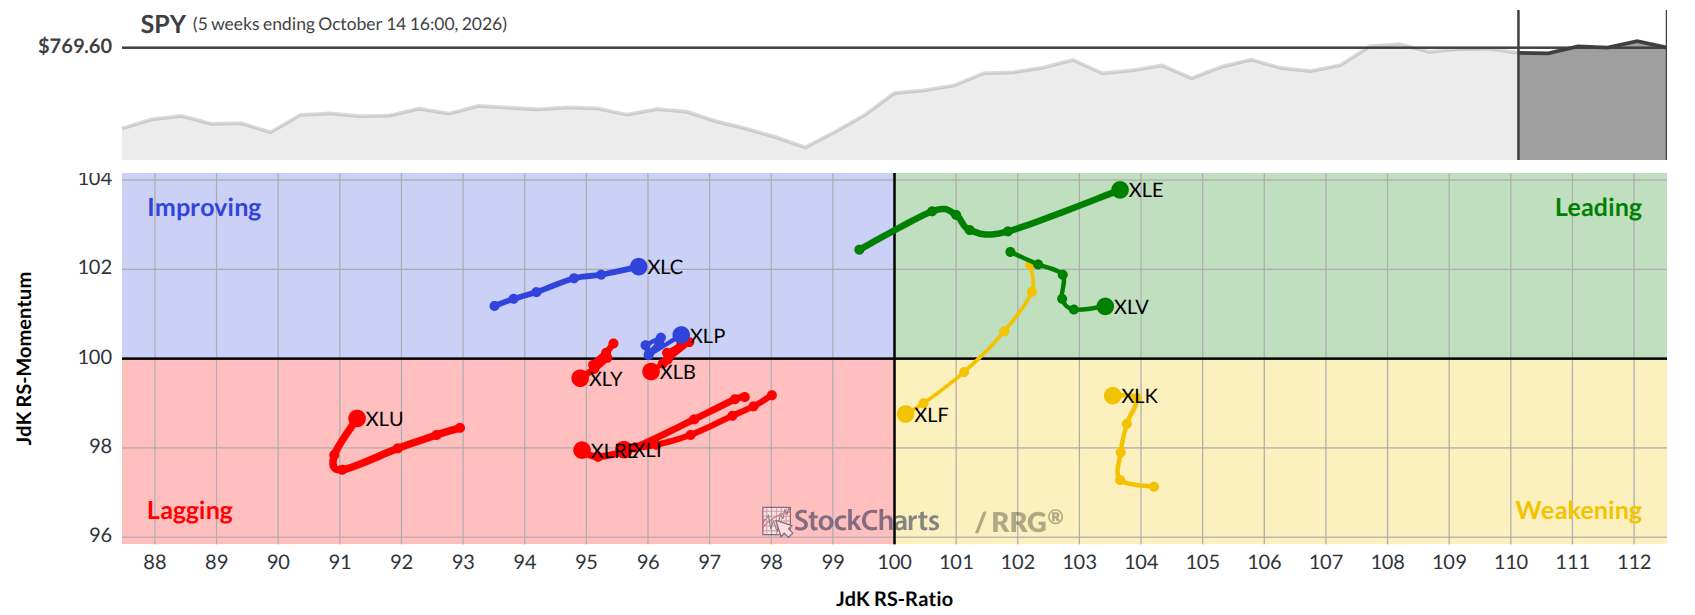
RRG chart of S&P 500 sector ETFs. Look at XLP (Staples) and XLK (Tech) which we’ll use in our next example.
Fifth on our list is Accenture (ACN), an IT consulting firm. The reason I chose ACN over HP Inc. (HPQ), which is first on our list, is to show the notable differences between the results (HPQ’s chart is similar to TGT).
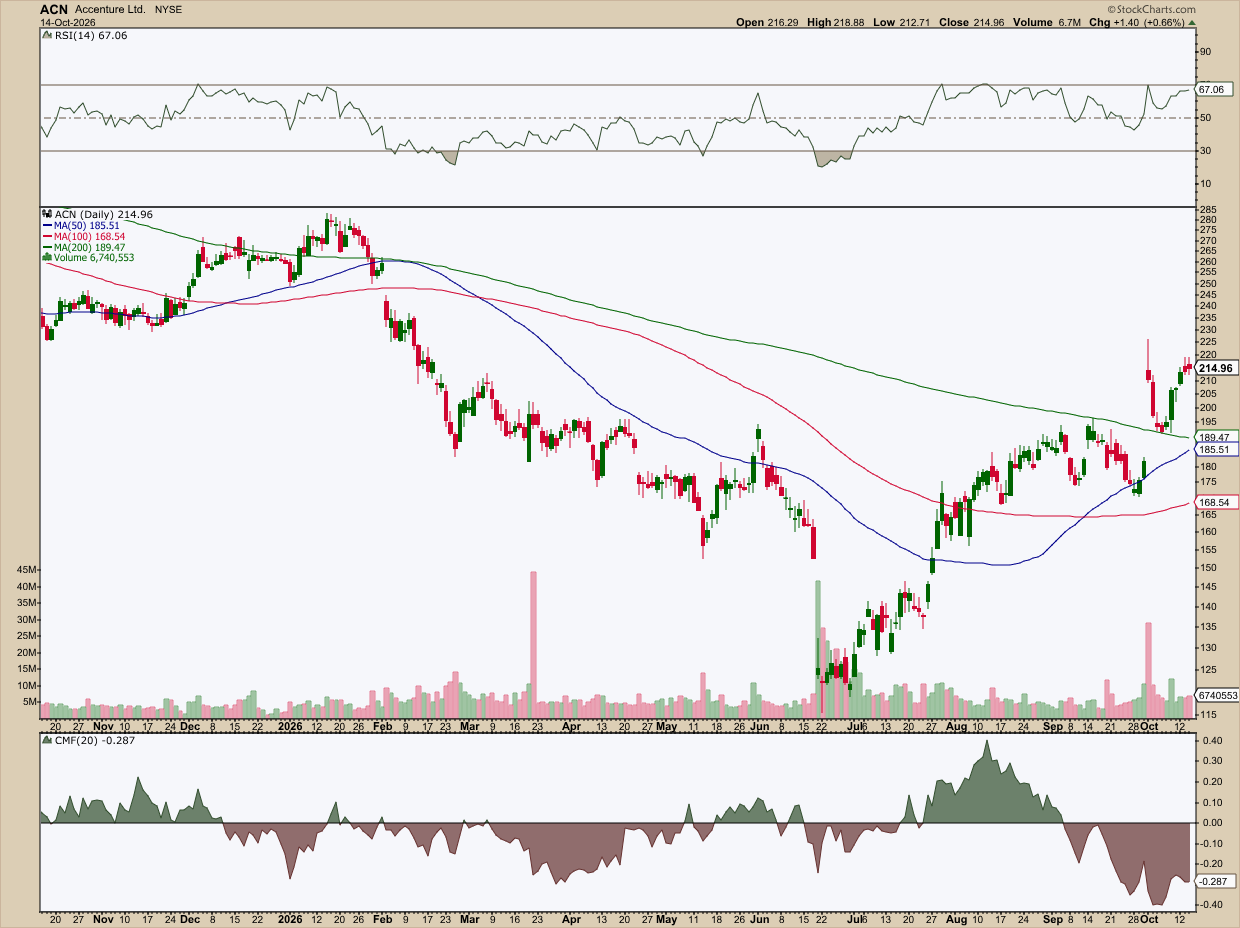
Daily chart of ACN.
Again, without going into too great a detail, let’s just compare this to our previous TGT example. ACN has seen a sharp rise since its July bottom. It recently clawed its way above the 200-day SMA, which is part of our criteria. The RSI has been solidly in a bullish range. But the CMF is still deeply negative, though it’s also a lagging indicator.
Also, the Tech sector has generally been weakening, whereas Staples has been steadily improving. So, which one might make the favorable buy? Each investor will have a different answer.
Insider Tip #2: Run a debt filter on the scan, not the Screener: Why aren’t you seeing a Debt to Equity filter here? Because the loosest setting is “Under 1.0,” and when I added it, the results dropped to zero. Many dividend payers carry a ratio above 1.0. One reason has to do with stock buybacks. When a company buys back its own shares, equity on the books shrinks. That pushes up the debt-to-equity ratio even if the debt itself hasn’t changed. One practical cap for dividend stocks is under 2.0. The Screener doesn’t have that. So, convert your screen to a scan and set Debt to Equity under 2.0 manually.
But even without a debt filter, the screen is tight, so you’ll get a smaller list of names, which is what we want.
3 - Fast-Growing Dividend Payers with Momentum
The last screen looks for steady dividend stocks. This one looks for companies that are accelerating: those raising their dividends rapidly, backed by growing earnings, and possibly leading the market. Some may be new dividend payers. Others are veterans that are picking up speed, technically and fundamentally. Let’s see what the following filters give us.
Fundamentals:
- Dividend: Over 1%
- Dividend Growth: Over 10%
- EPS Growth (Past 5 Years): Over 10%
- Return on Invested Capital: Over 10%
Technicals:
- SCTR Value: Above 60
- 50-Day Simple Moving Average: Above 200-Day SMA
When I ran this screen, it returned seven stocks.

Screener results for the fast-growing dividend payer profile.
Not all of these are going to be great picks. It’s a good starting point, but you have to chart and sort them out yourself.
Also, some stocks appear favorable for dividends, but you’ll have to wait for a better entry scenario. For instance, the largest company on the list, and the one with the highest SCTR score, is Automatic Data Processing, Inc. (ADP). The Symbol Summary page shows you its dividend (and other fundamental) info.
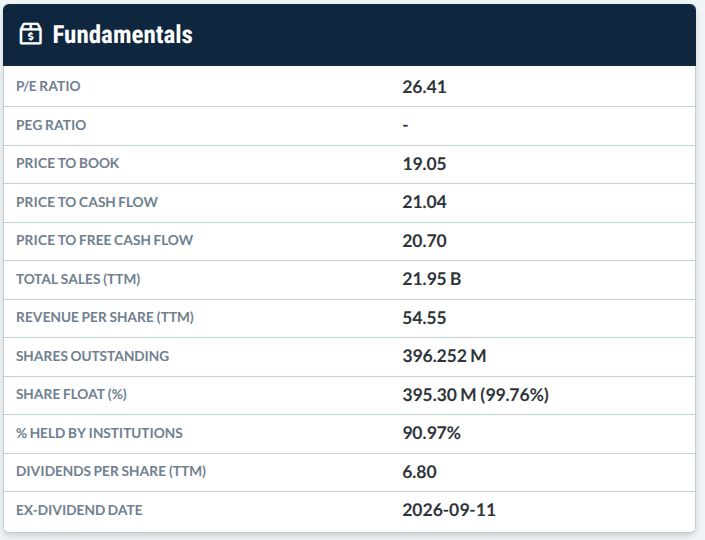
Would you hold this as a longer-term component in your portfolio?
Well, let’s take a look at the chart.
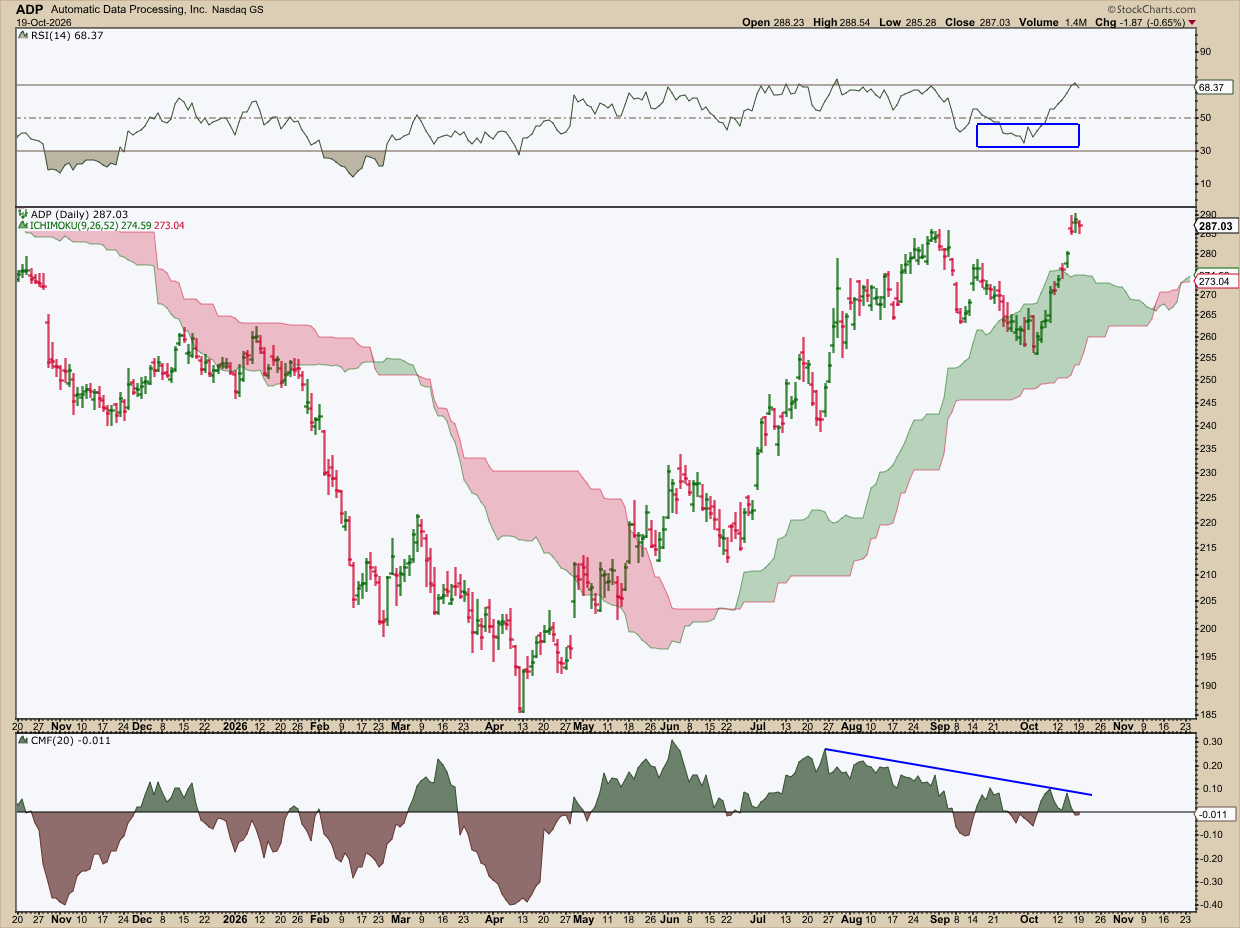
Daily chart of ADP.
The Relative Strength Index (RSI) shows a very slight stall in momentum highlighted by the blue circle. Going down to the actual price chart, I used the Ichimoku Cloud as it better outlines ADP’s trend profile in addition to suggesting where future support may sit.
Notice how prices rose above the Ichimoku Cloud as the Chaikin Money Flow (CMF) broke above the zero line, signaling that buyers took control of the market. But note that buying pressure has also begun fizzling.
So, is ADP topping, undergoing a more protracted time correction, or is it going to break above $290 and stay there? It’s hard to tell at the moment. If this is a long-term dividend play, and if you’re impatient to get in, you’d have to just adjust your position size knowing that if it undergoes a deeper price correction, you will be taking a drawdown.
Again, some Screener results will give you an immediate setup while others will give you a few good prospects that aren’t immediate buys.
And That’s a Wrap
Remember that half-price menu analogy we started with? Now you know how to tell whether it’s a genuine bargain or a red flag. You can rule out the traps. From there, all you have to do is decide whether you’re looking for a steadier and perhaps more boring income source, or whether you’re after a fast-growing dividend generator. Just bear in mind a list isn’t a reason to take action just yet. There’s work to put in. So, open the Screener, try (or even tweak) a few of the ones I suggested, and chart the results. Save the ones that best fit your strategy.
Disclaimer: This article is for educational purposes only, not investment advice.