Election Uncertainty Is Shaking Stocks: Is Your Portfolio Prepared?
Key Takeaways
- The Nasdaq and S&P 500 are under pressure as uncertainty keeps investors on edge.
- Technology stocks are struggling, but strength in other sectors suggests investors aren't abandoning stocks.
- Watch key support levels, volatility, and signs of a bullish reversal before making portfolio adjustments.
Monday was another rough session for technology stocks. The Nasdaq Composite ($COMPQ) closed below Friday’s low, putting it within striking distance of its 200-day simple moving average (SMA). The S&P 500 ($SPX) also lost ground, closing below the first key support level on my chart (see below).
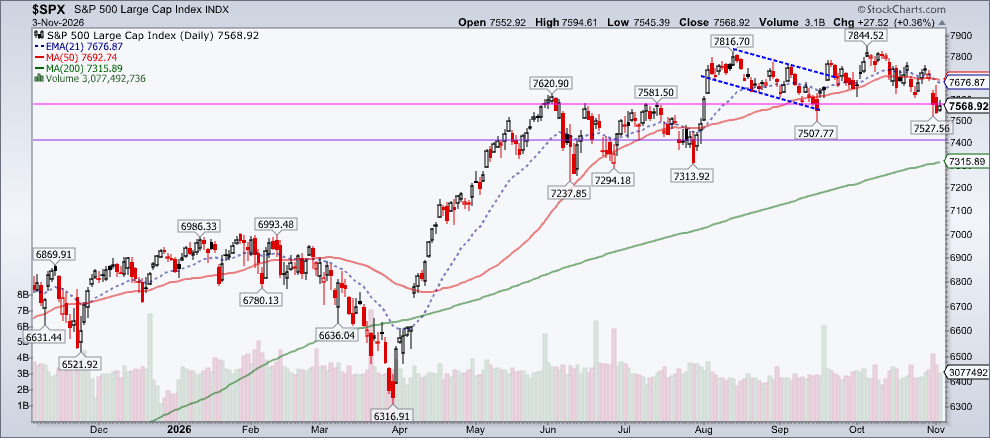
With the midterm elections dominating the headlines, it’s no surprise that we’ve seen choppy price action. But, considering the uncertainty, stocks are holding up relatively well.
How Should Investors Navigate This Uncertainty?
After the sharp selloff in technology stocks late last week and into Monday, chip stocks managed a modest rebound on Tuesday. That isn’t surprising given how far some of them had fallen. Technology was Tuesday’s best-performing sector, followed by Communication Services and Industrials. It’s an encouraging signal, but one day’s strength doesn’t mean the selling is over.
In the days leading up to the midterm election, investors had been rotating into more defensive sectors of the market, leaving Technology on the sidelines. This is worth watching because mega-cap technology stocks have led the stock market higher.
If the major indexes resume their bullish trend, there’s a good chance these heavyweight stocks will lead the charge again. If leadership shifts to other sectors, it would be a sign of broader market participation. But this alone isn’t a guarantee of a powerful rally. WE still need to see sustained buying and improving price trends.
Below the Surface
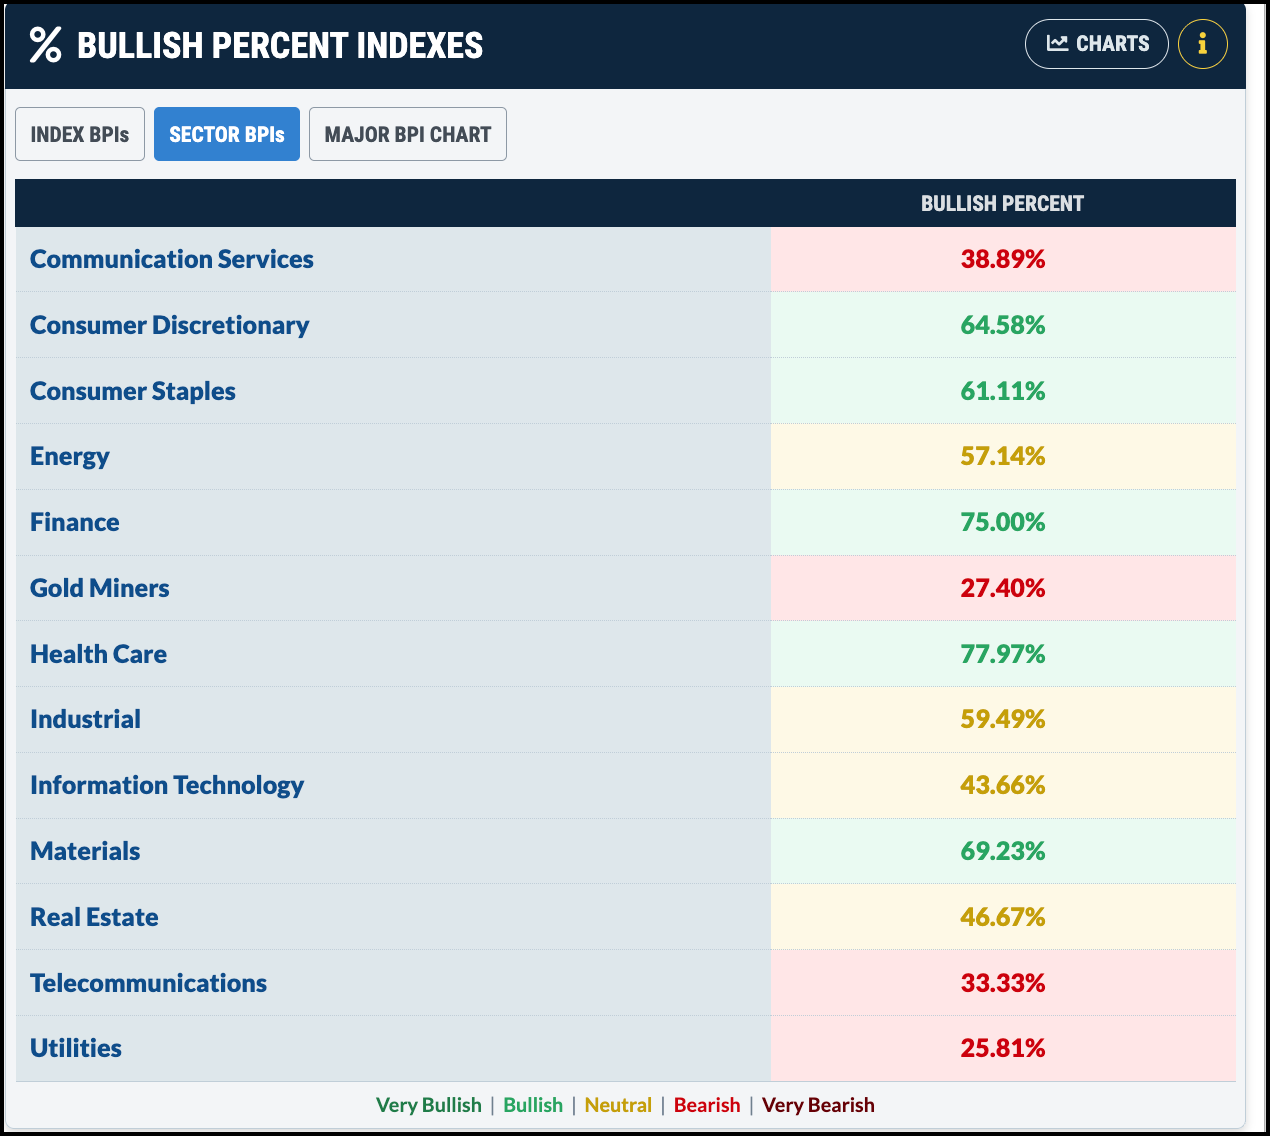
One way to get a sense of what’s happening beneath the surface is to look at the Bullish Percent Indexes (BPI) panel on the StockCharts Market Summary page. Right now, the indicator shows bullish readings for Consumer Discretionary, Consumer Staples, Financials, Health Care, and Materials with bullish BPIs. Technology, meanwhile, remains neutral.
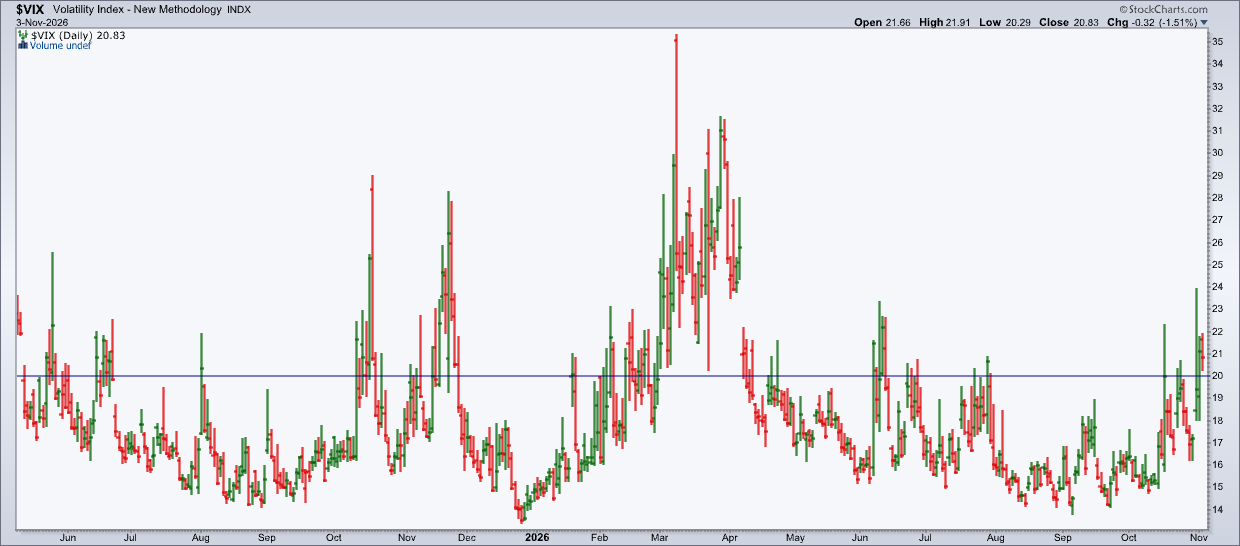
So far, we’re not seeing signs of widespread panic selling. This suggests investors haven’t lost confidence in the market or economy. The Cboe Volatility Index ($VIX) has been climbing and recently moved above 20. If volatility settles down after the election results are known and the VIX drops back below 20, it could set the stage for another move higher in stocks.
Looking Ahead
The election isn’t the only event investors need to think about. We still have plenty of earnings and economic data ahead, including jobs reports and ISM surveys. Any of these could influence the market’s next move, especially if they support an interest rate hike when the Fed meets next. According to the CME FedWatch Tool, the probability of a quarter-percentage-point rate hike is currently around 79%. These probabilities can be affected when new economic data comes in.
While events such as elections, earnings, and Fed meetings may not change the market’s longer-term trend, they can shake things up in the short term. That’s why, even if you’re a long-term investor, it pays to stay engaged with the market. You don’t need to react to every headline or market swing, but you should know where your key support levels are and what might prompt you to make portfolio adjustments.
QQQ Approaching Critical Technical Level
One chart I’ll be watching closely is the Invesco QQQ Trust (QQQ), which is trading near its 200-day SMA.
The Relative Strength Index (RSI) is above 30, and the Percentage Price Oscillator (PPO) is in negative territory. More importantly, the price chart shows a series of lower highs and lower lows. This needs to change for the uptrend to resume.
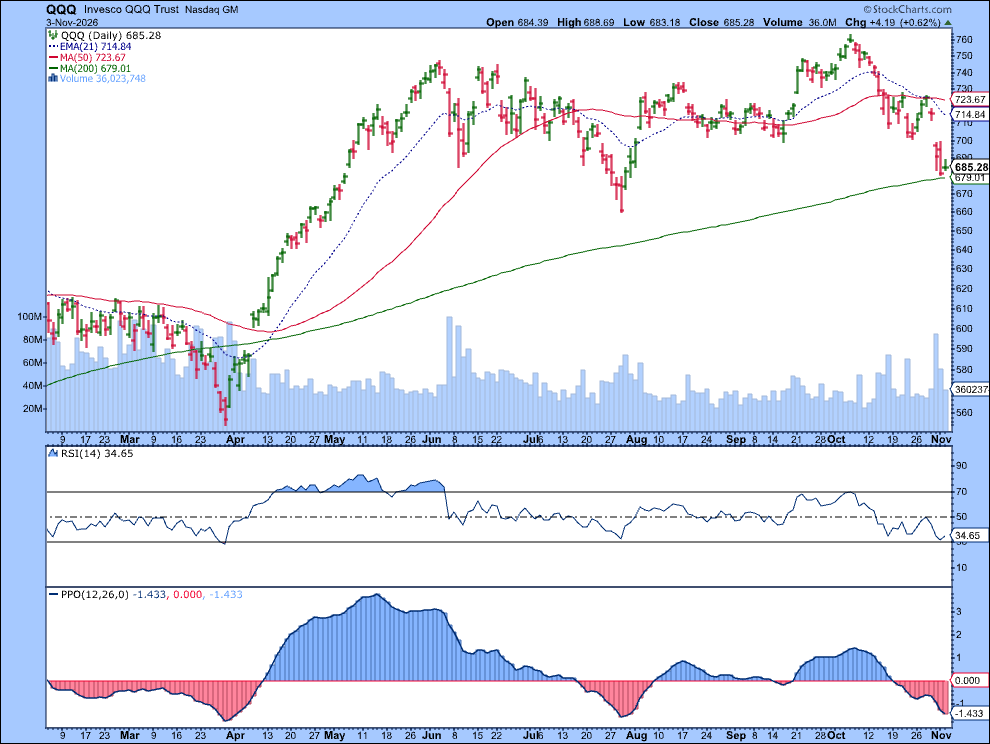
My focus after the election will be on how QQQ reacts to its 200-day SMA. A break below that level could signal further weakness in the Technology sector, and potentially open the door for QQQ to test its July low.
On the other hand, if buyers step in and QQQ bounces off the 200-day SMA and reverses, it would be an encouraging first step. In this scenario, the 21-day exponential moving average (EMA) needs to move back above the 50-day SMA, and we should see a series of higher highs and higher lows begin to take shape. All of these would be strong indications of buyers stepping in; until then, though, I’d be cautious about assuming the worst is over.
The Bottom Line
Nobody knows where the stock market is headed next. With election results, economic reports, and interest rate expectations in play, predicting every twist and turn is a losing game. Instead, watch how the major indexes behave around key support levels and whether technology stocks are regaining leadership.
Hopefully, you won’t need to make major changes to your portfolio. With the market at key levels, however, you’ll need to have a plan in place if the price action suggests you need to make any adjustments.
Disclaimer: This blog is for educational purposes only and should not be construed as financial advice. The ideas and strategies should never be used without first assessing your own personal and financial situation, or without consulting a financial professional.