StockCharts Insider: Gold, Silver, and Bitcoin — The Best (and Worst) Months to Own Each
Before We Dive In…
Gold, silver, and Bitcoin are three entirely different assets. Gold’s a monetary metal. Silver’s a hybrid of monetary and industrial. Bitcoin’s a volatile crypto that somehow earned its street cred as digital gold. Yet they've lumped together under the “safe-haven” pile.
All three tend to get pulled by the same forces, namely geopolitics, monetary conditions, and, to some degree, industrial cycles. They move at different schedules throughout the year. But, despite short-term catalysts, have they exhibited seasonal tendencies? If so, it might help to get some historical context, especially if you’re looking to buy or unload. It’s a simple investigation, looking into standalone seasonality and relative seasonality against the S&P 500. So let’s take a look at the calendar.
Gold Seasonality from 2004 - 2026
We’re going to look at SPDR Gold Shares (GLD) as our spot gold proxy. A lookback of 22 years smooths out the more recent gold accumulation surge among global central banks since 2020. But that’s okay. We want to get a sense of gold’s rhythm across a wider timeframe. That includes the latter-end buying spree.
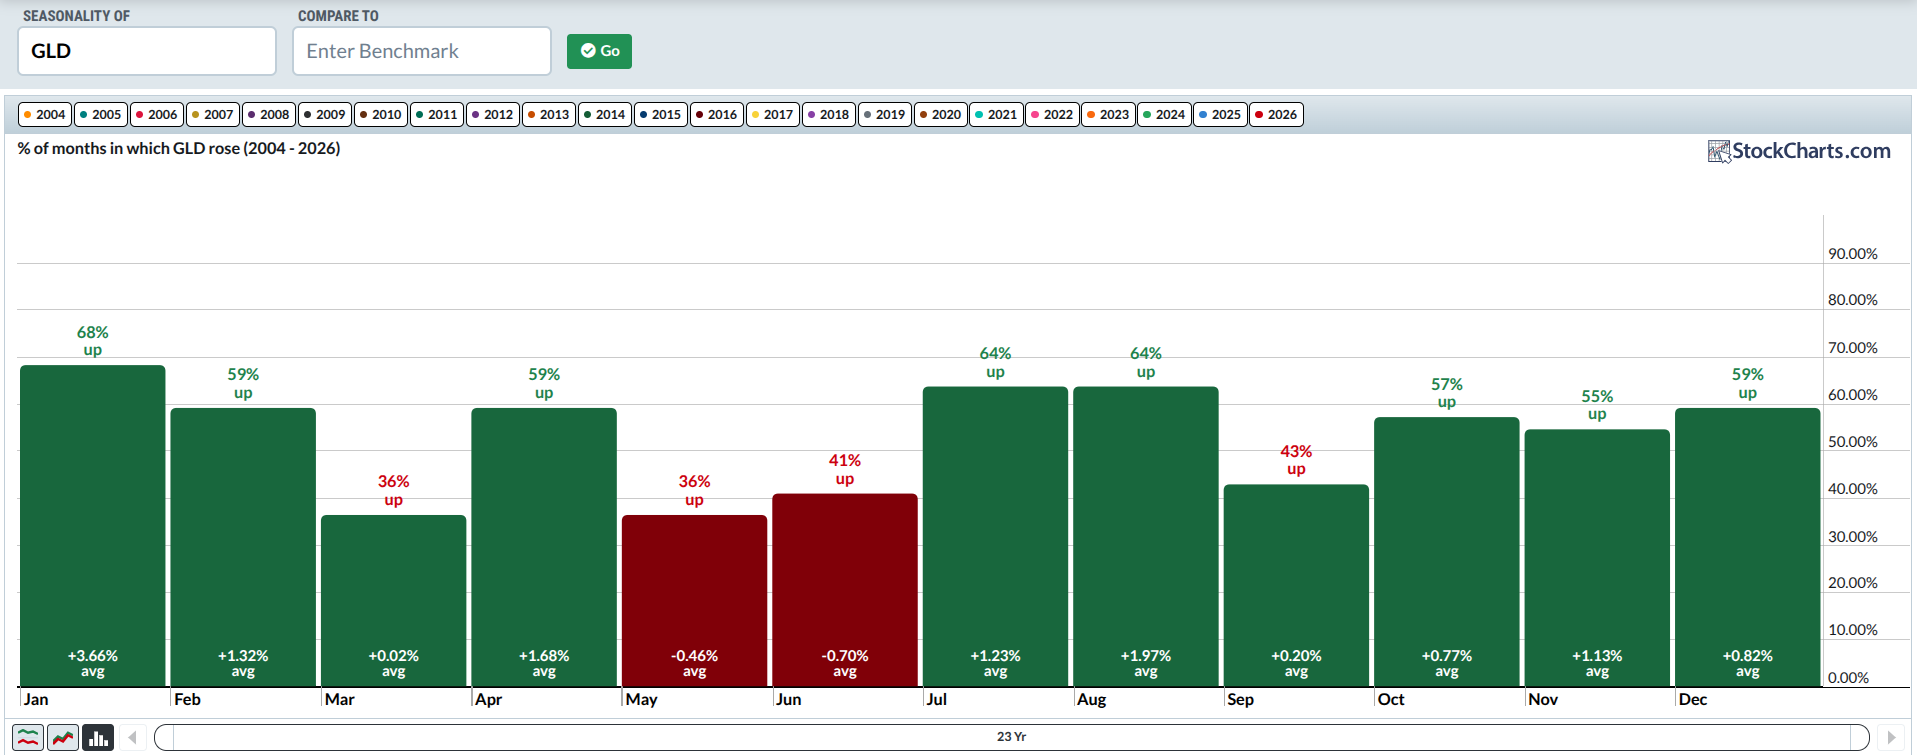
If you wish, follow along with the Seasonality chart. BTW, I’m writing this on the last day of August 2026. So, the September through December data reflects patterns held through 2025 (as those months haven’t happened yet).
According to this calendar, January has been the strongest seasonal month for GLD, with 68% average up days and 3.66% average gain. While July and August both come in second in terms of up days (64%), August’s return of nearly 2% comes in second. July’s return trails February and April.
Insider Tip #1: Know when history is weighted vs. smoothed out. The 22-year period will average out the most recent gold buying by central banks. In this case, that’s what we want. We don’t want recent activity to skew the larger pattern. But there may be times when you’ll want to see it skewed. So, just know the difference.
But how do these returns compare against the S&P? Let’s take a look at relative seasonality compared to SPDR S&P 500 ETF (SPY). Bear in mind, we’re comparing ETF against ETF instead of spot to index. This means expenses and, for SPY, dividends are involved.
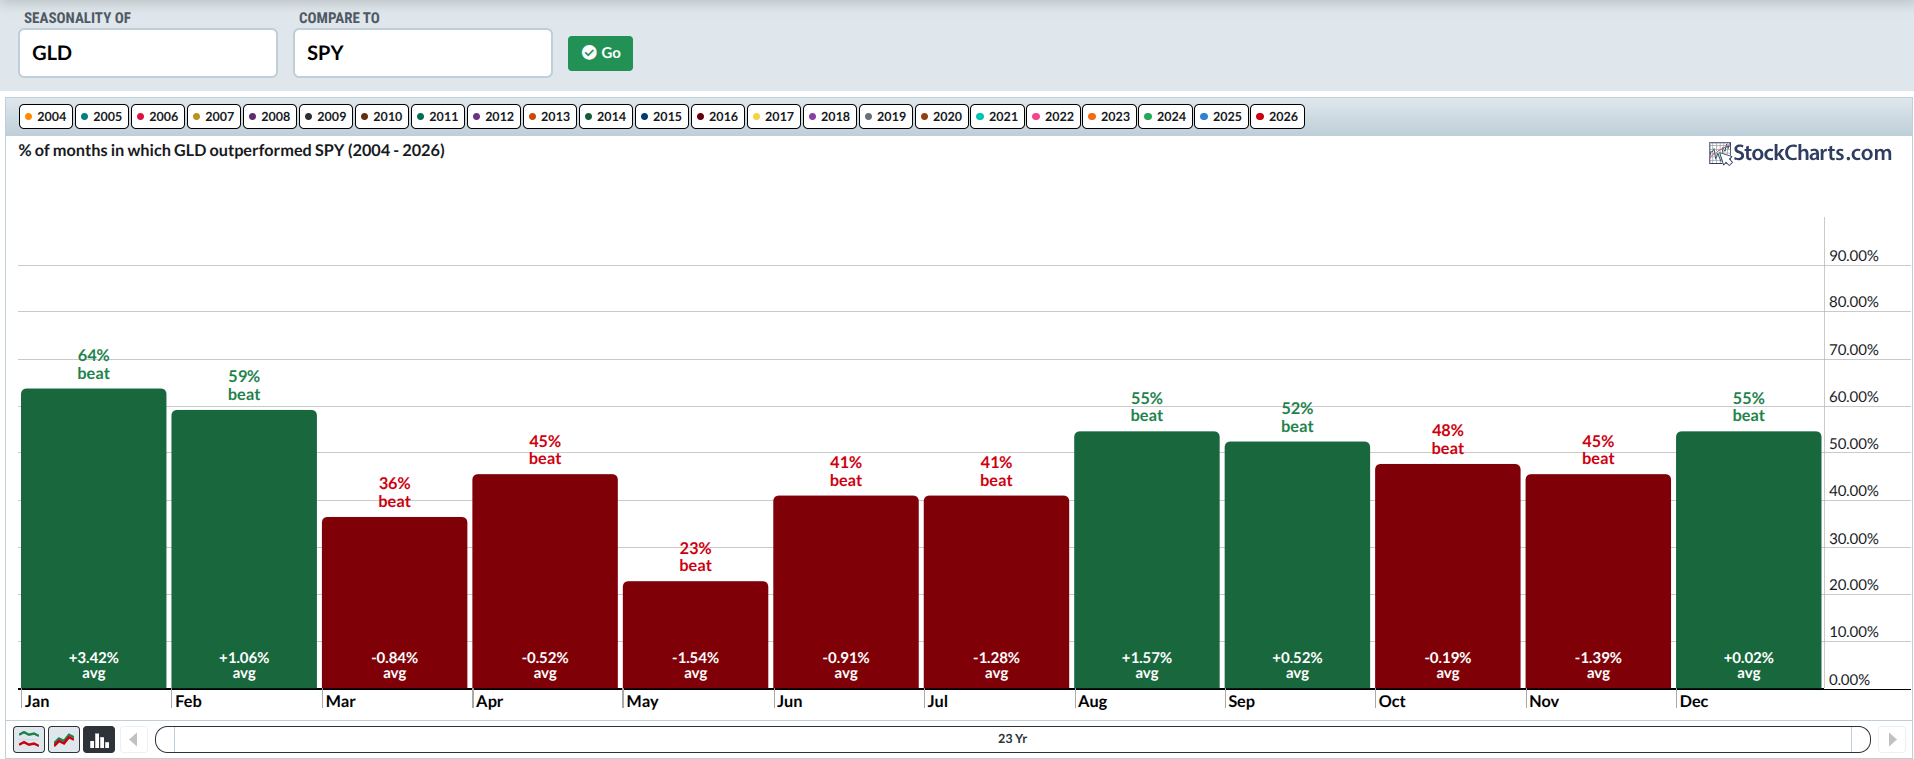
If you were holding both GLD and SPY over this time period, the strongest monthly outperformance would have been in January, beating the S&P with an average return of 3.42% relative to the broader market. The second strongest month is August, with an average seasonal return of 1.57%. The other “green” months had more positive days, but their returns are not as notable. Showing up often is not the same as showing up big. So pay attention to both numbers when looking at seasonal patterns.
Silver Seasonality from 2006 - 2026
Here’s a 20-year view of silver’s standalone seasonality using iShares Silver Trust (SLV) as our proxy. You can follow along here.
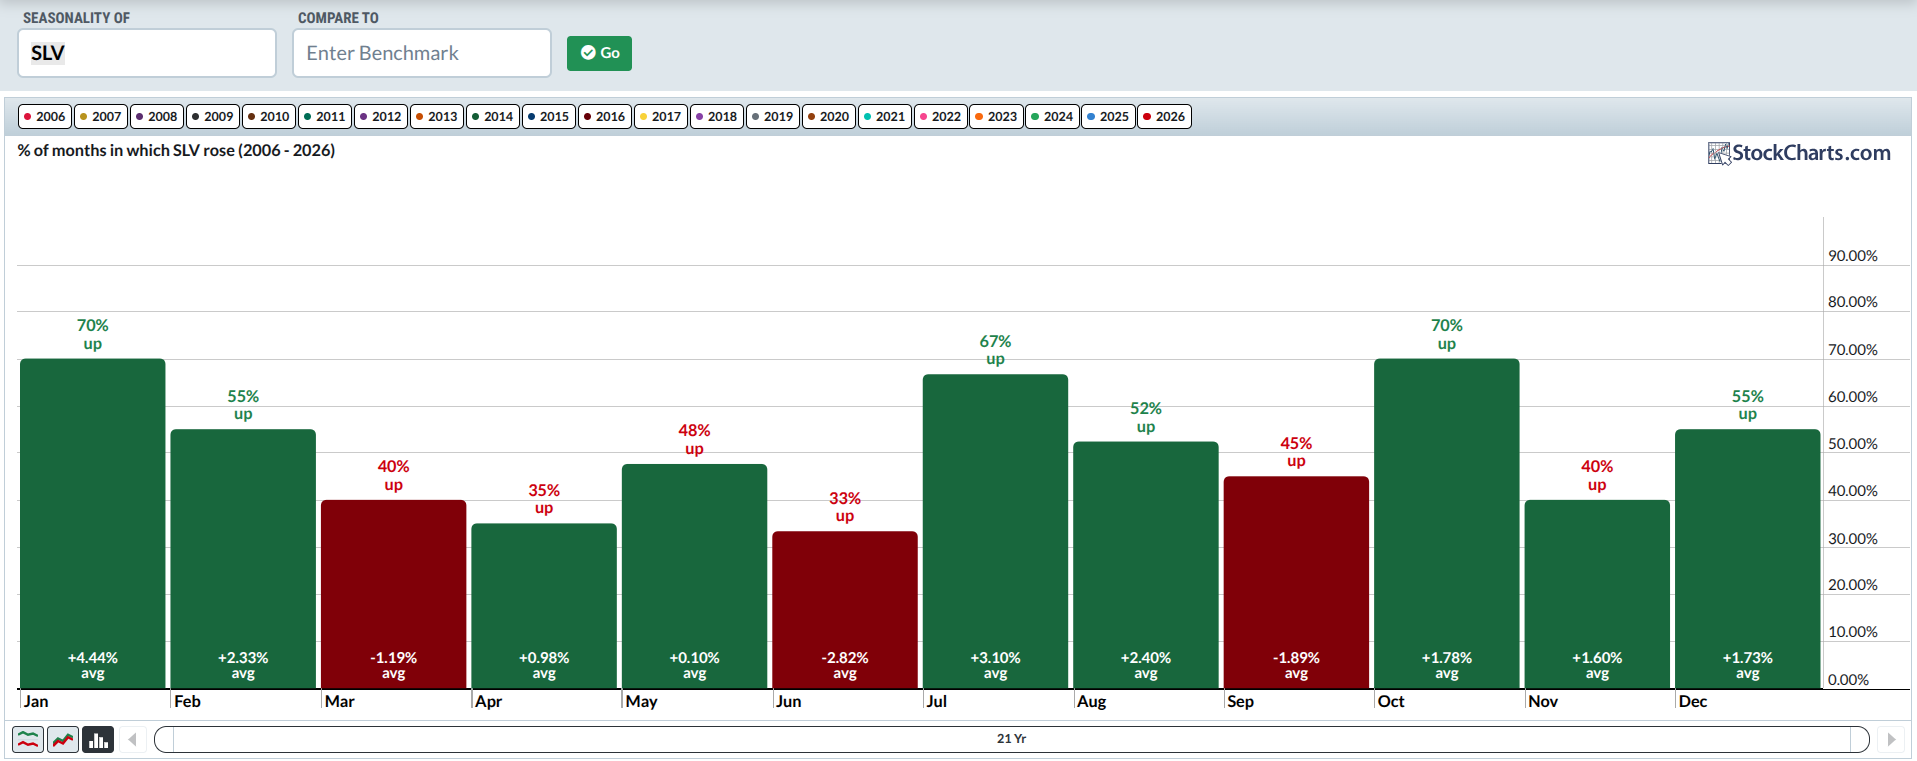
In terms of average seasonal return, January and July are the strongest. January has had 70% positive closes with an average return of 4.44%, while July has closed up 67% of the time with an average return of 3.10%. February and August both have average returns over 2%, but their positive close rate is near 50/50 (so you’d have to look at the price action and manage the trade more carefully, assuming that history repeats itself).
Now, let’s take a look at SLV’s relative seasonality against SPY.
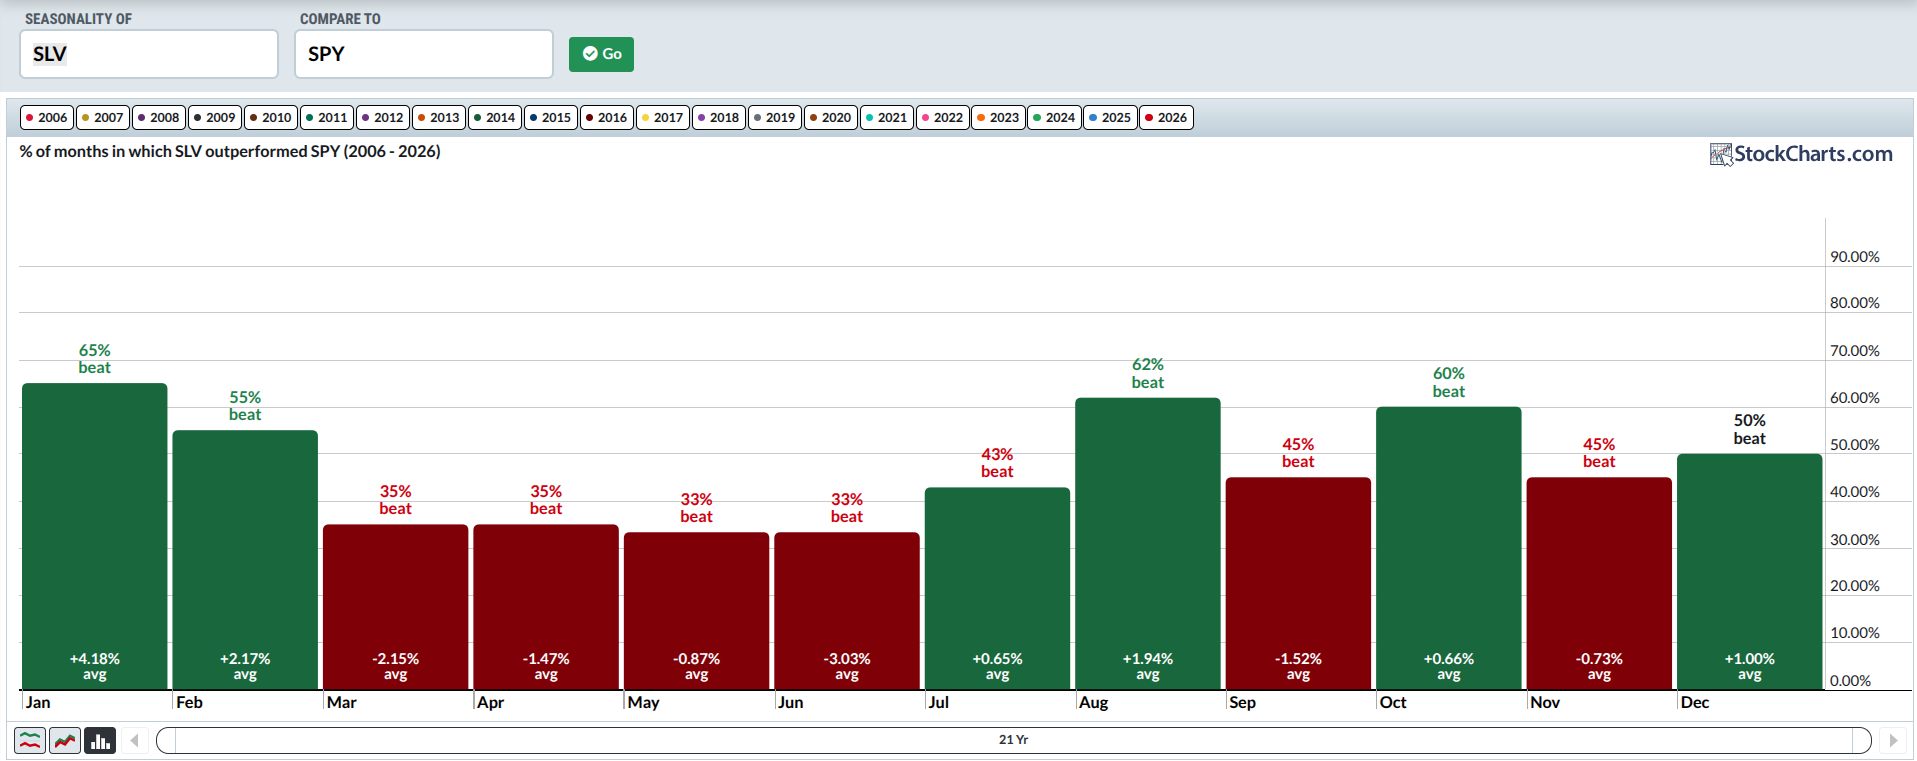
In this relative chart, January’s still the best outperforming month, with a positive close rate of 65% compared to SPY and an average return of 4.18%. In terms of closes, August comes in second with 62%, but with a 1.94% average return, and February comes in third at 55%, but with a 2.17% average return. Watch out for June, though, with an average negative return of -3% and a low positive-close rate.
Insider Tip #2: Average Returns Can Hide Skew Landmines. Silver is a volatile instrument. So, one large move up or down can skew the average return depending on the number of seasonality years you’re viewing. Especially on shorter time groupings, a large rally or correction can make the averages look much better or worse than it might be when viewed from a longer-term horizon. Be aware of this when anticipating seasonal patterns.
Bitcoin Seasonality from 2014-2026
Bitcoin’s seasonality chart goes back only 12 years, and the crypto has been on a volatile run, mostly net positive. So, this skews seasonality toward the positive.
Here, we’re looking at the spot price itself and not an ETF, which might have only a few years of data.
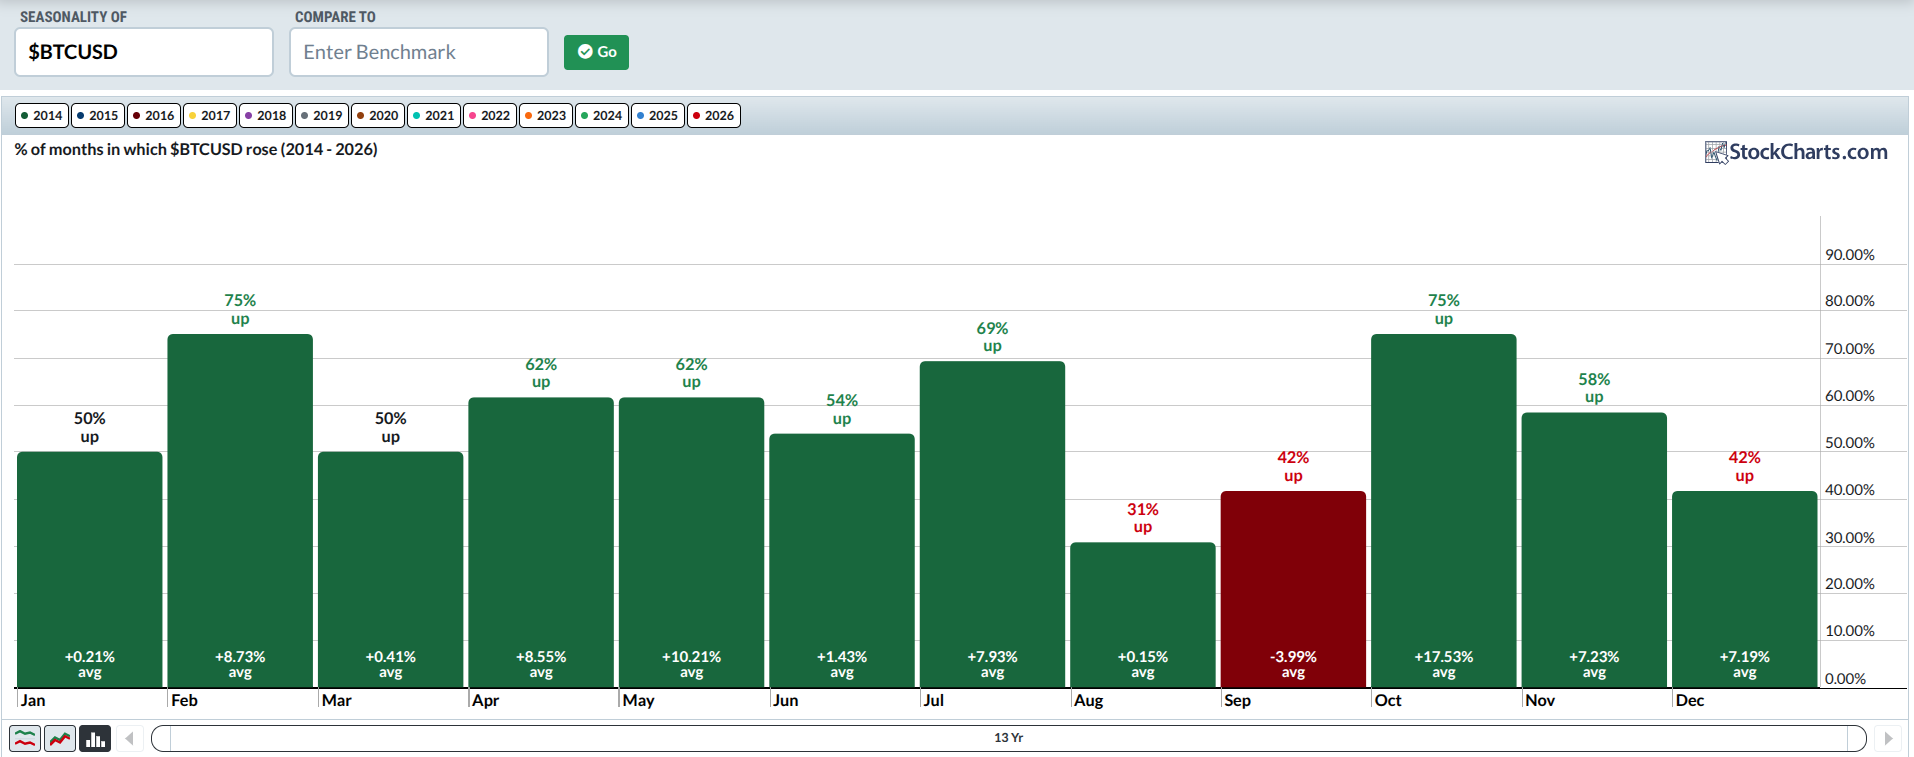
There’s only one standout here: “UPTOBER.” That’s the nickname Bitcoin has earned and you can see why: 75% positive close rate and over a 17% average return.
Will this coming October bring another “Uptober”? You have to watch the price action and prepare a setup for either outcome. After all, that’s what you do with all setups, right?
How does $BTCUSD look against the index (not ETF) $SPX? Let’s take a look at the relative seasonality chart.
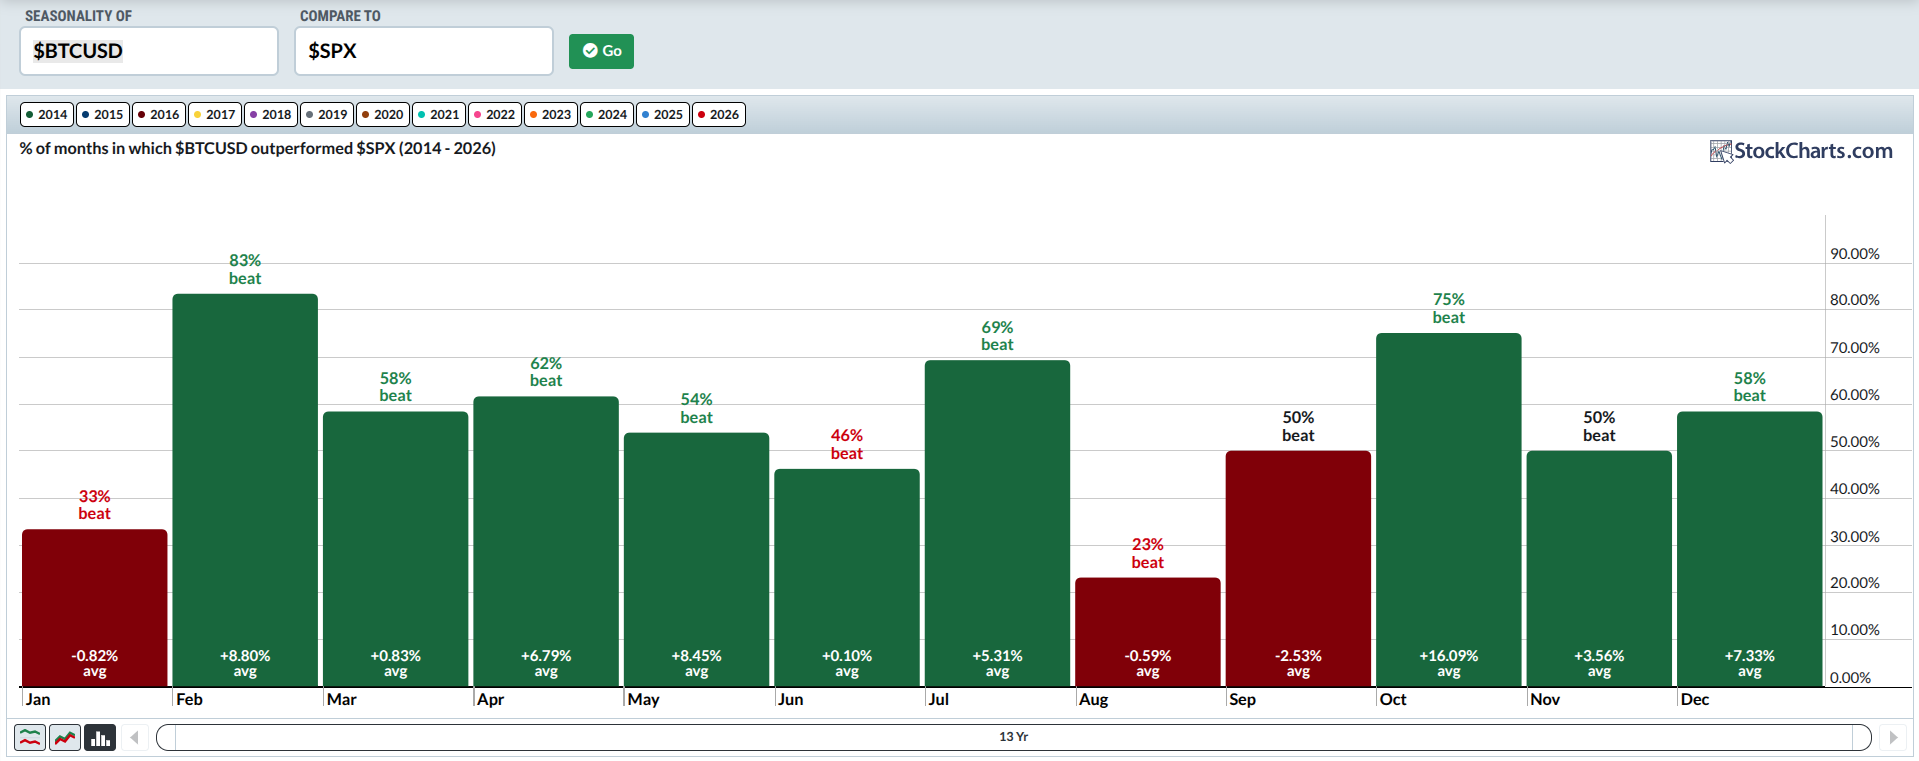
Bitcoin’s February close outperforms the S&P’s with an average 83% higher-close rate, but its average return in “Uptober” remains strong at over 16%. This is the only double-digit average return on the chart, by the way.
Insider Tip #3: Pay Attention to What’s Skewing Bitcoin Prices: “Uptober” didn’t earn its name atop several great October months. It had just a handful of exceptional ones. So, what drove it? You decide: a reset after September historical weakness, Q4 institutional inflows, or a self-fulfilling prophecy after its nickname,“Uptober,” was coined. It’s a tendency worth watching, but always keep an eye on the price action, and prepare your setups for either outcome, up or down.
And That’s a Wrap
All three have their own unique seasonal tendencies. They’re considered safe havens, though Bitcoin’s something of a wildcard and even wilder asset. Remember that geopolitics and global monetary moves can affect all three. That means seasonality simply remains a backdrop. Minus any major catalysts, it’s a context that just might help you make more informed decisions. So, take a closer look at each profile, mess around with the Seasonality chart by experimenting with different timeframes, and check out other asset seasonalites too. Happy charting!