The Stock Market Is Moving Higher—But Leadership Is Still Narrow

Key Takeaways
- Technology remains the stock market's driving force, with semiconductors and software stocks continuing to show strength.
- Look for groups such as transportation, banks, homebuilders, and retailers to reverse their downtrends.
- Friday's NFP report could be an important catalyst, especially for interst rate-sensitive groups.
Over the past 25 years, the S&P 500 ($SPX) has returned an average of -0.85% in September. This year, the index declined 0.45%, which, from a historical perspective, wasn’t all that bad.
Now, when you look at just the midterm election years during the same 25-year period, the S&P 500 has averaged a 1.53% decline. Again, -0.45% wasn’t so bad.
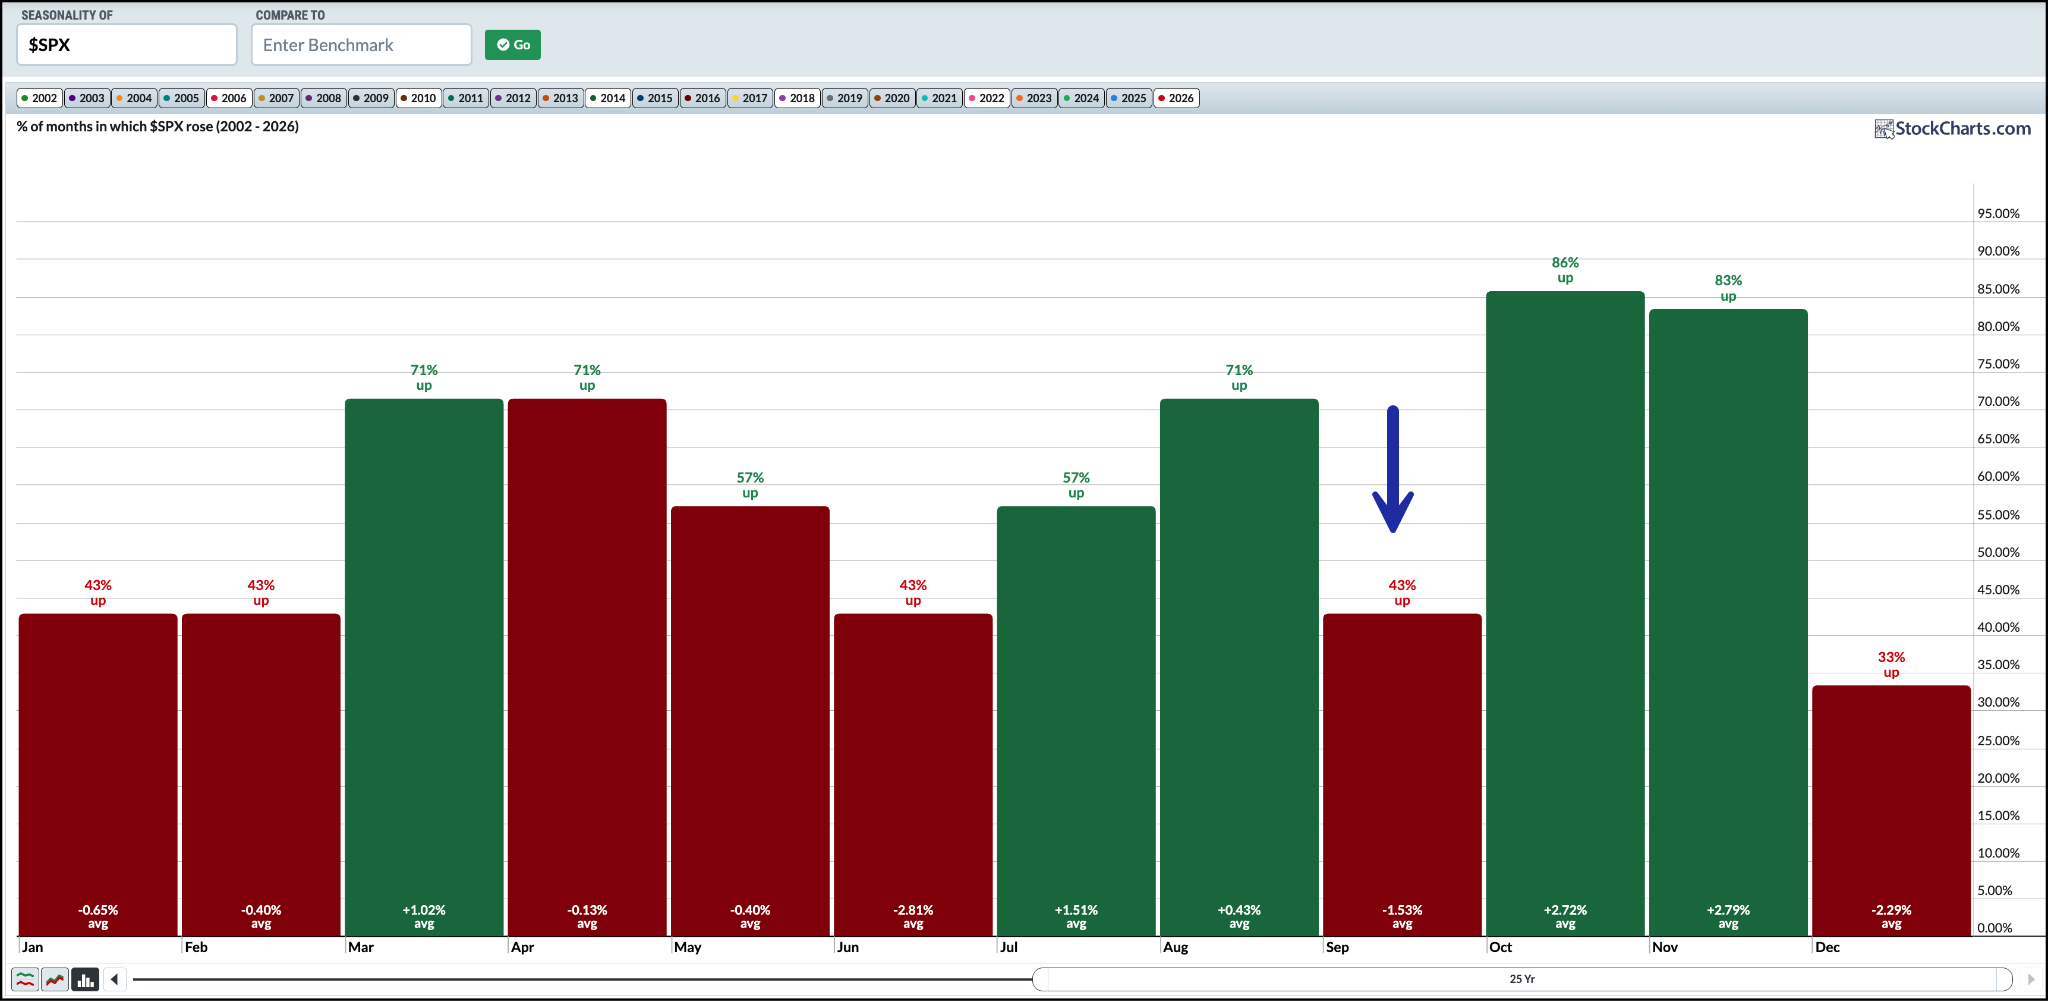
What lies ahead is encouraging. Historically, October and November have been stronger months, with average gains of +2.72% and +2.79%, respectively.
For the U.S. market indexes, October was off to a positive start. Transports, mid-cap, and small-cap indexes posted some of the strongest gains on Thursday. But the heavyweight technology stocks continue to pull this market higher.
Below is Thursday’s MarketCarpet.
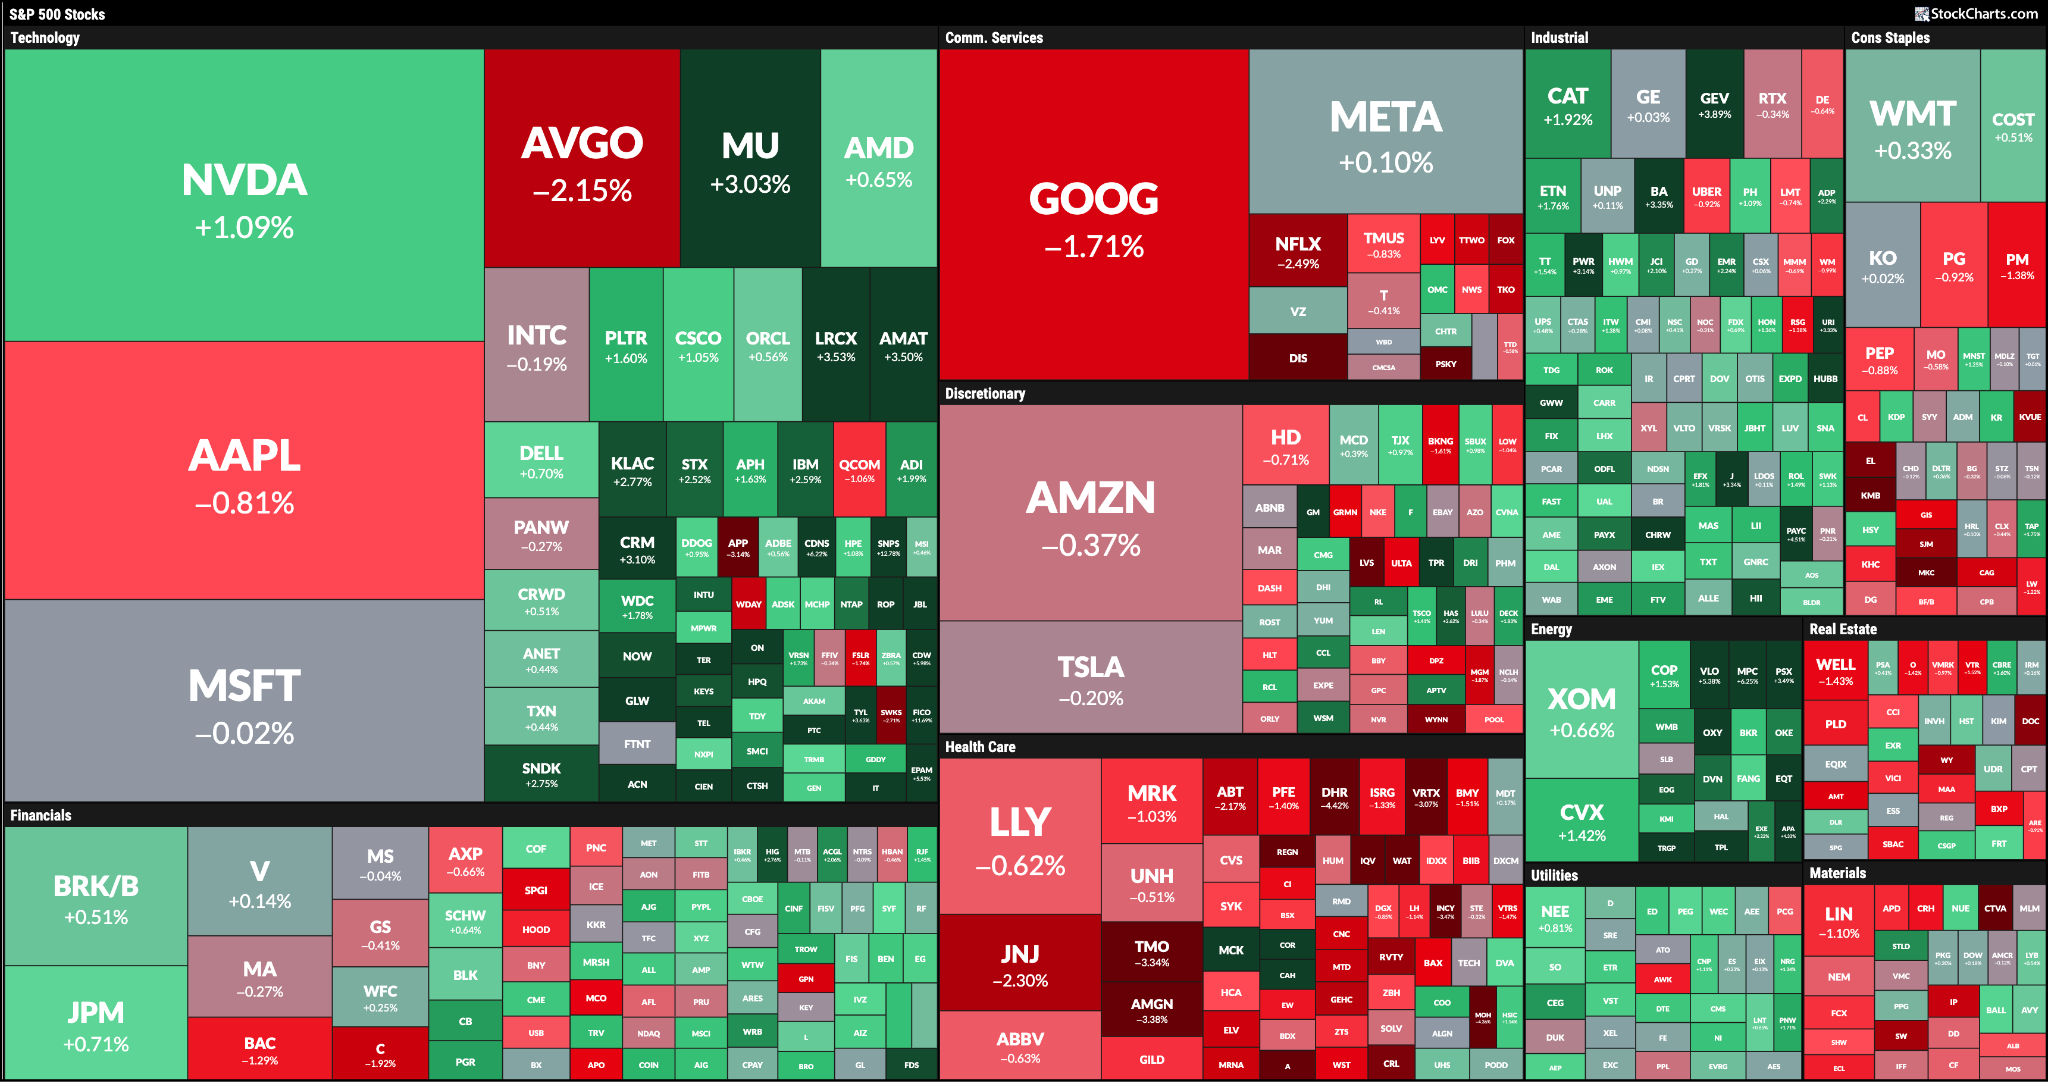
Technology was the second-best-performing S&P 500 sector, behind Energy. Several semiconductor and software stocks posted solid gains, including NVIDIA (NVDA), Micron (MU), and Advanced Micro Devices (AMD).
Microsoft (MSFT) started the trading session with a strong upside move, but that strength faded as the day progressed. The stock ended the day lower. Apple (AAPL) and Broadcom (AVGO) also finished in negative territory.
The VanEck Semiconductor ETF (SMH) broke above a narrow trading range, although I’d like to see some follow-through before confirming an upside breakout.
The iShares Expanded Tech-Software Sector ETF (IGV) closed near where it opened. This indicates there wasn’t enough buying pressure to push it above the day's high (see chart below).
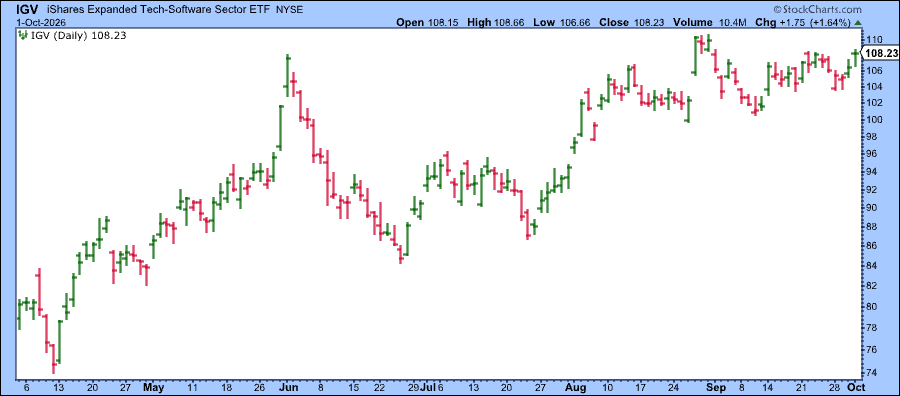
Will technology continue leading the market higher as the trading week comes to a close? Friday morning’s September nonfarm payrolls report could provide the answer.
Technology stocks remain in a bullish trend, but several other industry groups such as transportation, regional banks, homebuilders, and retail have a lot of ground to make up relative to the S&P 500. These groups have been in a downtrend, which makes them worth watching.
If stocks in these groups begin to show signs of a reversal, they could present opportunities to accumulate positions in these groups, especially homebuilders and banks. Since these are interest rate-sensitive, Friday’s jobs report could have an impact on their next directional move.
How to Find Stocks in Specific Industry Groups
The StockCharts Screener makes it easy to narrow your search of stocks within specific sectors or industry groups.
For example, suppose you’re looking for S&P 500 stocks in the Financial sector. Filtering for the Financial sector gives you a list of about 76 stocks. From there, you can narrow the results even further by selecting an industry group.
With banks preparing to kick off earnings season, you can select Banks from the Industry dropdown. This will narrow your list to about 13 stocks, which is much more manageable.
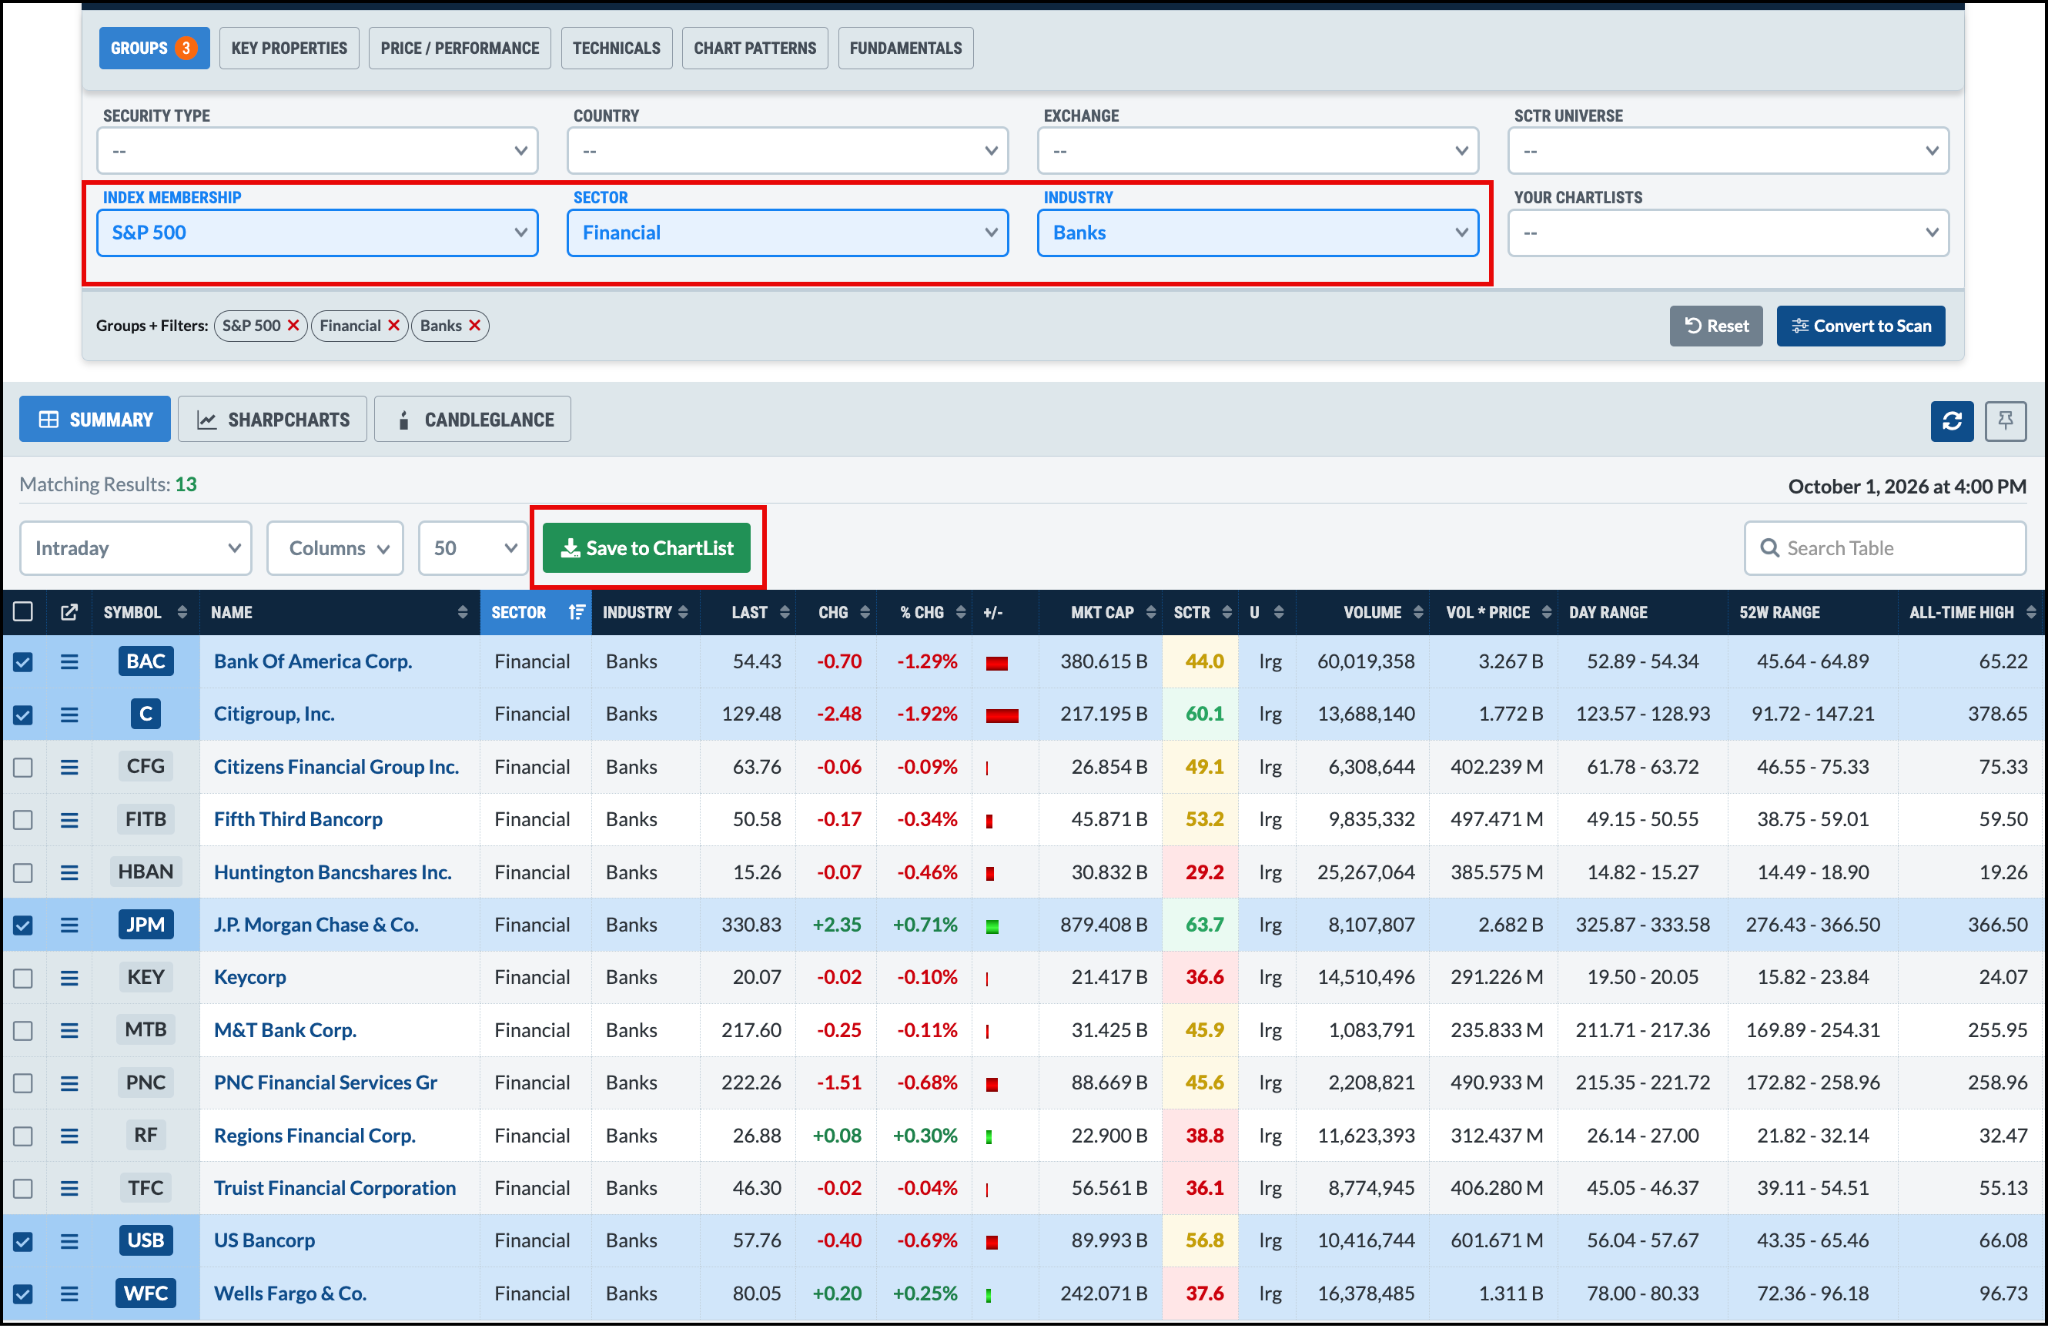
Once you’ve identified the stocks that interest you, select them and save them to a ChartList. From there, you can analyze the charts using your favorite technical indicators and then determine which ones are approaching potential entry points.
The Bottom Line
The stock market is at an interesting crossroads. Stocks continue to move higher even as Treasury yields and oil prices rise. The AI-driven rally is a major force behind the stock market’s strength, with Technology in the driver’s seat.
The next phase of the rally may depend on what happens beyond the mega-cap Technology names. Broader participation from groups such as transports, banks, homebuilders, and retailers would give the market a stronger footing and give us a positive October.
Disclaimer: This blog is for educational purposes only and should not be construed as financial advice. The ideas and strategies should never be used without first assessing your own personal and financial situation, or without consulting a financial professional.