XLK: Thrust or Exhaustion?

An overbought reading, which is when the probabilities of a downside reversal outweigh those of further near-term gains, is usually considered a bearish condition. But, as is often the case in technical analysis, there are exceptions to this rule.
A breadth thrust, for example, is a technical signal that occurs when market participation shifts rapidly from bearish to bullish. It also indicates that several stocks have begun to advance simultaneously as buying pressure becomes broad-based rather than being concentrated in just a few large-cap names. Historically, these signals have appeared near the beginning of significant advances. They have also frequently been associated with strong returns over the following six to 12 months or more.
What’s not so well known is that bullish signals are also transmitted when breadth data is unavailable and short-term price momentum behaves in an extreme manner. That’s important information to have, because most financial markets aren’t endowed with a strong history of breadth data.
Price thrust momentum is usually calculated from a short-term rate of change (ROC) and is identified by a multi-year extreme. By short-term ROC, I mean a time span between 10 days and 13 weeks.
Three price thrusts are presented in the chart of WTI crude (Chart 1). Two conditions are required for the thrust completions. First, the oscillator needs to record a multi-year low, indicating that the “thrust” develops from a period of unusual negativity amongst market participants. Second, it should be followed by a multi-year extreme reading on the upside, signifying a complete but substantial round trip in investor emotions.
The chart features two, what I have termed as “mini” thrusts. They weren’t “mini” at the time but became so when the generational extreme of 2020 was formed. After all, both experienced the multi-year extremes required to qualify. It’s just that the 2020 experience was so much more intense. All three were followed by major bull markets.
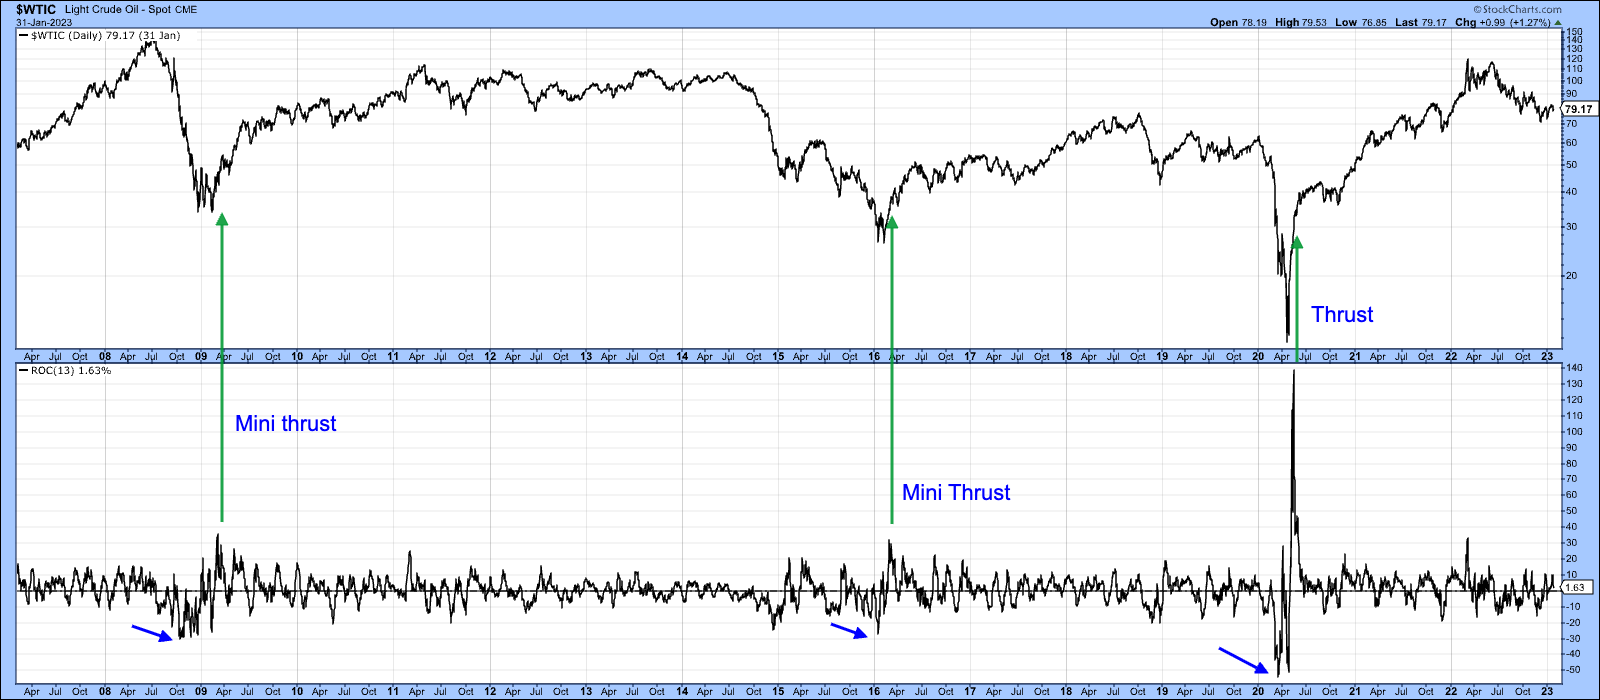
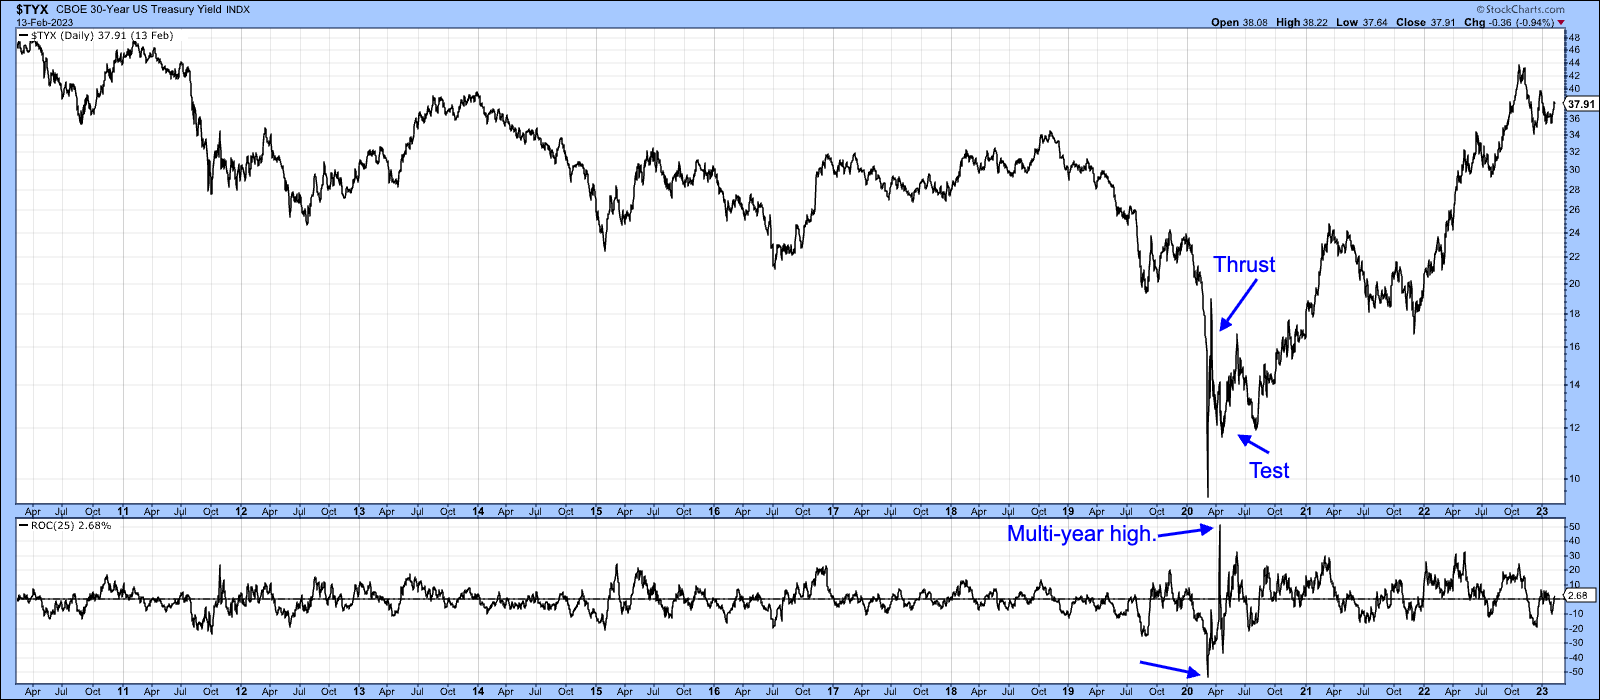
Chart 2 features another thrust, this time for the 30-year yield using a 25-day ROC. In this instance, it wasn’t followed by instant gratification in the form of immediately higher yields but involved a test of the lows first. This chart ends in 2023 but yields, of course, have continued to rise ever since.
What About Exhaustion?
Price thrusts are relatively rare and typically signal the birth of a bull market. But, what happens when an extreme overbought reading is preceded by a substantial rally rather than a bear market?
Chart 3 provides an important clue. Neither of the extreme readings shown was preceded by a meaningful decline. In silver's case, both the 1975 and 1980 peaks represented exhaustion rather than the beginning of a new advance, as the 45-day ROC peaked from what were, at the time, record levels. In other words, the momentum surge reflected the culmination of an already established bull market rather than a dramatic reversal from bearish to bullish sentiment.
It’s also evident that the 1980 peak was preceded by what could legitimately be described as an exhaustion move, highlighted by the small red arrow. While that reading didn’t quite exceed the 1975 momentum peak, it nevertheless registered a multi-year high and therefore carried many of the same characteristics associated with a climactic advance. One difference is that the price never confirmed with a negative (blue) 50-day MA crossover.
The contrast with the bullish thrust examples is important. When an extreme upside momentum reading develops immediately after a period of unusually negative sentiment, it often signals the start of a major advance. When a similar reading occurs after a prolonged rally, however, it’s more likely to represent exhaustion and warn that the prevailing bull market is approaching its end.
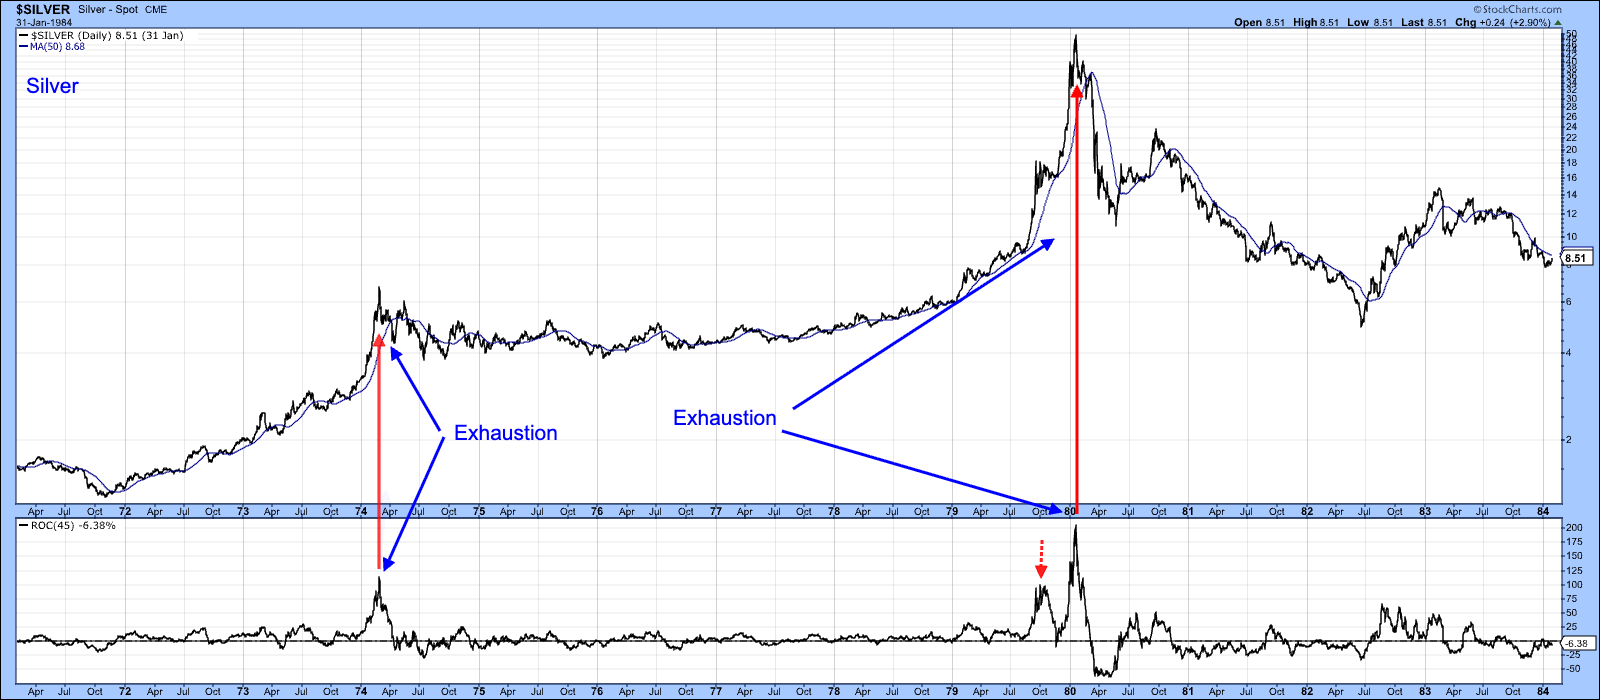
Chart 4 brings us to the heart of the question posed by the title. It shows four successful thrusts for the 45-day ROC of the Technology Select Sector SPDR Fund (XLK). Each was preceded by a multi-year oversold reading and followed by a multi-year high. In every case, the signal was succeeded by a major bull market.
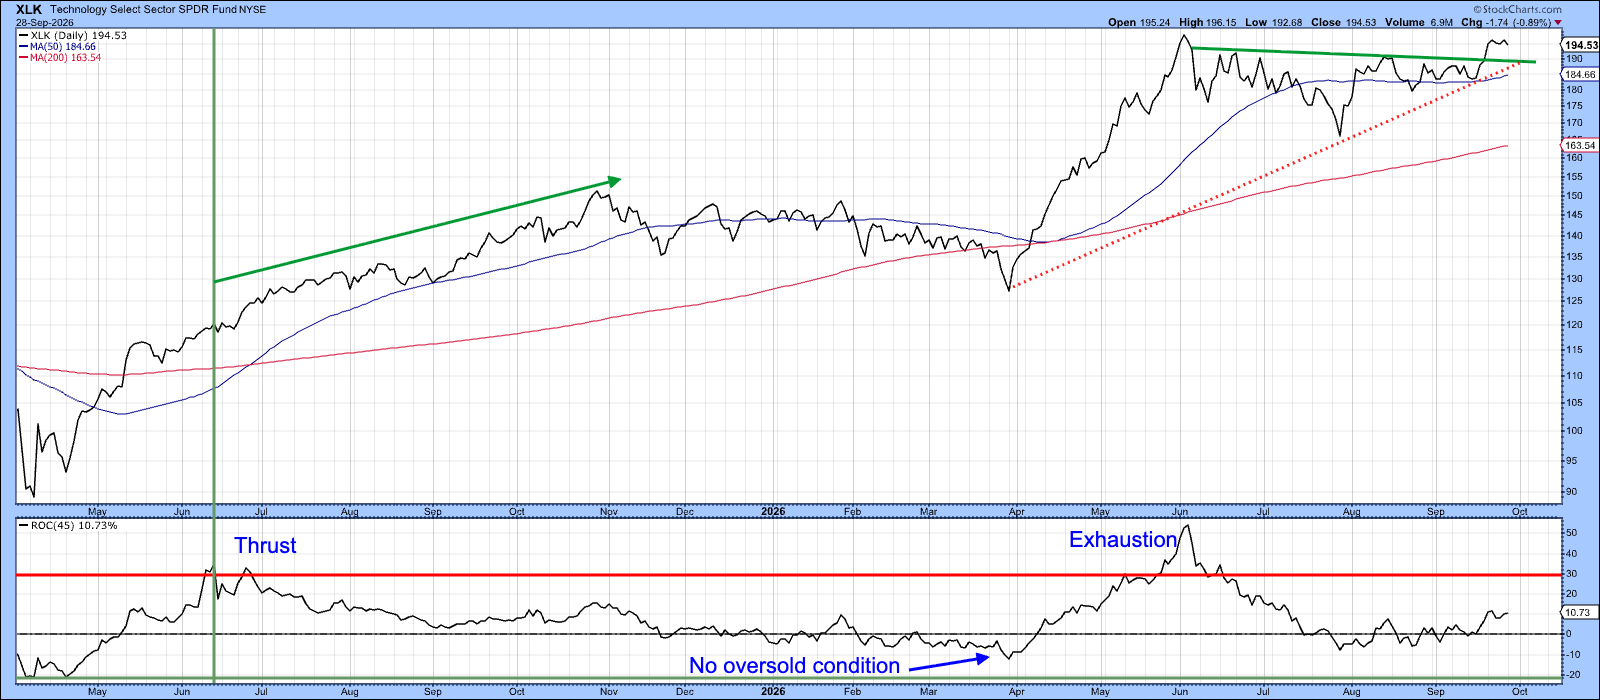
The fifth example, in 2026, reached a record high, indicating that the advance was something special. Unfortunately, it lacks one of the key characteristics of a classic bullish thrust. Unlike the previous examples, the extreme overbought reading was not preceded by a deeply oversold condition. Instead, it developed as an extension of an already established advance.
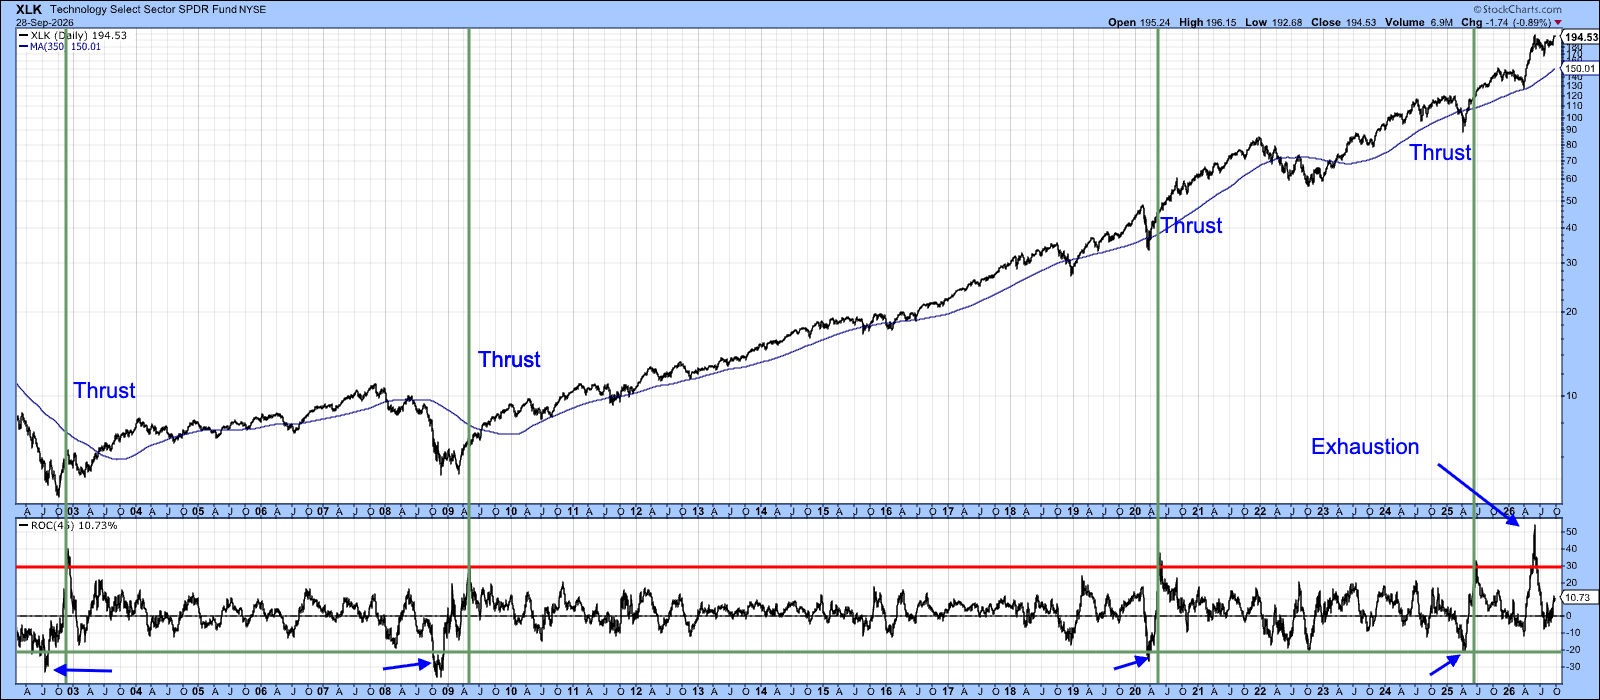
As a result, the 2026 signal appears to share more of the characteristics of an exhaustion move than a genuine thrust. Rather than reflecting a dramatic shift from pervasive pessimism to broad-based optimism, it suggests a market that may be approaching the later stages of an advance. That doesn’t necessarily mean the bull market is over. It implies that the signal should be interpreted with greater caution than the four earlier thrusts that emerged directly from deeply depressed momentum conditions.
Like the 1979 silver peak featured in Chart 3, XLK has yet to validate the bearish momentum signal by breaking below either its 50-day moving average or the red dashed uptrend line (see Chart 5). Consequently, what appears to be a warning of buyer exhaustion remains just that—a warning.
It is only one piece of evidence in a weight-of-the-evidence framework. Nevertheless, major market turning points are often recognized only in hindsight, and there’s a reasonable possibility that we may later view this momentum extreme as a pivotal moment in the current advance.
Good luck and good charting,
Martin J. Pring
The views expressed in this article are those of the author and do not necessarily reflect the position or opinion of Pring Turner Capital Group of Walnut Creek or its affiliates. The Six Stages of the Business Cycle are followed each month in Martin Pring’s Intermarket Review.