Why Now’s the Time to Own Small Caps: Q4 Levels to Watch on IWM

Key Takeaways
- The Russell 2000 has pulled back 9% from its August high as rising Treasury yields pressure small- and mid-cap stocks.
- Midterm-year seasonality turns bullish in October, historically favoring a potential and durable Q4 rebound.
- IWM approaches a confluence of technical support, while oversold momentum could set the stage for a reversal.
The bond selloff continues to leave a trail of tears within rate-sensitive spaces. Recently, I profiled the Utilities sector and how that niche of the S&P 500 could be the tell as to when yields stabilize. The Utilities Select Sector SPDR ETF (XLU) printed a bullish engulfing candlestick on the penultimate day of September on very heavy volume. So, the power-generation corner of the stock market remains on watch for a possible upside reversal.
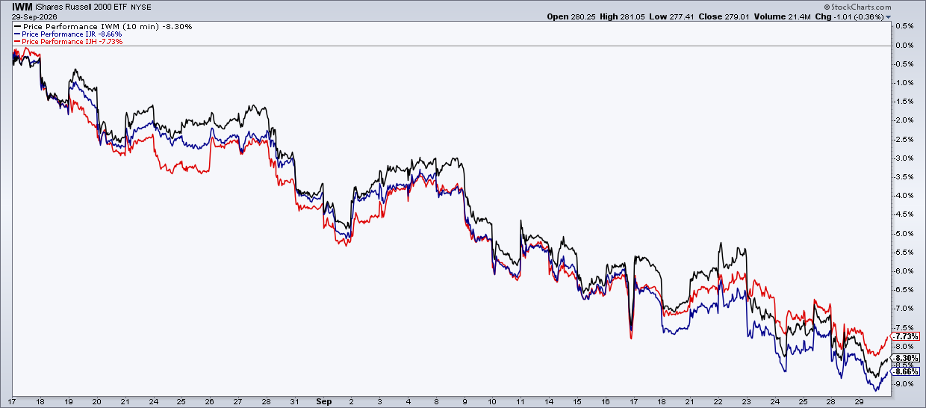
Another equity slice catches my attention heading into the fourth quarter: small caps. The iShares Russell 2000 ETF (IWM) has pulled back 9% from its August 14 all-time high. Shares tagged $305 in the middle of Q3, not far above their January peak, with the 200-day moving average now in plain view. Of course, the Russell 2000 includes a mix of profitable and unprofitable companies, so the higher short- and intermediate-term borrowing costs weigh more on the index.
Interestingly, the higher-quality iShares Core S&P Small-Cap ETF (IJR) and iShares Core S&P Mid-Cap ETF (IJH) haven’t fared materially better in the past month and a half. Indeed, it appears to be a sell-first, ask-questions-later situation among the SMIDs. IJR is also within striking distance of its rising 200-DMA, and IJH is already there.
It’s All About the Rates... It Would Seem
Really, it may be one big trade right now. When Treasury yields ascend, that’s usually bad news for U.S. small- and mid-sized stocks. Bearish price action is often seen in consumer stocks and cyclicals, too.
Is it too simple to assert that a mere calendar flip to October will change all of that? Perhaps. But at the same time, there are clear seasonal tailwinds now in play for IWM, with the midterm elections less than five weeks away.
Winds of Change on the Calendar
I’m going to break a technical analysis rule by first digging into seasonality. Traditionally, eyeing the calendar for clues should come second to pure price-action assessment, but let’s get wild.
Using StockCharts’ revamped Seasonality tool, we find that the average gain during midterm-year Octobers is a strong 3.5% (up 83% of the time) since 2002. November is just as strong, posting a 3.1% mean return (up in all six instances).
I toggled the years above the chart so that only midterm years are active. September lived up to its bearish billing (and then some), with IWM down 5% just ahead of the market close on the 30th.
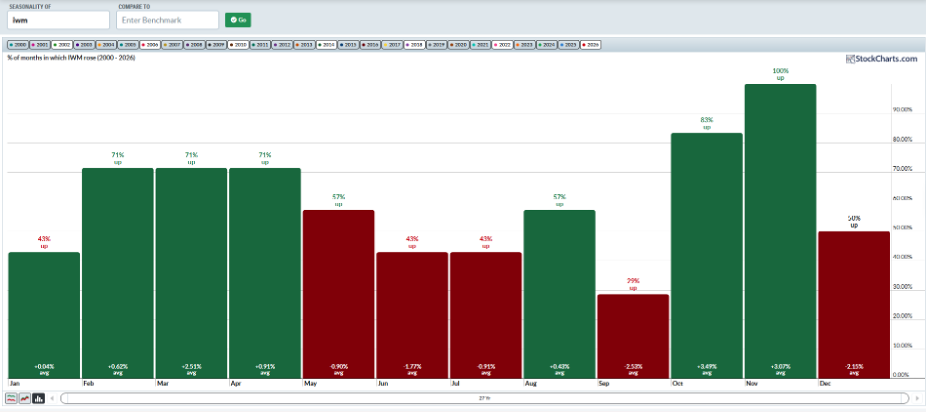
Chart Watch: Several Indicators Point to $270s IWM Support
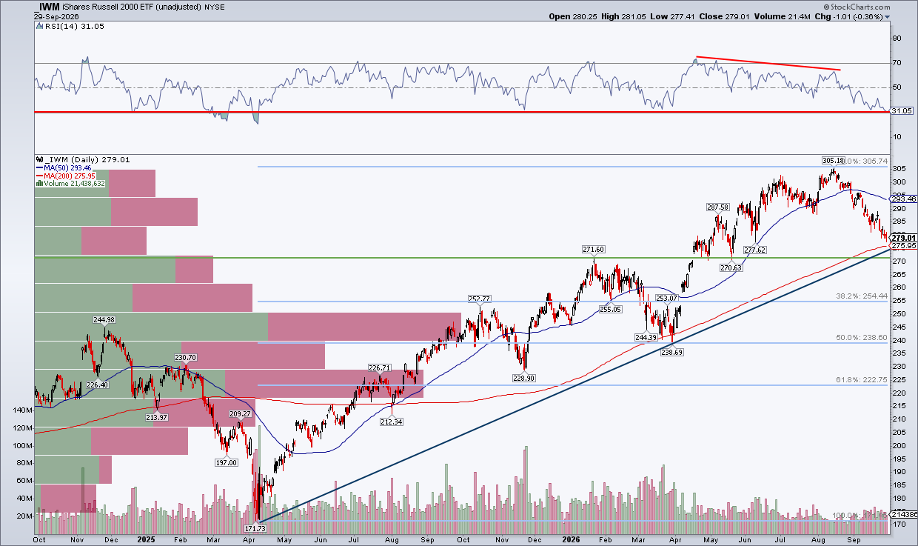
So, seasonality checks out. But what about the actual technical chart? Notice in the SharpChart below that IWM closes in on key support. There’s a confluence of features in play just under the recent settle.
First, the aforementioned 200-day moving average is only 2% below the current spot, and that trend-indicator line is also on the rise. This suggests that the bulls still control the primary trend.
Second, an uptrend support line from the April 2025 low enters the scene almost exactly at the 200-DMA. Third, there’s technical polarity in the low $20s, within a few percent of where IWM trades today. A bullish reversal here is absolutely on the table, in my view.
IWM is also technically oversold, per the RSI momentum oscillator at the top of the chart. It finished Tuesday at its weakest mark since that post-Liberation Day period almost 19 months ago. The momentum capitulation came after an April-through-mid-August stretch of lower highs in the RSI, ultimately portending the stair-step lower in price over the past six-plus weeks.
What If ...
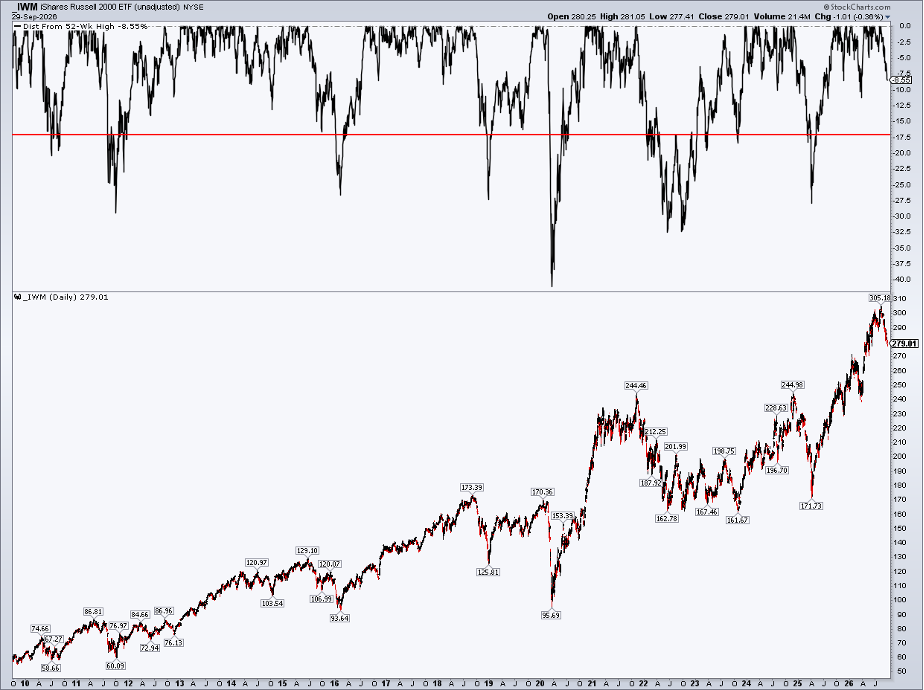
If $272 to $276 doesn’t hold, the next stop could be the 38.2% Fibonacci retracement of the April 2025 to August 2026 rally, which is $254. That would be a 17% drawdown. Such a plunge is by no means out of the question. We can apply the Distance From 52-Wk High indicator to show that 20% pullbacks are the norm, not the exception, for IWM since 2010.
IWM Portfolio X-Ray
Across sectors, Health Care and Financials are most critical to IWM. Those areas command a high 39% of the Russell 2000. Biotech and regional banks are, of course, closely monitored. Biotech has held up decently over the back half of Q3, but the regional bank’s primary ETF (KRE) is below its 200-DMA (as it was at the March 30 low).
Keep in mind that bank earnings begin rolling in two weeks from now. Maybe the bar is low enough for positive earnings reactions (remember, it’s how a stock responds to the report that matters most).
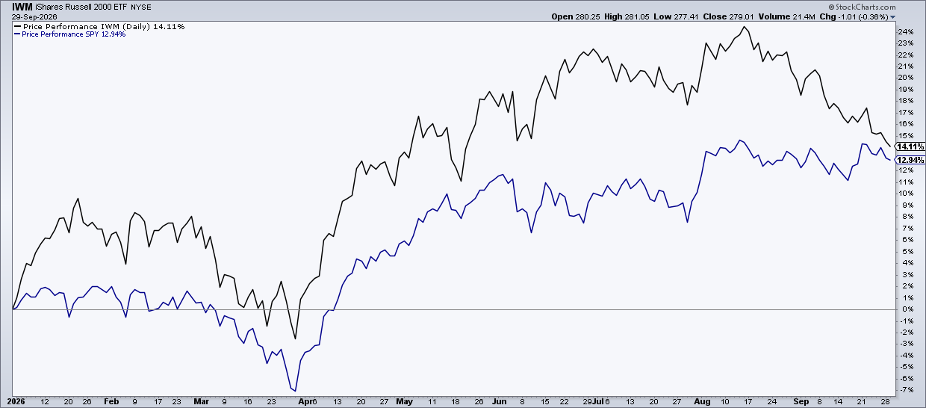
For IWM, it might just come down to the interest-rate path over the weeks ahead. Small caps barely hang on to their YTD lead over the SPDR S&P 500 ETF (SPY), and I expect a Q4 small-cap buying burst to widen that gap once more.
The Bottom Line
IWM’s late-summer fall from grace hasn’t been particularly bruising or eye-popping. Rather, small caps have slowly bled lower as the 10-year yield has climbed from near 4.6% to near 5.3%. It’s hard to get around the narrative that as go Treasuries, so go small caps, but midterm-year seasonality is outright bullish in October and November. What’s more, IWM has dropped to clear technical support. I expect the little guys to pick up the slack and resume higher.
Disclaimer: This blog is for educational purposes only and should not be construed as financial advice. The ideas and strategies should never be used without first assessing your own personal and financial situation, or without consulting a financial professional.