StockCharts Insider: More Insider Tips for the AI Scan Wizard
Before We Dive In…
StockCharts’ AI Scan Wizard allows you to build a complete scan from a single-sentence prompt. Easy. The hard part’s asking for the right thing, checking to make sure you got what you asked for, and making this one-off list more useful than just a bucket of names. Here are seven Insider Tips to help you get more out of the Wizard.
Insider Tip #1: Don't Assume The Wizard's Always Right.
If you ask the Wizard to find stocks “in an uptrend,” it has to interpret what that means. That could mean stocks trading above their 50-day simple moving average (SMA). Or it could mean stocks trading above moving averages positioned in the correct order (like 50-day above the 200-day SMA).
Once you click Apply to drop the scan into the editor, be sure to also click Validate & Explain. You’ll get the rationale in plain English. If it’s what you meant, keep it. If not, tweak it, or change your prompt.
Here’s an example using the second bulleted prompt below:
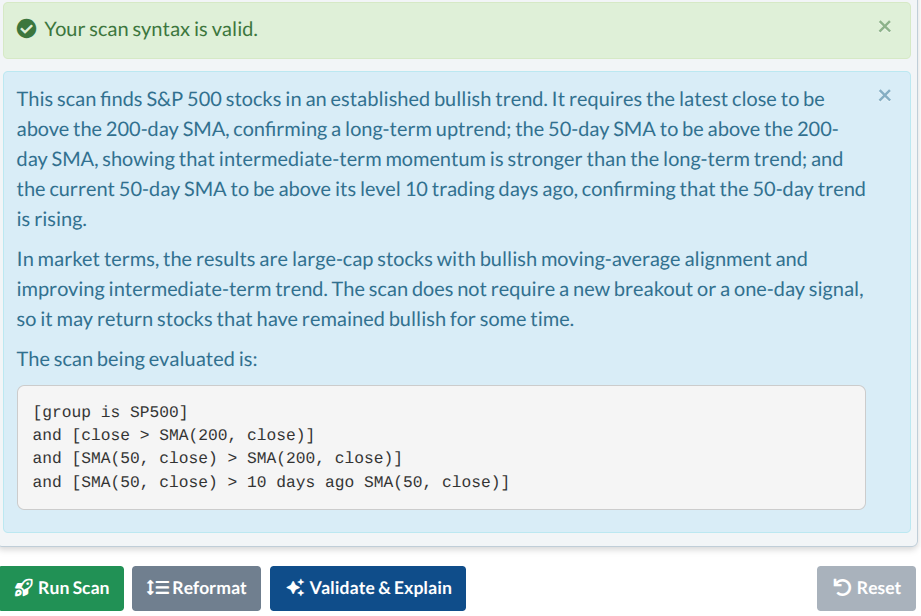
Think of these two functions as a pair: The Wizard turns words into code, and Validate & Explain sort of reverse-engineers that code back into words, but as an explanation. Your task is to see if both sets of words agree, with the last set optimizing the first. Keep in mind the Wizard assumes you know what you’re asking for. But you have to confirm that the intention behind the code is correct.
Try these prompts:
- First, try: Find S&P 500 stocks in an uptrend.
- Next, try: Find S&P 500 stocks trading above their 200-day moving average whose 50-day moving average is also above the 200-day.
- You can even refine it: Find S&P 500 stocks trading above their 200-day moving average whose 50-day moving average is also above the 200-day and higher than it was 10 days ago.
Do you see the difference in results? I did. At the time of writing, the first prompt gave me 194 stocks; the second gave me more, 258, which tells you the Wizard’s built-in idea of ‘uptrend’ was stricter than mine; the third narrowed it down to 159.
Insider Tip #2: The Wizard Assumes You're Bullish.
I’ve tested it a few times, and it seems like the Wizard is a biased bull. What does that mean? Well, if you’re a bear, or just looking to short stocks, don’t ask for a “strong trend.” It’ll hand you uptrends. The Wizard will likely use the Average Directional Index (ADX), which measures how strong a trend is, but not its direction.
To elaborate, the Wizard will choose the +DI and -DI positioning and add its own indicators to make sure the trend is bullish. If you’re looking for a strong downtrend, you need to specify it. Again, click Validate & Explain to check that it’s doing what you asked.
Try these prompts:
- Find stocks in a strong downtrend, with ADX above 30 and –DI above +DI.
- Find S&P 500 stocks in a strong downtrend that just closed below their 50-day moving average.
- Refine it even further: Find S&P 500 stocks in a strong downtrend that just closed below their 50-day moving average and limit the results to stocks making a new 3-month low.
Insider Tip #3: Split Breakouts Into Three Separate Scans
Searching for a breakout, you make a broad request for “stocks making new three-month highs.” Your scan yields a bunch of stocks, but there’s a problem: they’re a mixed bag. You click through each name and you notice three different scenarios:
- Long and strong trends: These are stocks that have been trending higher for months.
- New accumulation: These are stocks breaking out of a sideways range.
- Moving average reclaims: These are stocks that fell below a given moving average (like the 50 or 200) and just clawed back above it.
These are different scenarios that call for their own unique setups. You may even prefer one scenario over another. The fix is to run each scenario as its own scan.
Try these prompts (and note that you can change the variables):
- For long and strong trends, try: Find stocks making a new 3-month high that have stayed above their 200-day moving average for the past 120 days.
- For stocks breaking out of a sideways base, try: Find stocks breaking out to a new 3-month high after trading in a range of less than 15% over the previous three months.
- For stocks reclaiming a moving average, try: Find stocks that closed above their 200-day moving average today after spending at least 20 days below it.
Caveat: Even when specifying these conditions, some of these charts in the same group can vary dramatically.
Insider Tip #4: Build Your Confirmation Into the Scan
Traders often wait for some form of confirmation before pulling the trigger. Is price above the 50-day SMA? Is the RSI above, say, 60 (or any number you prefer)? What about the SCTR score—is it above, say, 70?
If you regularly check for these confirmation signals, maybe you should just build them into your scan. So, whatever your confirmation criteria are, try adding them to the prompt.
Everyone has their own set of confirmation checks, so the following are hypothetical examples. Try adding your own.
- Begin with this: Find stocks making a new 3-month high with 14-day RSI above 60, volume at least 1.5 times its 50-day average, and a positive Chaikin Money Flow reading.
- Try modifying it in the chat to refine: The stock must have closed in the top 25% of today's range.
- Try another modification: Remove any stock more than 15% above its 50-day moving average.
When making modifications, the Wizard will work with the code that’s already in the editor (just click Apply to make the changes).
Insider Tip #5: Narrow by Strength
When you build a scan that returns 100+ names, it can be a little overwhelming. You need to cut the list down. One of the best ways to do this is to narrow your list by strength. Unless you use a prompt that mentions some form of relative strength, weak stocks can still slip through.
Try these prompts to keep the strongest names:
- Outperforming SPY: Find stocks in an uptrend with a SCTR above 70 that are outperforming SPY over the past three months.
- Raise the bar: Now, keep only stocks that are beating XLK.
I chose XLK, which is a Technology Sector proxy. You can choose any sector you wish.
Insider Tip #6: Drill Down to the Industry, Then Filter for Quality
Sector Drilldown and MarketCarpets tools are good tools for finding strong stocks in a specific industry. But neither covers fundamentals if they’re important to you. The Wizard can combine both. Just name the industry, set a technical threshold like a SCTR score above, say, 75, and add a few fundamental filters. What you get back is a list of potentially stronger stocks with good technicals and solid fundamentals.
Try these variations of prompts and eventually come up with your own:
- Find stocks in the Semiconductors industry with a SCTR above 75 that are profitable and grew revenue over the past year.
- Find stocks in the Software industry with a SCTR above 75, positive earnings growth over the past year, and a market cap above 10 billion.
- Here’s one way to refine it: Keep only stocks trading within 5% of their 50-day moving average.
Insider Tip #7: Fine-Tune an Ichimoku Cloud Dip
If you’ve read my previous articles, you know that the Ichimoku Cloud is one of my favorite indicators. Well, here’s a scan that you won’t find in the Library. It scans for stocks that have been trading above the cloud for weeks and are just now dipping into it.
With the Wizard’s assistance, you can build this with just a few prompts. You can also refine it by adding a Chikou Span above price to filter for stocks in which momentum is favoring the buyers’ side, despite the pullback.
Here are the prompts:
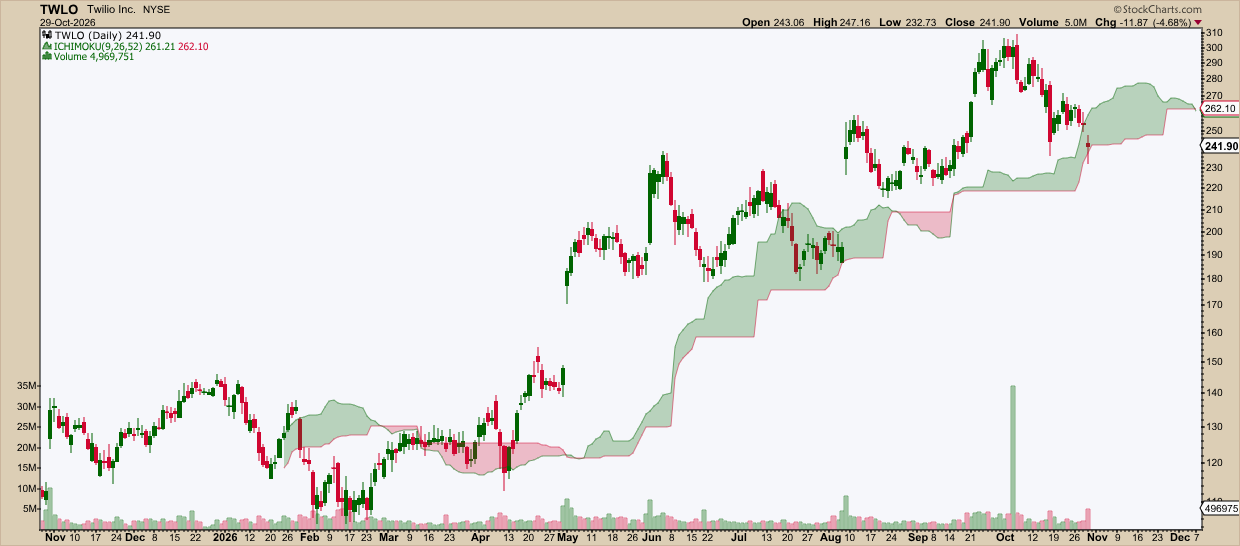
- The basic Ichimoku Cloud dip prompt: Find stocks that closed above the Ichimoku Cloud on each of the previous 20 days and closed inside the cloud today.
Here’s a chart of one of the results using this prompt:
- Refine it: Keep only stocks where Senkou Span A is above Senkou Span B.
- Refine even further: Add a condition that the Chikou Span is above price, meaning today's close is higher than the close 26 days ago.
And That’s a Wrap
The Wizard can turn any sentence into a running scan, but the quality of the scan’s run is only as good as the sentence. Keep that in mind, and always check the Validate & Explain feature before running it. Keep building and experimenting with the Wizard. It’s a skill. The better you get, the more effective your results.
Disclaimer: This article is for educational purposes only and is not investment advice. Examples are for illustration, not recommendations. Do your own research or consult a financial professional before investing.