How to Tell a Normal Pullback From a More Serious Market Decline

After a fairly eventful two weeks for the financial markets, I thought it might be helpful to review how mindful investors can navigate periods of market uncertainty. It can be easy to get drawn into the “flickering ticks” of daily market activity. For longer-term investors, though, that can mean overreacting to short-term noise, rather than staying attuned to the longer-term trends.
With that in mind, here are five methods I’ve used to ensure I remain focused on the trends and shifts that truly matter for my portfolio!
1. Establish a “line in the sand.”
Instead of overreacting to one individual trading day’s action, we need to ask ourselves, “Have any key levels been violated?” For the S&P 500 ($SPX) index, that means paying less attention to the daily range and daily close, and more attention to whether a particular day’s move has moved through a critical level of support.
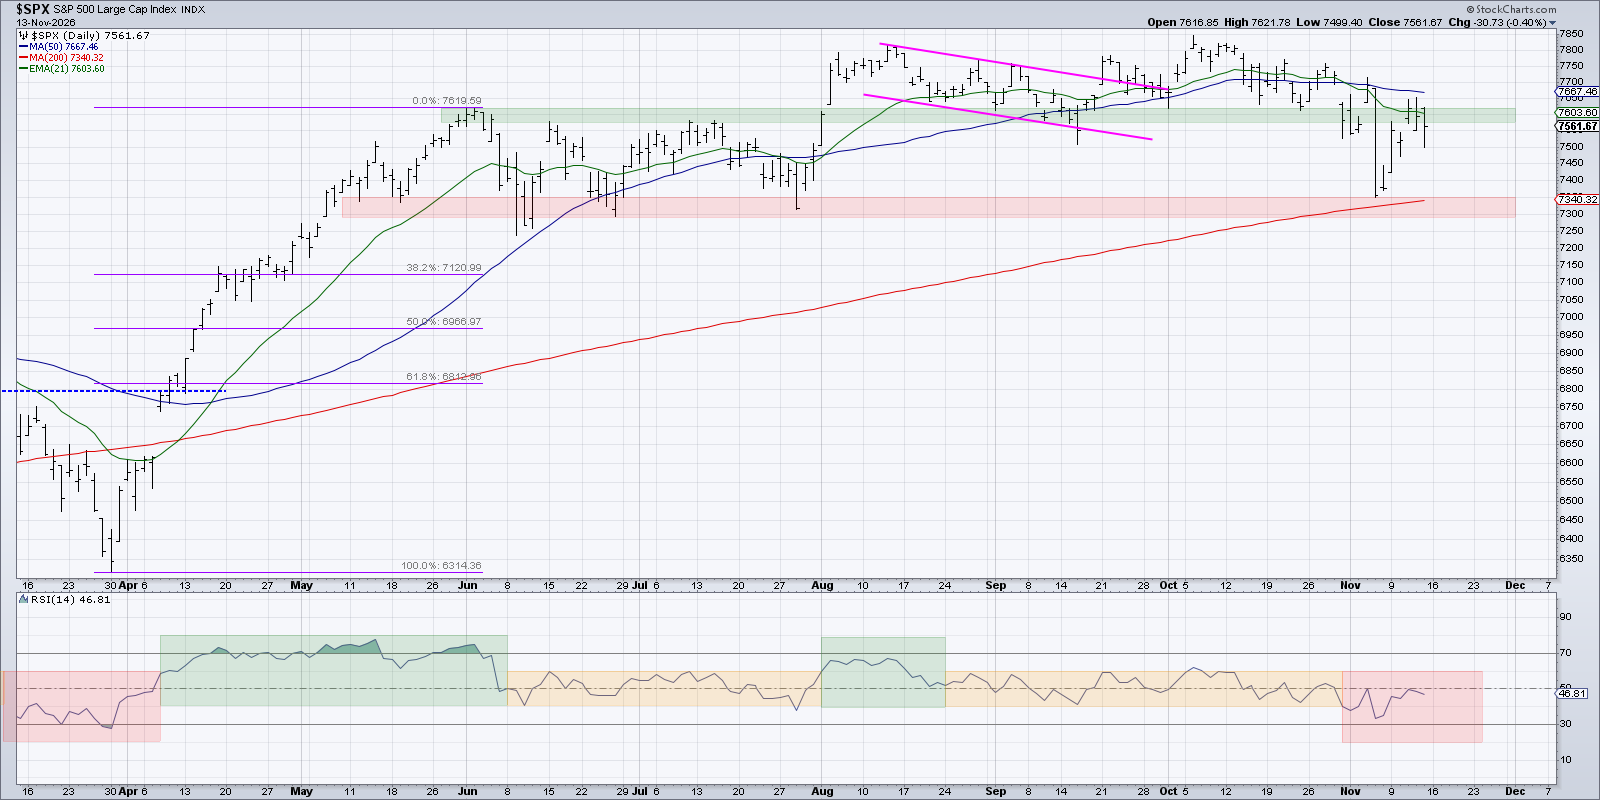
We’ve been keying in on the SPX 7600 level on our daily market recap show, which has helped us to recognize that the post-election downturn dropped the benchmark below this crucial support point. As we can can see, this week appears to be less of an “all clear” recovery and more of a retest of that previous breakdown level.
2. Follow the trend across sessions.
After we consider support and resistance levels, we can also evaluate the overall trend and how that trend has evolved based on recent price action. Quite simply, are the highs getting higher or lower? What about the swing lows? The trend in the price swings tells us the overall trend for the chart.
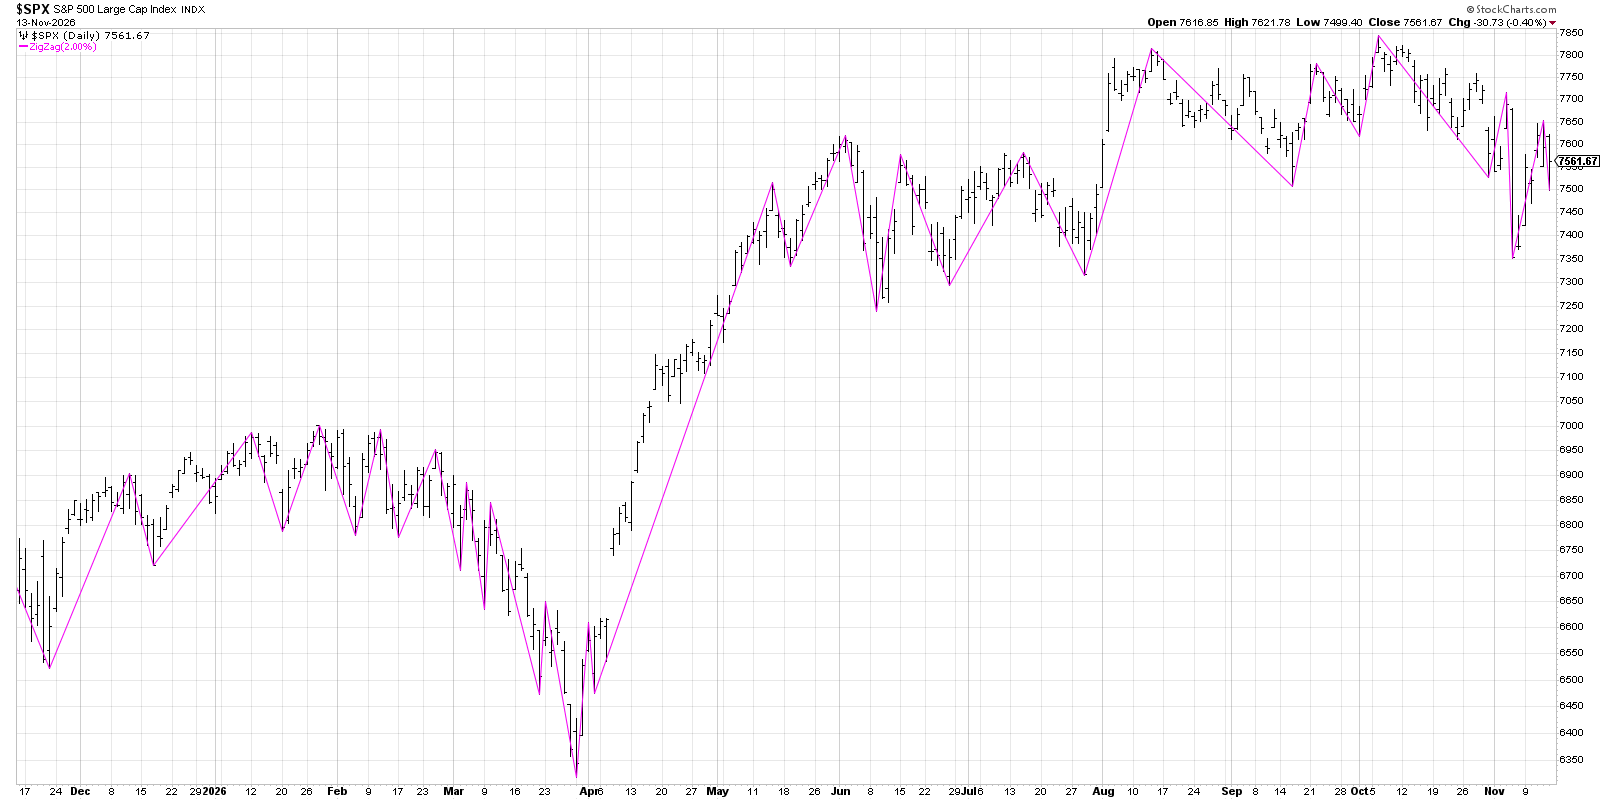
We’re using the ZigZag overlay, which highlights the significant price swings and allows you to consider the overall change in these price extremes. Now we can clearly observe that while the recent price action has indeed been volatile, there is also an underlying downtrend built by a pattern of lower highs and lower lows.
3. Start with the bigger picture.
As explained in one of the most valuable trading maxims I’ve ever heard, “When in doubt, zoom out.” If we’re getting too “in the weeds” with short-term price movements, let’s bring in way more data and start to consider how the recent swings relate to higher time frames and trends. My Market Trend Model is built on this idea of multiple time frame analysis and relating short-term to long-term trends and signals.
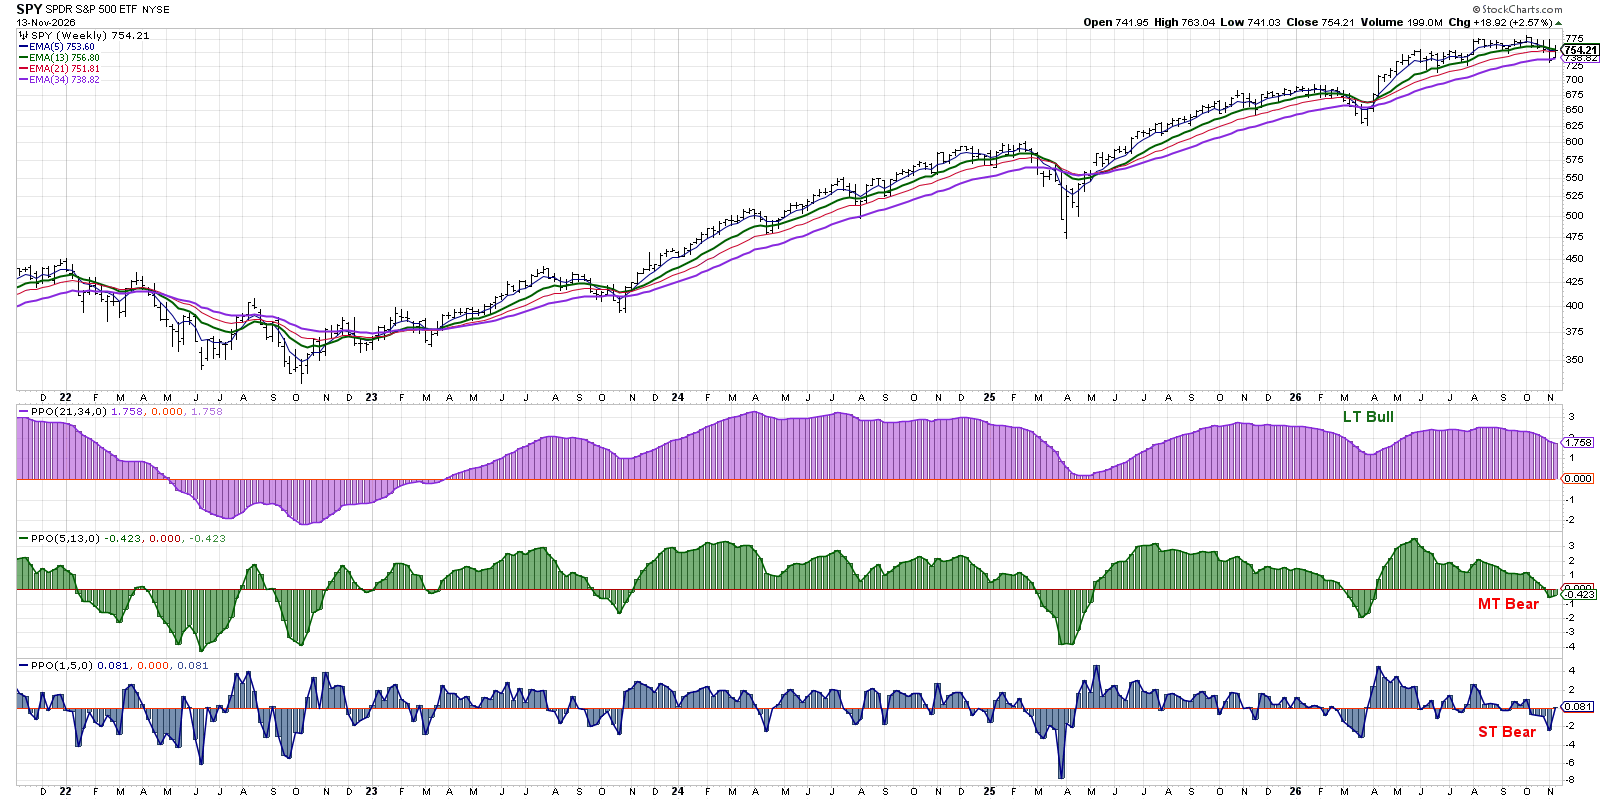
Our short-term trend model turned bearish in early October, soon after the initial pullback from SPX 7800. Our medium-term model finally turned bearish last Friday, as the 5-week exponential moving average (EMA) crossed below the 13-week EMA. Our long-term model turned bullish in March 2023 and remains bullish through this week.
Now we can start to understand how the short-term reversal off the all-time highs has finally matured into more of a medium-term distribution phase. When the short-term model is bearish but the medium-term trend is still bullish, I would describe the S&P 500 as experiencing a tactical pullback within a cyclical uptrend. Given the recent signal from our medium-term model, I’m comparing November 2026 to previous corrective periods and starting to consider deeper downside objectives for the S&P 500.
The real key to everything I just described is that it’s not about analyzing these three factors every once in a while, or just when you feel like it. The key to becoming a more mindful investor is to show up every day, review the evidence through the charts, and determine when the weight of the evidence has shifted. Based on our review of the evidence as this week comes to a close, we’re finding more reasons to be cautious.
RR#6,
Dave
P.S. Ready to upgrade your investment process? Check out my free behavioral investing course!
David Keller, CMT
President and Chief Strategist
Sierra Alpha Research LLC
marketmisbehavior.com
https://www.youtube.com/@DKellerCMT
Disclaimer: This blog is for educational purposes only and should not be construed as financial advice. The ideas and strategies should never be used without first assessing your own personal and financial situation, or without consulting a financial professional.
The author does not have a position in mentioned securities at the time of publication. Any opinions expressed herein are solely those of the author and do not in any way represent the views or opinions of any other person or entity.