StockCharts Insider: Turn Market News Into Actionable Setups
Before We Dive In…
Whether you trade for the short-term or long-term, the first thing you probably do every morning is check the headlines: CNBC, Bloomberg, Fox Business, or whatever suits you. We all do this, because markets react to information. And we don't want to be caught unaware of news that can wreck positions or cause us to miss opportunities.
News can provide important insights. But unless you know how to extract the right information and translate that into something useful, there may be a wide gap between news and action. This puts you in a reactive position, and at times it can be overwhelming. So, let’s fix that.
Translating News Into Actionable Insight
News gives you the narrative. Your job is to translate that narrative into context and, if things go well, a setup. In the end, the chart tells you whether the market buys the story. But you have to map it out.
Here’s a simple workflow you can use:
- Identify the main drivers
- Check the fundamental and technical context (Symbol Summary)
- Check the trend (trend + RSI range)
- Mark the key levels and map out the scenarios
- Compare it against the broader market, sector, and a handful of direct competitors
It’s clean, simple, and most importantly, repeatable. With that said, feel free to customize it. Tweak it, add to it, or subtract from it—whatever best fits your flow. Let’s run through each step.
Step 1: What’s the Market Reacting To?
Is the news about growth, earnings, guidance, positioning? Start by extracting the driving narrative—the one idea the market cares about most.
❗Caveat: This article is not about Uber Technologies, Inc. (UBER). I’m simply using it as an example.
Consider this CNBC headline (April 29, 2026): “Uber makes big bets on travel, hotels and AI voice bookings at annual product showcase.” You can look it up if you wish.
The core driver: The market is reacting to Uber’s push to expand beyond ride-hailing into multiple verticals as it builds a broader platform ecosystem.
Sure, there are several new products or “verticals,” but the messaging is simple: it’s a growth story. That’s all. Everything else is secondary.
Step 2: Check the Context (Symbol Summary)
Now, go to Symbol Summary and check everything that you feel is relevant to your stock. But whatever you do, be sure to check StockCharts Technical Rank (SCTR), earnings and revenue section, and the next earnings reporting date.
Let’s continue with our Uber example:
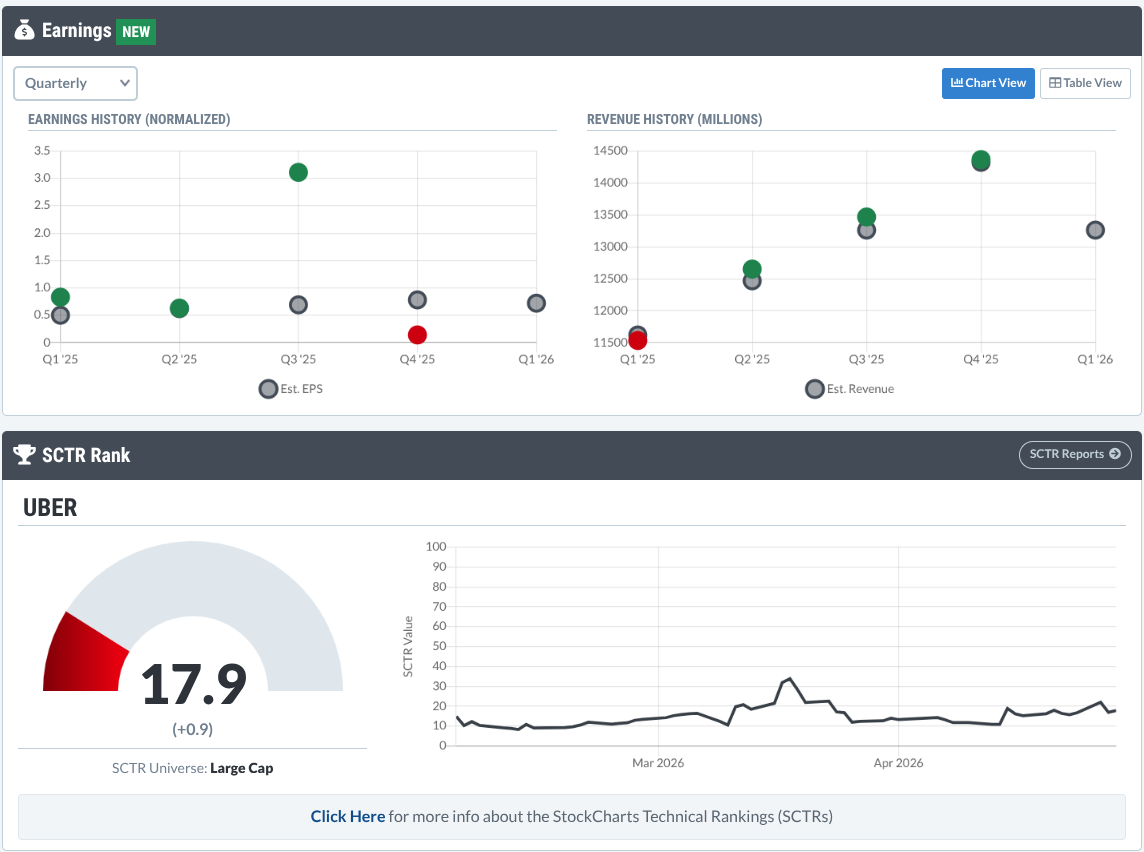
As you can see, earnings over the last four quarters were mixed, and revenue had been steadily increasing and above expectations over the last three. The SCTR picture appears quite dismal.
Overall, there’s no compelling fundamental or technical reason to be bullish yet, regardless of how the market responds to the news item.
But let’s suppose you were an UBER bull waiting for a reason to jump into the stock? What would you do next?
Step 3: Identify the Regime (Trend + RSI)
If any development makes it into the news, it’s generally bullish or bearish. Every now and then, you’ll get something neutral, but that’s typically to temper something that’s been overhyped either way.
The same can be said of price. Its current condition as well as its potential outcomes can either be bullish, neutral (sideways), or bearish. So, start with the current conditions. Is it trending?
A simple way to do this is as follows:
- Check the trend structure.
- Check the Relative Strength Index (RSI) range to gauge momentum.
Our simple aim is to determine whether a stock is trending up, down, or moving sideways.
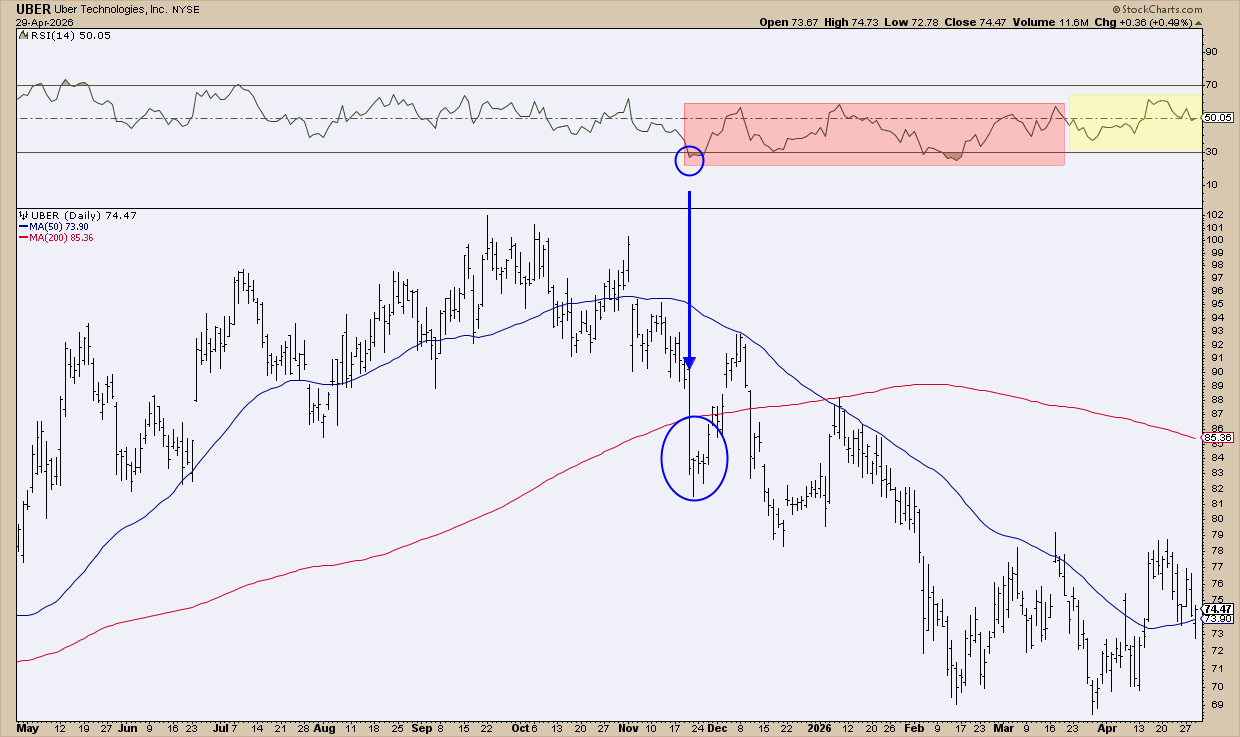
From May to September, Uber trended higher. The uptrend was volatile, eventually losing and topping out around October. A four-month downtrend began in November.
Now look at RSI. Once it broke below 30, it stayed capped near 60—a classic bearish range.
From February onward, price shifted into a wide trading range, signaling that downside pressure was fading. RSI confirmed this momentum change (see yellow shaded area).
Now step back.
The news article signaled UBER’s growth strategy through introducing new vertical products to create a super-app: driverless cars, hotel bookings, grocery delivery, etc. The question is: will the market buy the story? If it does, which key level might confirm the shift in sentiment has real conviction behind it? The next step should answer that.
Step 4: Mark the Key Levels and Map Out the Scenarios
As you know, you can’t predict THE outcome in a given market. But you can prepare for all potential outcomes simply because there are generally only three outcomes in the near term: bullish, neutral, or bearish.
What you’re looking out for:
- Breakout level (prior swing high)
- Trading range (chop levels)
- Breakdown level (prior swing low)
Simply put, a sustained following a breakout is bullish. Movement within the trading range is neutral. Sustained downward movement following a breakdown is bearish.
Once one of these outcomes materializes, you’ll want to use the RSI to confirm.
For UBER, let’s keep this simple:
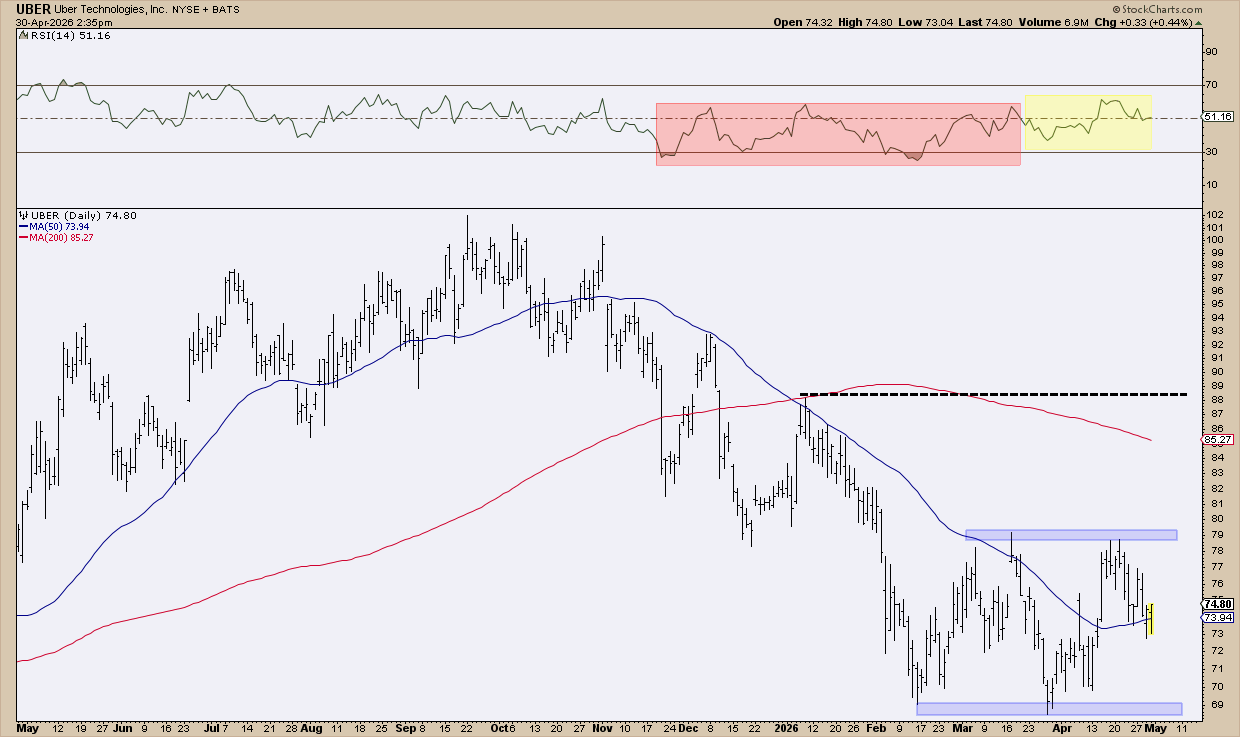
- Above $79 -> First sign of bullish intent
- Back into $69–$79 -> Likely false breakout (back to neutral)
- Below $69 -> Bearish control, downside risk expands
Those are the key levels.
If bulls take control, a breakout above $79 isn’t enough on its own. You want to see price reclaim and hold above the 200-day SMA. You’ll want to eventually see the 50-day SMA cross above the 200-day SMA (golden cross) for confirmation. And RSI should stabilize in the 40–70+ range (bullish RSI range). If you can check off those boxes, the next resistance level sits near $88.
As things stand now, it’s neutral to bearish (nothing good happens below the 200-day SMA, plus you’ve got a death cross).
Step 5: Compare It Against the Broader Market, Sector, and a Handful of Direct Competitors
Before I make any decision on a stock, I typically like to check its performance against the broader market, sector, and a few direct competitors.
I’m not going to overthink this. I just want to get some context. And if the situation looks supportive, then I’d consider a given stock as a potential trade candidate. If not, I wait or look for something else.
Let’s compare UBER’s price performance against SPY (broader market), XLK (tech sector), LFYT (direct competitor) and DASH (direct UBER Eats competitor).
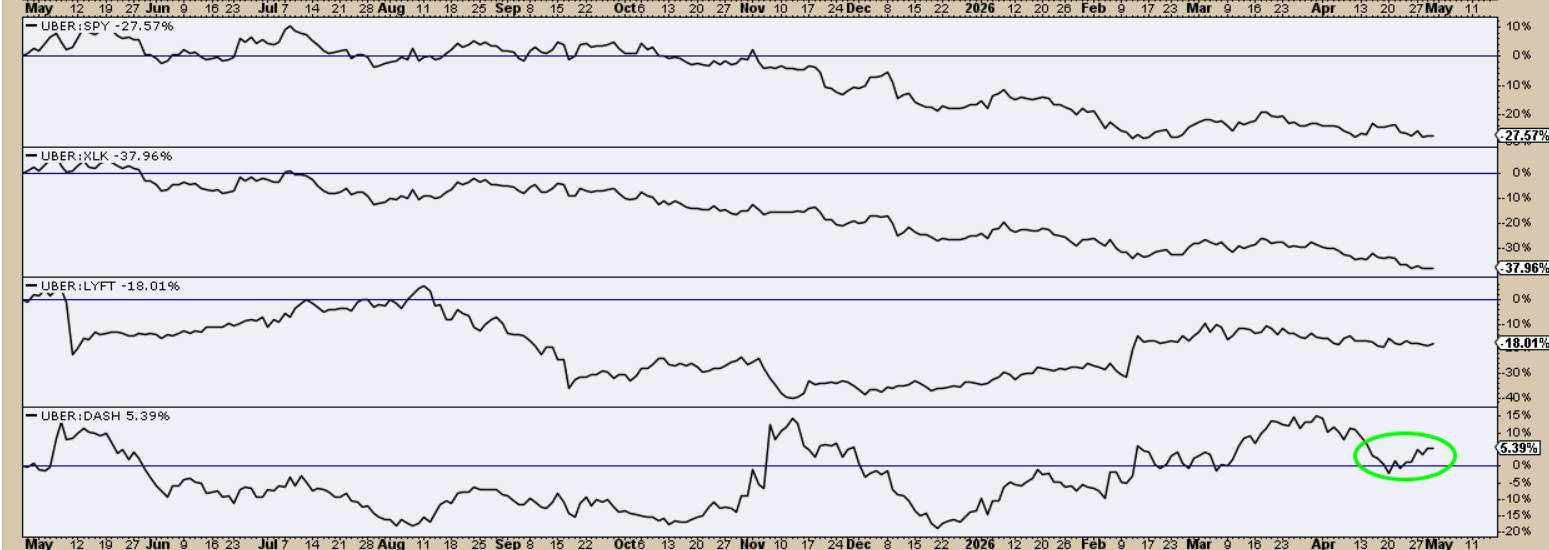
As you can see, UBER is underperforming everything except for DASH, which it’s barely leading. Will its newly announced growth strategy lift it? The narrative itself doesn’t matter. Price will have to confirm it. But now you’ve got the levels mapped out.
Insider Tip #1: Watch the second move, not just the first. The first move can often be highly charged with sentiment. The second “move,” which often takes place over the next few sessions, reveals commitment, or lack thereof. In short, movement after the news tends to matter more than the initial reaction.
Insider Tip #2: Strong moves often down revisit breakdown levels. Breakouts with true conviction often hold. This is when sentiment, fundamentals, and institutional capital drive movement. Weak breakouts do the opposite: they stall, fade, and often retest the breakout level (now support). So if you’re sitting back waiting for a clean pullback entry, understand the trade-off: the stronger the move, the less likely it’ll come back.
Insider Tip #3: When news aligns with trend, moves extend. Bullish news for an uptrending stock tends to fuel its continuation. The opposite is true for a declining stock. When the stock is neutral, like our UBER example, bullish or bearish news can either shake it out of its sideways neutrality, or it can remain in limbo. Whatever the condition, mapping out key levels is a critical step to fine-tuning decision points.
And That’s a Wrap
The next time a headline catches your attention, which is pretty much every day, you'll now know better than to chase it. Instead, translate it. Map it out. No FOMO. Just pure strategy.