Consumer Staples is Outperforming Again. Is It a Warning Sign for Stocks?

Key Takeaways
- Tech & Energy have led the S&P 500 in the past month, but Staples has joined the alpha party.
- Walmart & Costco dominate, which dampens the cautionary signal from XLP:SPY.
- With earnings on tap, I outline key price levels to monitor for the two Staples stalwarts.
All eyes are on NVIDIA (NVDA) Wednesday night, but don’t lose sight of Walmart (WMT)’s importance before the bell on Thursday. The Consumer Staples behemoth is likely to show solid same-store sales growth from a year ago, while many other retailers struggle amid rising energy costs and a choiceful consumer. Target (TGT), meanwhile, offered a dose of optimism with its February–April numbers.
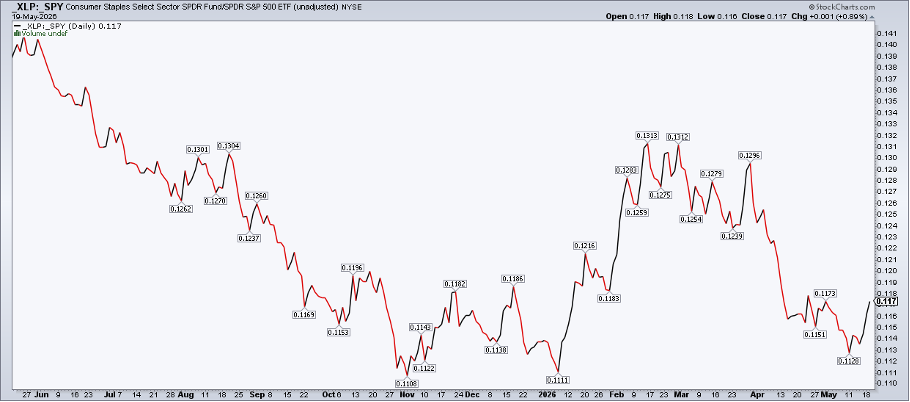
Big picture, and beyond this week’s earnings, the Consumer Staples Select Sector SPDR ETF (XLP) has quietly staged a solid Q2 rally, recent market weakness notwithstanding.
Defensive Leadership Creeps Back
In fact, XLP joined the Technology Select Sector SPDR Fund (XLK) and the Energy Select Sector SPDR Fund (XLE) in outperforming the S&P 500 over the past month. The defensive consumer niche’s strength has been far from an all-skate, though.
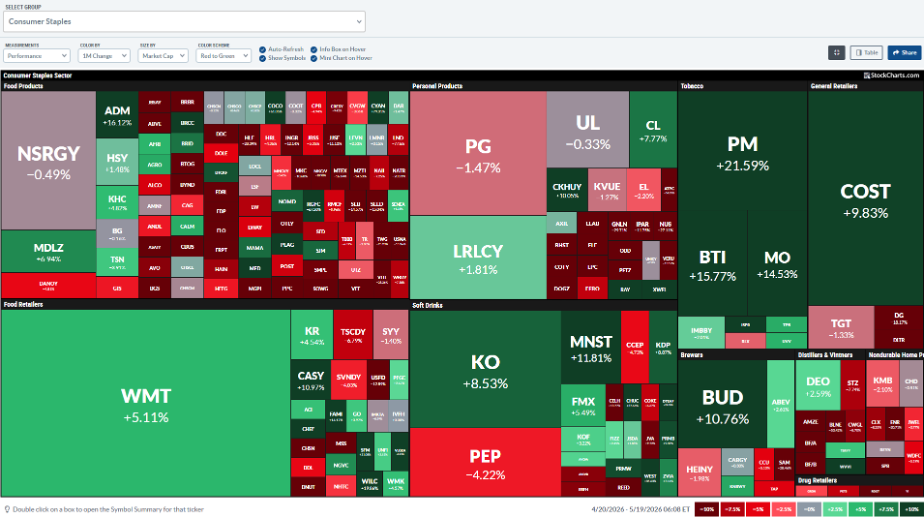
StockCharts’ Consumer Staples MarketCarpet illustrates the point. WMT, Costco Wholesale Corporation (COST), and tobacco stocks light up green on the screen. There’s a shopping cart full of red, including dozens of Food Products names and Personal Products equities.
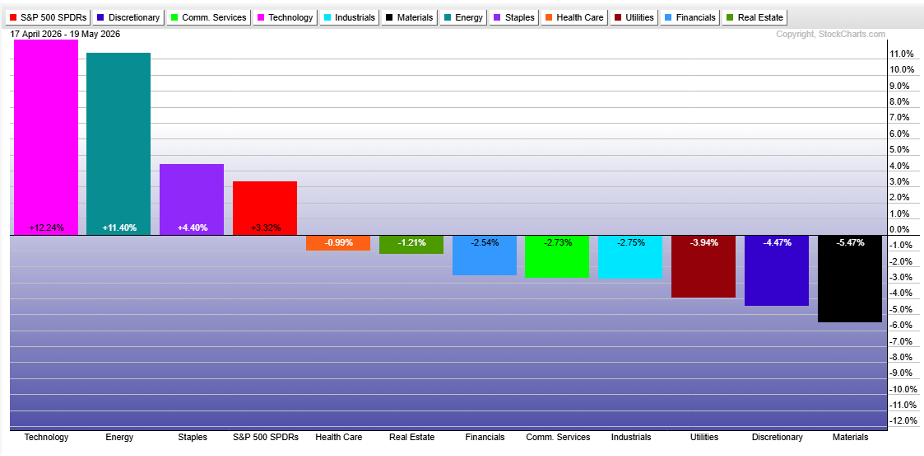
Staples is a microcosm of today’s market: highly concentrated, with unappealing breadth. But compared to the S&P 500, XLP continues to find support at its early-November 2025 all-time low. Remarkably, there’s an ever-so-small degree of relative strength since the middle of 2025’s fourth quarter. The major alpha burst occurred from January 8 to February 13, throughout the heart of the Q4 earnings season and before the conflict in Iran.
Traditionally, the bulls don’t want to see XLP outperform as the S&P 500 rolls over. That’s the classic risk-off sector rotation trade. Earlier this year, XLP’s jump was nothing to sweat, as it coincided with a higher SPX. It’s more uncertain this time. There’s also nuance right now, given XLP’s makeup and current leaders.
Walmart Looks Like a Mega-Cap Tech Stock
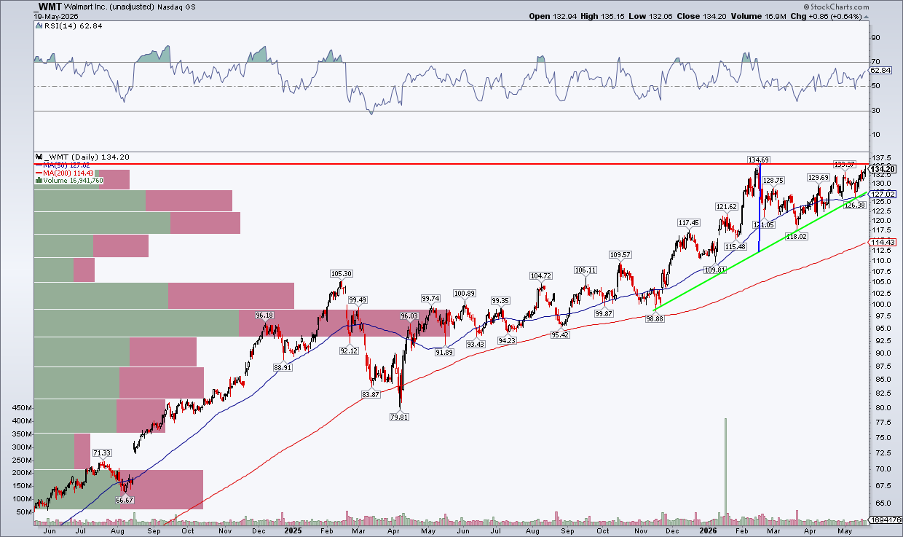
First, WMT trades very well ahead of fiscal Q1 2027 earnings on Thursday morning, followed by its Annual General Meeting on Thursday, June 4. It was one of just 20 S&P 500 stocks to settle at a 52-week high on the penultimate session before its earnings, bringing its market cap to a cool $1.06 trillion. Technically, it’s doing all the right things.
Notice in the chart below that old Wally sports one of the best uptrends you’ll find in today’s market of wild single-stock volatility. The long-term 200-day moving average is on the rise, suggesting that the bulls control the primary trend. Furthermore, an ascending triangle may resolve to the upside if we see a positive earnings response ahead of Memorial Day weekend. Traders can target about $155 as an upside measured move price objective based on the height of the triangle at its onset, added onto the presumed $135 breakout level.
Also, take a look at the RSI momentum oscillator at the top of the chart. It’s decent in the 60s, but I’d like to see a thrust above 70 upon a breakout to confirm a rally. If we see a negative reaction, look for support near $127, where the 50-day moving average is found and where the uptrend line resides.
Not Your Traditional Staples Stock
Walmart is not a pure Staples play, like Philip Morris International Inc. (PM), Procter & Gamble Company (PG), and Coca-Cola Company (KO). Its vast technology infrastructure and AI prowess give the stock I.T. vibes, which buttress the company’s switch to the Nasdaq 100 earlier this year.
Costco and the K-Shaped Economy
Another Consumer Staples component that doesn’t always zig and zag with the average sector stock is COST. The wholesale club sampled record highs this week, hurdling previous resistance in the $1067–$1078 zone. Just as WMT boasts exposure to the AI megatrend, COST centers on the higher-income cohort.
The upper dash of the K-shaped economy continues to spend, unimpeded by $4.50-plus at the pump. The company arguably benefits from rising gas prices, as you won’t find a cheaper gallon of regular unleaded than outside a Costco warehouse. Indeed, since RBOB Gasoline Futures bottomed last December, COST is up 30%.
Is Costco Primed for a Breather?
But is a pause due? The chart of Costco's stock price reveals a potential speed bump at $1100. The breakout through $1030 triggered an $1100 target, based on the $70 range from February through early May. RSI momentum is stellar, confirming the record price level, and there’s now a large amount of volume-by-price beginning in the low $1000s.
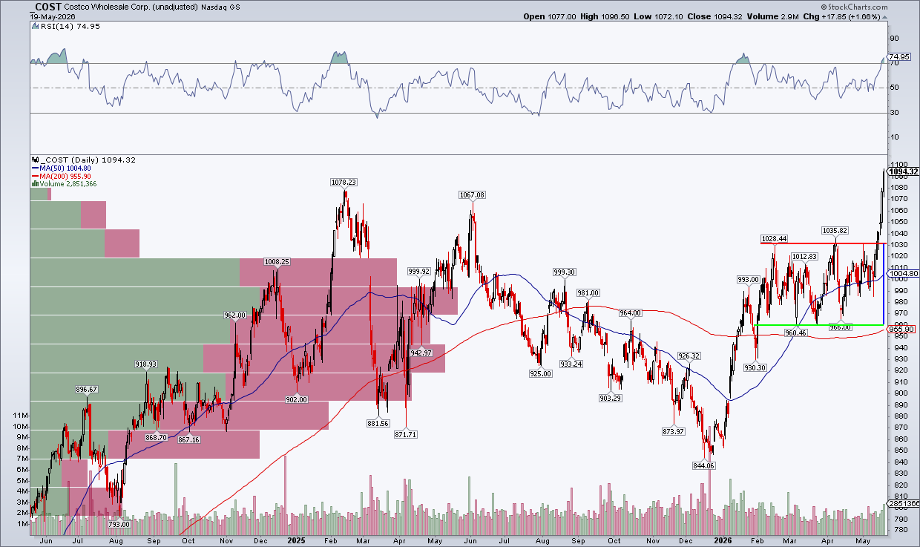
It’s a classic buy-the-dip idea, with the previous all-time high range from 2025 not far below today’s price. Up six sessions running coming into Wednesday, Costco reports its fiscal Q3 2026 earnings on Thursday, May 28, along with May same-store sales after the close on Wednesday, June 3. Also, don’t discount the chance of a stock split announcement on the thousand-dollar stock.
The Consumer May Not Be Cracking Yet
So, with generally constructive WMT and COST charts, I’m not worried about Consumer Staples perking up on both an absolute and relative basis. While retail and so many other small- and medium-sized Consumer Discretionary stocks struggle, I don’t think it’s time to dismiss the consumer altogether.
From a macro perspective, a potentially improving jobs market could lift the mood. Households will take all the help they can get as excess savings from tax refunds dwindle, and a possible 5% CPI print looms.
The Bottom Line
Consumer Staples has emerged as a market leader over the last month. Away from large-cap Information Technology and Energy, the average U.S. and international stock is decidedly down month over month. WMT and COST lead the way in Staples, and each has an earnings volatility catalyst on tap. Those charts are in play, and it’s crucial to monitor trends in XLP:SPY ahead of the historically tough month of June for the S&P 500.
Add a chart of the Consumer Staples Select Sector SPDR ETF to your ChartLists. Customize it with your preferred indicators.
Disclaimer: This blog is for educational purposes only and should not be construed as financial advice. The ideas and strategies should never be used without first assessing your own personal and financial situation, or without consulting a financial professional.