StockCharts Insider: The DecisionPoint Trend Model, Unpacked
Before We Dive In…
You open your charts on a Monday morning, bad week behind you. And it turns out this one’s worse. Positions are under pressure, with one reversing badly. So you check the indicators. Trend says one thing; momentum says another. Volume’s no help this time. They all disagree. You’re flying blind.
The DecisionPoint Chart Gallery fixes this. It stacks daily, weekly, and monthly trend reads together. It keeps you from guessing off of just one chart, or off one fixed set of indicators.
Three Ways to View the Trend. One Hierarchy.
The DecisionPoint Chart Gallery opens with three trend charts: Daily, Weekly, and Monthly. All of them read the same market, but each focuses on a different angle of the story.
Although they’re three separate readings, they operate under a single hierarchy:
- The long-term trend sets your strategic position.
- The intermediate- and short-term trends are where you make tactical moves.
If you’re wondering how it defines these trend durations, short-term means days to weeks, intermediate-term means weeks to months, and long-term means months to years.
One more thing. The Gallery defaults to the S&P 500, but you can toggle between the DJIA, Nasdaq 100, and S&P 100. For instance, if your portfolio skews tech-heavy, the Nasdaq 100 may be the better read.
Daily Trend Analysis: Four EMAs and One Oscillator
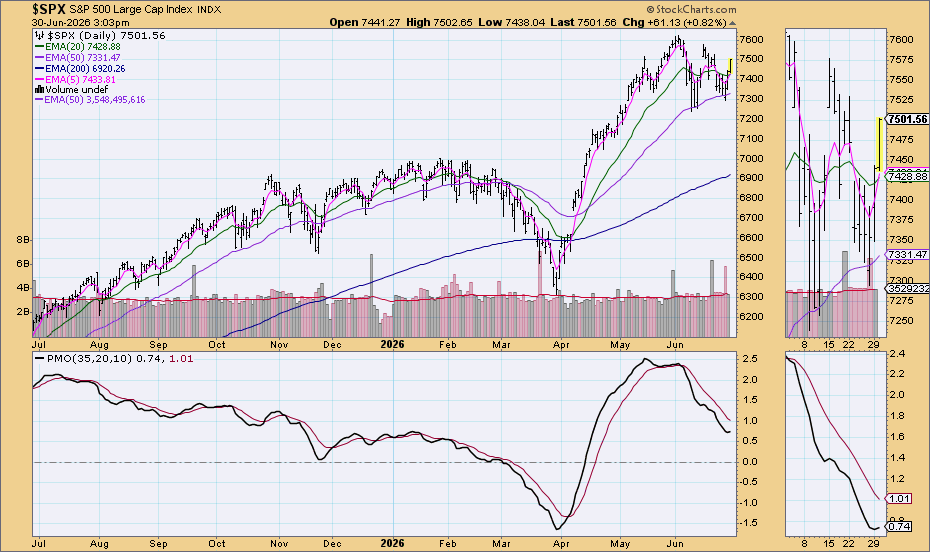
The Daily chart does mostly short-term trend work, but it does reflect on the other trend hierarchies as well. Here’s the complete rule set:
- 50-EMA above 200-EMA = long-term trend is bullish
- 20-EMA above 50-EMA = intermediate-term trend is bullish
- 20-EMA moving higher = short-term trend is bullish
- 5-EMA crosses above 20-EMA = bullish short-term trend change
- 5-EMA crosses below 20-EMA while 20-EMA is above 50-EMA = neutral
- 5-EMA crosses below 20-EMA while 20-EMA is below 50-EMA = bearish sell signal
- PMO rising = trend is bullish
- PMO above its signal line = trend is strongly bullish
It’s a lot of rules. But, at the same time, it really isn’t. The logic repeats. Read through it, and it’ll all make perfect sense.
Insider Tip #1: Wait for the Close.
The DecisionPoint model was designed for end-of-day readings. A mid-day read can generate false crossovers that disappear by 4pm. So just avoid it.
Insider Tip #2: 5/20-EMA Crossovers Fire Frequently.
If you used moving averages in the past, you already know this. Use the 5/20 crossovers as confirmation, not the main signal, as it can change after you pull the trigger.
Weekly Trend Analysis: Filtering the Noise
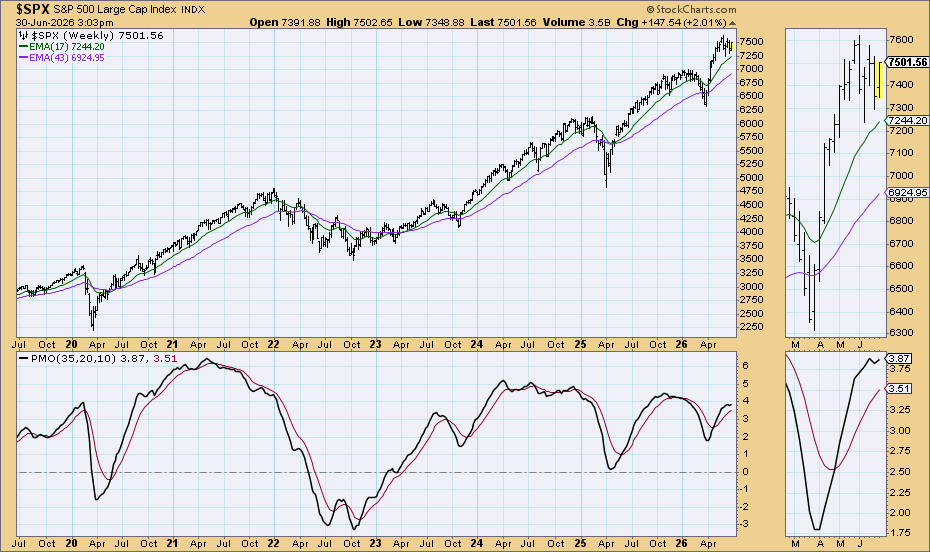
The Weekly covers seven years by default and has two EMAs: the 17-week and the 43-week. These numbers may seem odd, but they’re equivalent to the daily 50-EMA and 200-EMA.
Here’s a rule set for the Weekly:
- 17-week EMA above 43-week EMA = long-term trend is bullish
- 17-week EMA below 43-week EMA = long-term trend is bearish
- PMO rising = trend is bullish
- PMO above its signal line = trend is strongly bullish
When 17 crosses 43, something structural has changed. Don’t mistake it for a headline reaction or a temporary sentiment shift.
Remember, context is everything. For that, you have to compare charts. If the daily chart is flashing a warning sign, but the weekly trend is still firmly intact, you’re not looking at a structural change. This way, the weekly chart will keep you from overreacting.
The reverse is true as well. If the weekly chart signals a structural shift, it’ll keep you from following the crowd that’s looking only at the daily, short-term price action.
Insider Tip #3: Weekly Signals are Harder to Fake.
Moving average crossovers come and go on daily charts, even moreso in shorter timeframes. But a 17/43-week crossover means a real change may be in play. It’s never a guarantee, but the probabilities are much higher.
Monthly Trend Analysis: The Big Picture
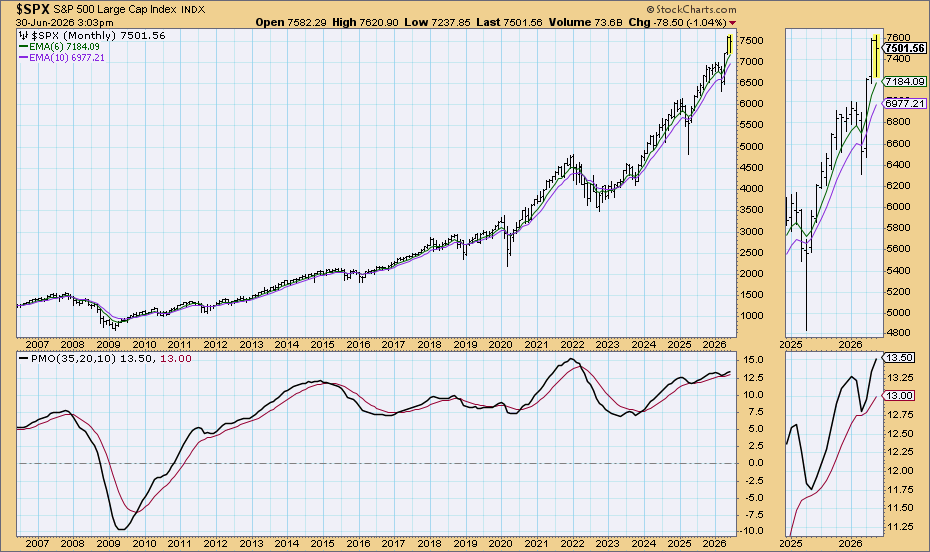
Zoom out. All the way. The Monthly chart covers twenty years and runs two EMAs: the 6-month and the 10-month. These two EMAs run on their own logic, not correlated to the Daily or Weekly. They’re simply measuring the averages for half a year and nearly a full year.
The rule set:
- 6-month EMA above 10-month EMA = long-term trend is bullish
- 6-month EMA below 10-month EMA = long-term trend is bearish
- PMO rising = trend is bullish
- PMO above its signal line = trend is strongly bullish
The stakes are different on this timeframe. A monthly EMA crossover isn’t a mere trade signal. It’s more like a regime signal that gives clues about the macroeconomic conditions underlying the economy. We’re talking economic cycles—expansion, peak, contraction (recession), and recovery. So this can tell you whether the broader economic backdrop is working in your favor or against you.
Insider Tip #4: Don't Read Monthly Signals Mid-Month.
Similar to our warning about end-of-day readings, wait for the end of the monthly close before confirming a signal. A crossover forming on the 15th may look completely different by the 31st. Yes, it’s slow. But if you’re looking at the monthly timeframe, you already know this. You’re probably a long-term investor. In your case, waiting a few weeks shouldn’t be that hard.
And That’s a Wrap
The DecisionPoint Trend Model asks you to read the trend across different timeframes. Daily gives you the immediate picture, weekly helps filter the noise, and monthly keeps the long arc in view. Also, remember that bullish and bearish aren’t the only two options; there’s the neutral signal, which, if you don’t get tripped up, can present opportunities.
Oh, and that reversal from Monday morning—run it through all three timeframes before you decide what it actually is. That's how the fog clears.