Stocks Turn Lower After the Fed: Key Levels That Matter Now

Key Takeaways
- Post-Fed weakness puts key SPY and QQQ support levels in focus.
- Momentum is slowing, but the stock market has not reached panic territory.
- Rising Treasury yields, oil prices, and volatility remain important risks.
A quarter-percentage-point rate hike was what the stock market expected. But judging by the price action during Fed Chair Kevin Warsh’s press conference, it was clear investors didn’t hear everything they wanted.
S&P 500's Bearish Tilt
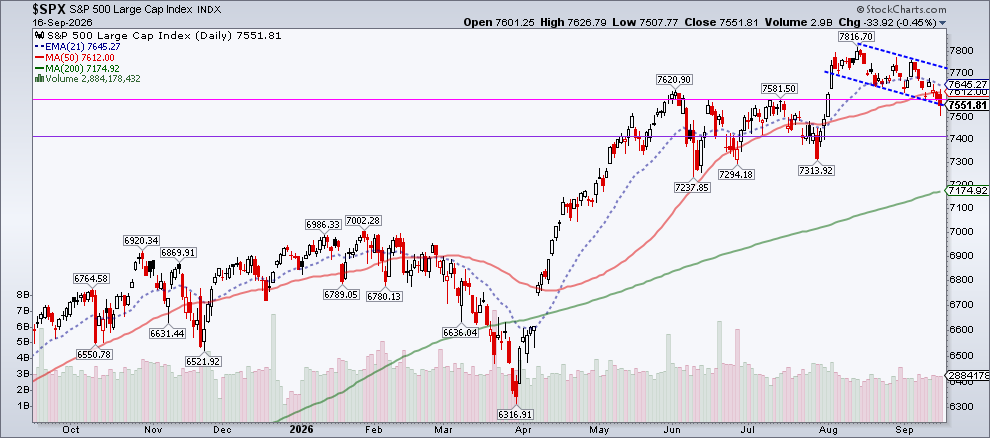
The S&P 500 ($SPX) fell below the initial support level I’ve been watching. Although the index recovered some of the loss, it still closed below that level and near the lower end of the channel marked by the blue dashed lines. For now, that gives the market a downward bias.
Wednesday’s price action prompted me to take a closer look at the SPDR S&P 500 ETF (SPY). On the daily chart, SPY is trading below its 50-day moving average. The Relative Strength Index (RSI) and Percentage Price Oscillator (PPO) are showing signs of slowing momentum. SPY traded within a range from June through August, and Wednesday’s close pushed price back into that range.
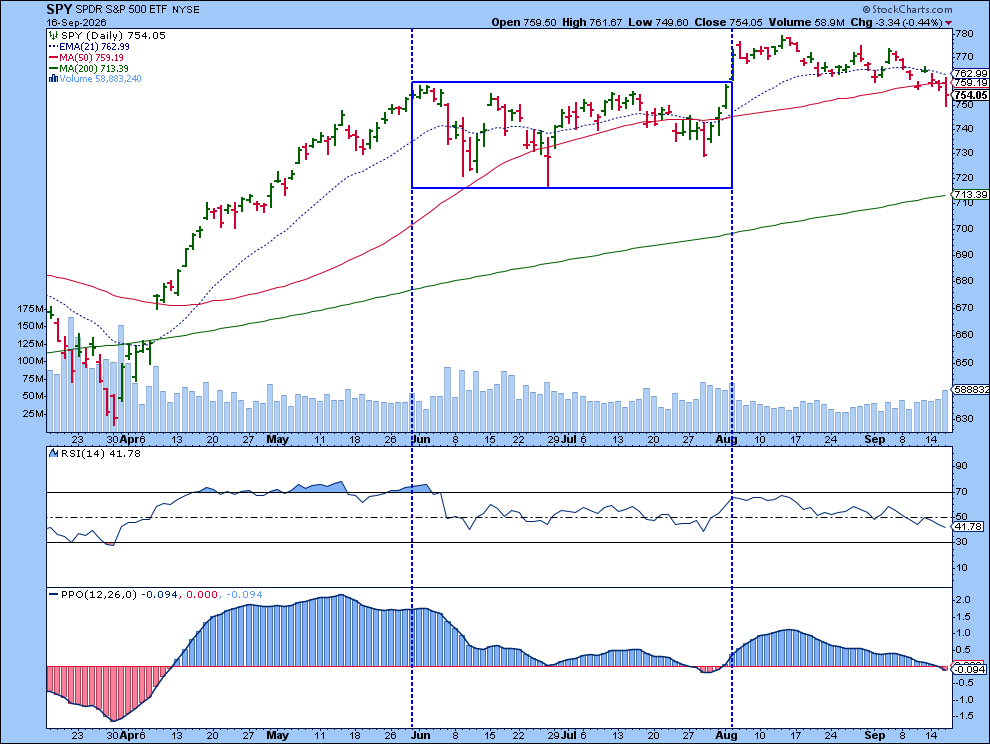
It’s worth noting that RSI didn’t fall below the 30 level during the deeper pullbacks in late June and July. Similarly, PPO didn’t fall too far into oversold territory during those pullbacks. Buyers stepped in before momentum deteriorated too much.
It's possible we could see something similar happen this time. However, if the selling continues, RSI drops below 30, and PPO moves deeper into negative territory, there would be a more concerning development.
QQQ's Narrowing Range
Technology stocks could play a big role in what happens next, especially after comments from AI leaders about slowing the development of AI capabilities. The chart of the Invesco QQQ Trust (QQQ) is showing a setup similar to SPY.
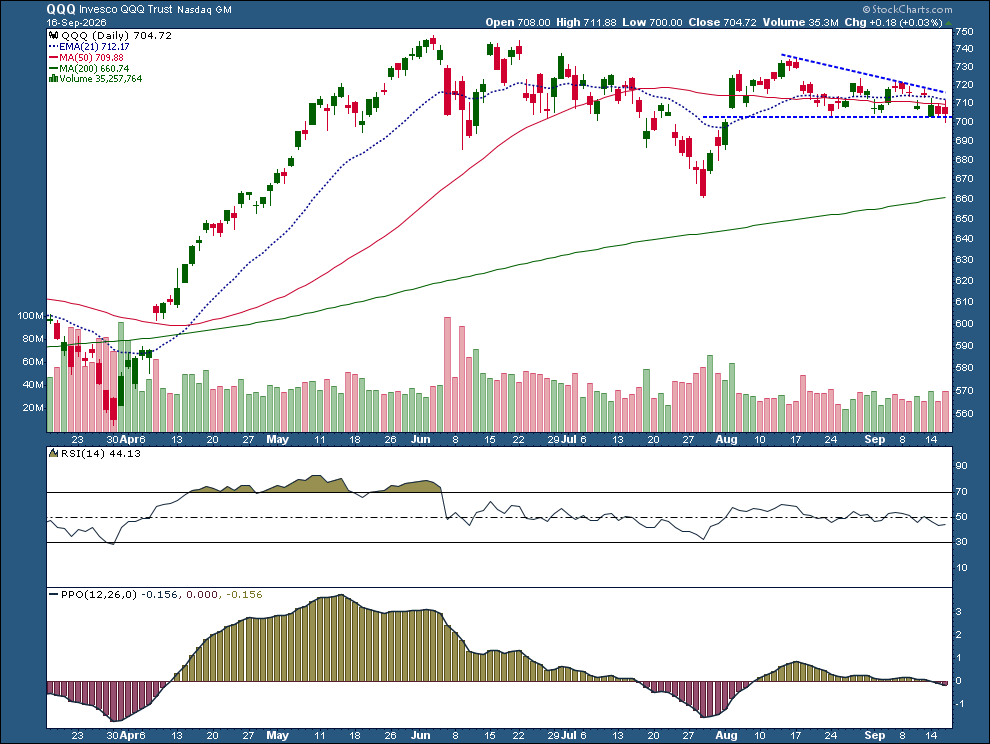
The 700 level is important to watch. If QQQ breaks below it and momentum deteriorates sharply, further weakness could follow. On the other hand, if QQQ breaks out above its range with strengthening momentum, tech stocks could once again help pull the broader market higher.
Yields, Oil, Volatility
Tech isn’t the only thing investors need to watch, as treasury yields continue to climb. The 10-Year U.S. Treasury Yield Index ($TNX) is above 5%, a level it hasn’t seen since 2007. Oil prices are also high and could remain elevated as the U.S.-Iran conflict continues. There’s also the Bank of Japan’s interest rate decision later this week, which could impact the U.S. market.
Volatility is picking up as well. The Cboe Volatility Index ($VIX) climbed to nearly 19 on Wednesday before pulling back to close at 17.71.
The Bottom Line
There are a lot of moving parts in this market. Wednesday’s post-Fed price action had a bearish tilt, but it wasn’t enough to trigger panic selling. It was relatively orderly, which indicates the market is showing weakness but not capitulation.
However, rising Treasury yields and oil prices could continue to put pressure on equities. Keep a close eye on SPY and QQQ momentum, especially around the key price levels. With options expiration coming Friday, don’t be surprised if volatility remains elevated.
Disclaimer: This blog is for educational purposes only and should not be construed as financial advice. The ideas and strategies should never be used without first assessing your own personal and financial situation, or without consulting a financial professional.