The Great Tech Bull Market of 2026: How Dominant Is Technology?

There’s no denying that the technology sector has been top of mind for investors, with days like Friday appearing to confirm that this market is basically technology… and then everything else. Semiconductor stocks have been absolutely on fire, and now even some of the software names are joining in on the bullish trend.
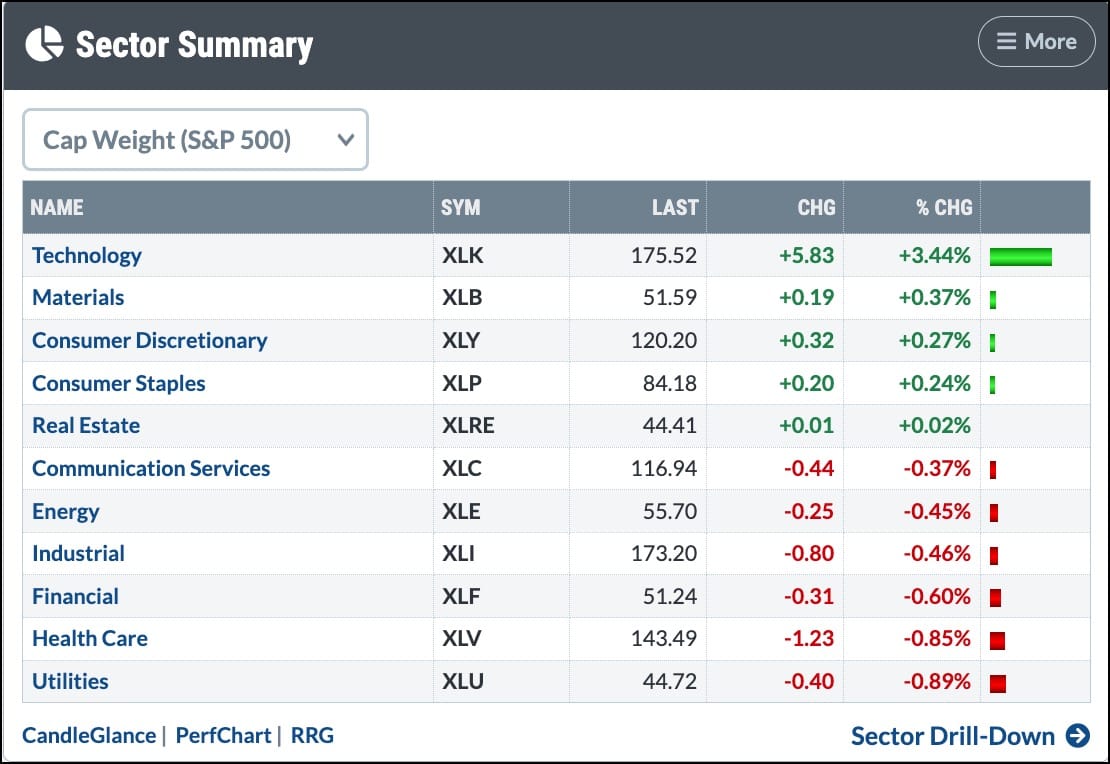
Here are the sector returns for Friday, May 8th, showing the Technology Sector SPDR (XLK) up 3.4%, with the rest of the 11 S&P 500 sectors with a return below +0.4%.
So how much has the Technology sector really impacted market returns in 2026? We’ve put together a series of charts from the StockCharts platform to dig into this leadership theme, from sector breadth indicators to industry group trends. We’ll also share some potential warning signs that could signal that the Great Tech Bull Market of 2026 is losing its luster!
How would the S&P 500 be doing without technology?
I’ve found that the ProShares S&P 500 Ex-Technology ETF (SPXT) can provide some great insights into how important this one sector has been for the performance of the index as a whole. And a quick review of this chart shows how the picture changed dramatically since the end of March.
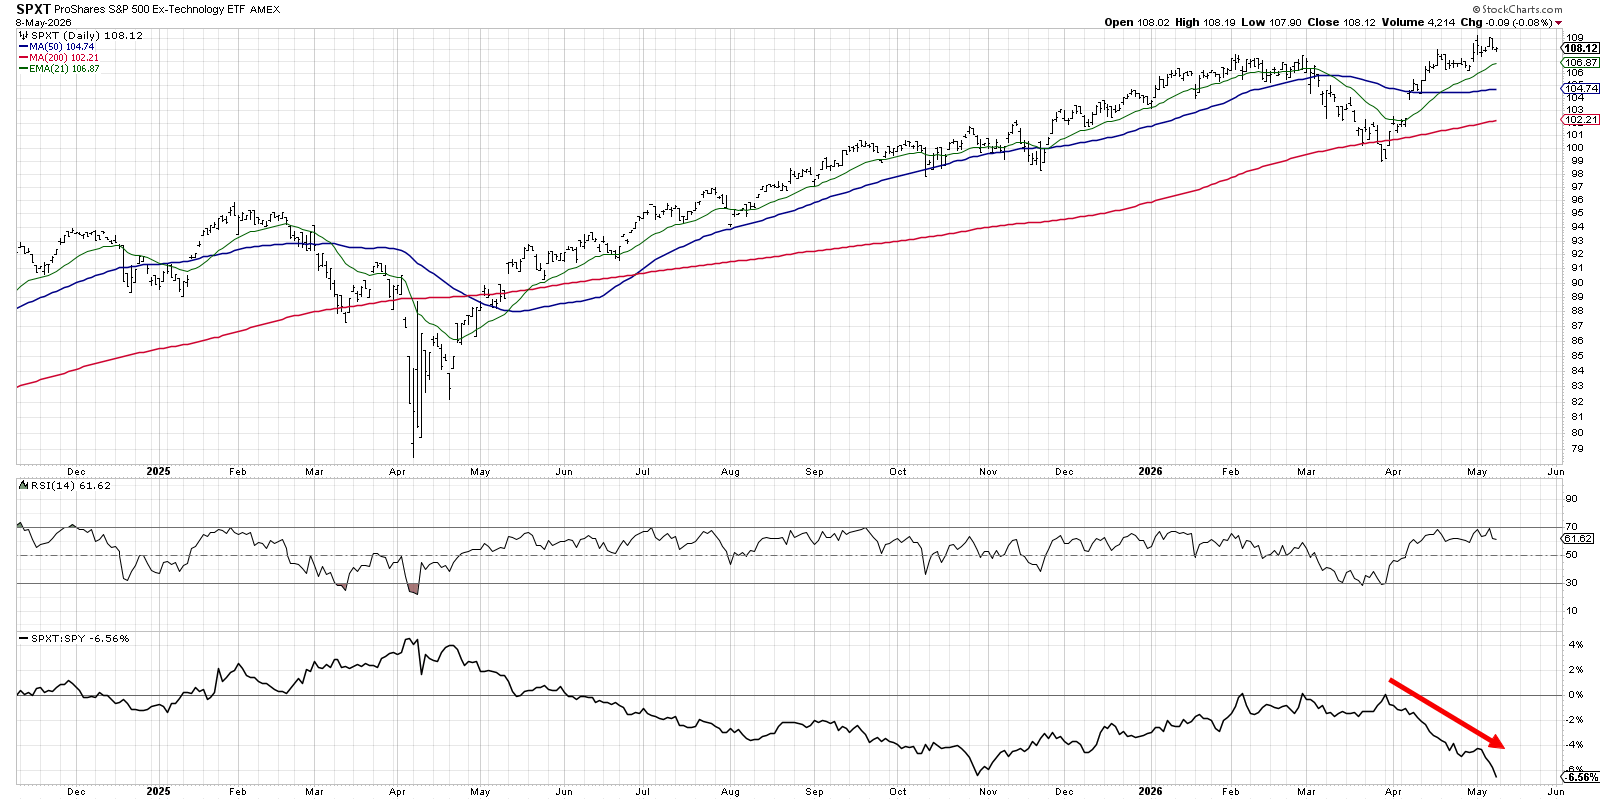
This ETF basically tracks the performance of the S&P 500 index, but without the members of the technology sector. While the general trend appears similar to the S&P 500 index itself, we can determine the relative performance of this “everything but tech” ETF by focusing on the relative strength line at the bottom.
The relative strength was trending lower from the April 2025 market low through the end of October 2025. While the broad indexes were moving higher, tech was just performing consistently better. From late October to the end of March 2026, the upward trend in relative strength indicates how much sectors outside of technology provided better return opportunities.
For the last six weeks, the relative strength has turned back lower with a significant downward slope. We are back to conditions last seen in mid-2025, with the technology sector outperforming the rest of the index. So the cost of not owning technology stocks has been significant for investors!
Which breadth indicators can help understand tech leadership?
The Bullish Percent Indexes are market breadth indicators that track the percent of stocks in different buckets that are showing a bullish signal on their point & figure charts. Here, we’re showing the BPI for the S&P 500 Technology sector, along with the BPI for the Nasdaq 100 and the S&P 500.
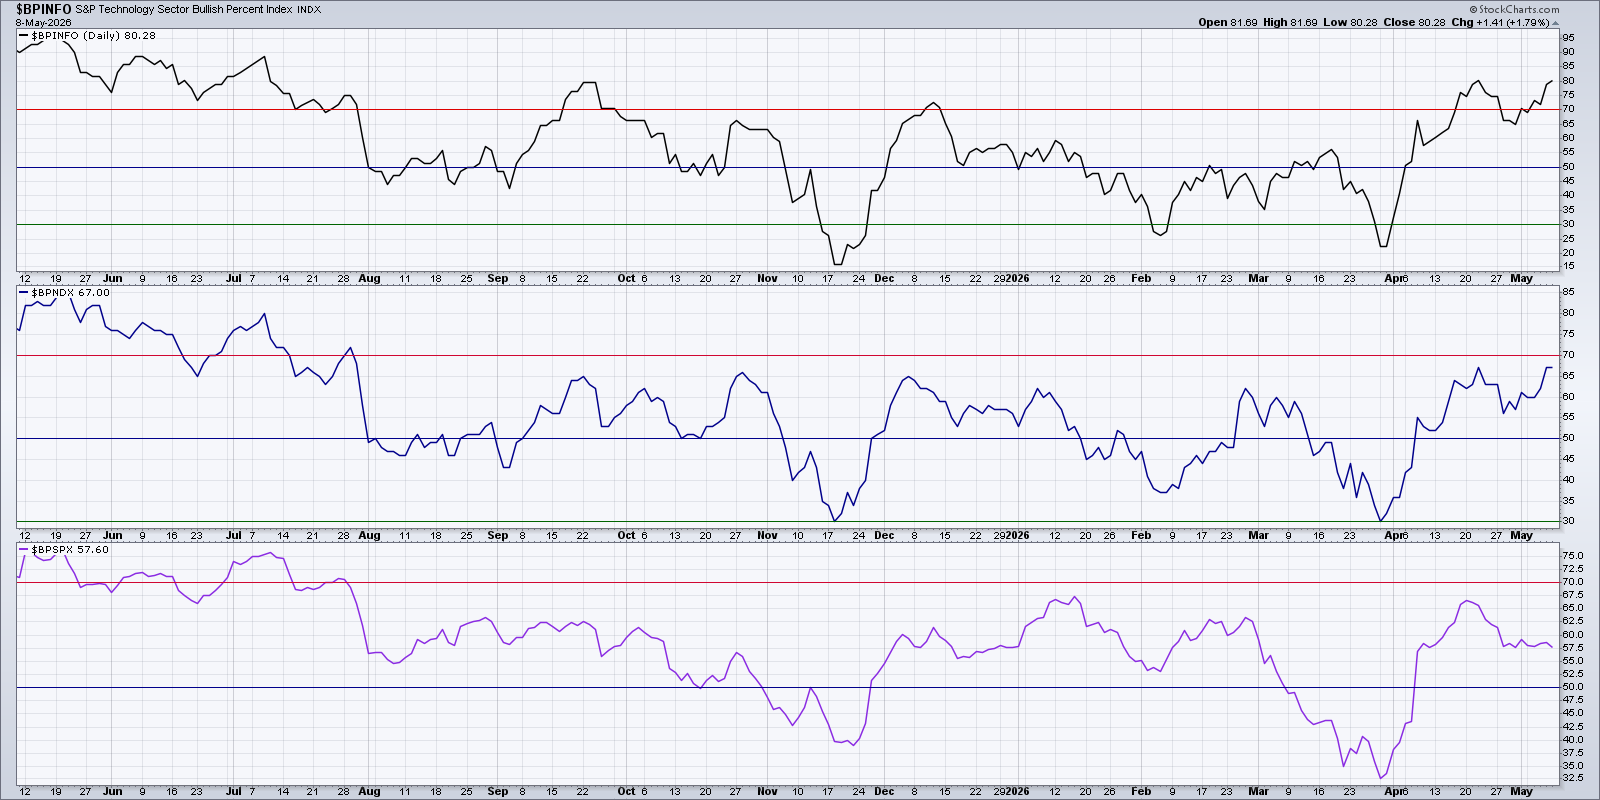
Starting from the bottom panel, you can see that about 58% of S&P 500 charts are currently featuring a bullish point & figure signal. That number has gone down over the last three weeks. The middle panel shows that 67% of the Nasdaq 100 members are in a bullish profile, clearly outpacing the breadth for the S&P 500. With the top panel, we can observe that over 80% of the Technology sector is showing a bullish point & figure setup, completing the picture of how the breadth for tech has just been stronger in recent weeks.
Another way to consider breadth for the Technology sector, is to compare the performance of the Invesco S&P 500 Equal-Weight Technology ETF (RSPT) to the cap-weighted Technology Select Sector ETF (XLK). While the two bottom data series appear to be similar, the ratio at the top shows how there has been a clear stretch of outperformance for both ETFs at different points over the last 12 months.
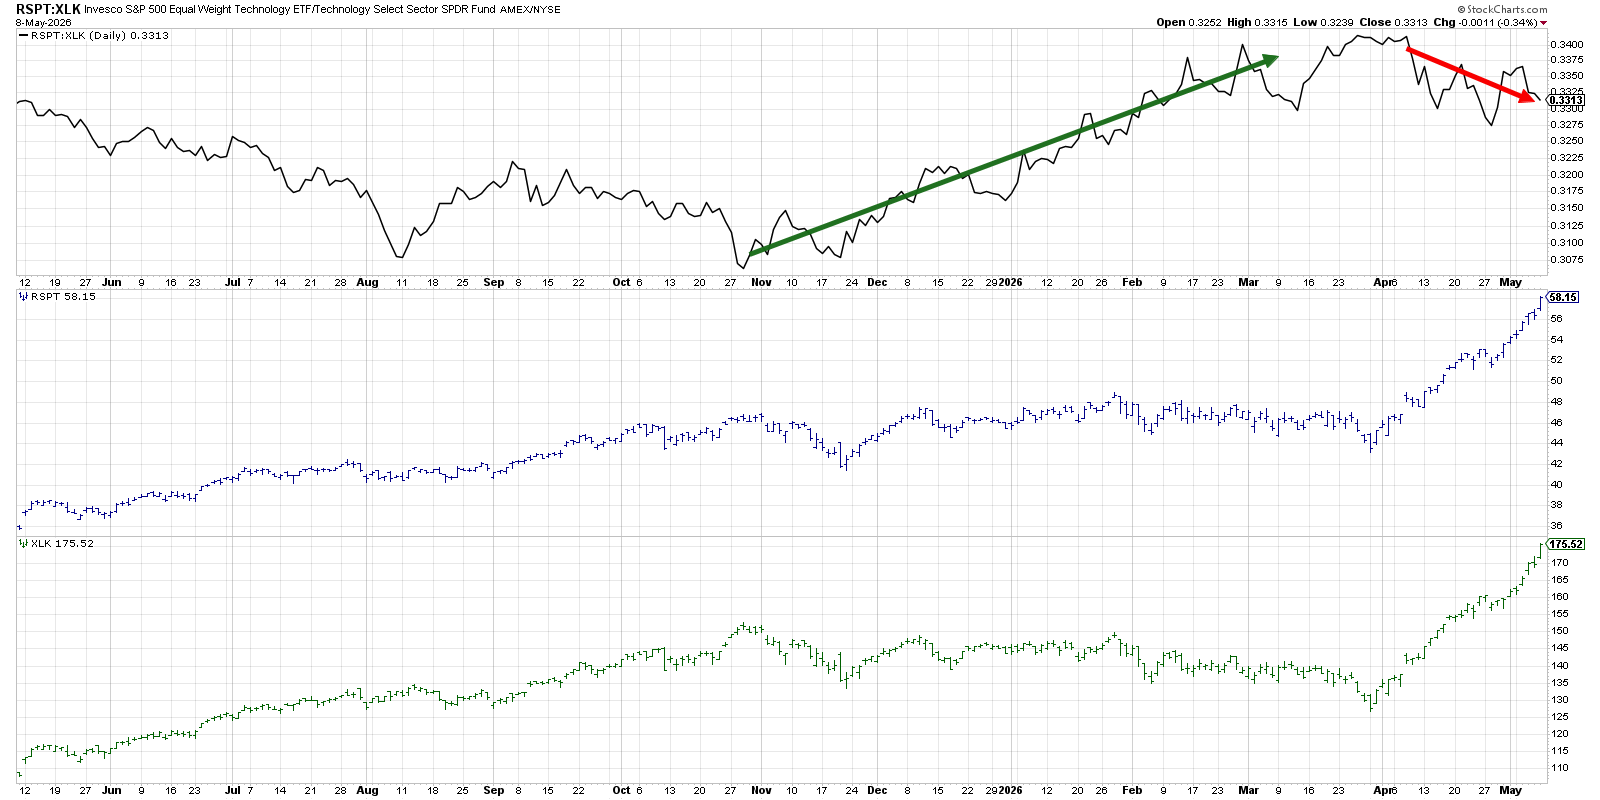
The relative strength ratio here matches closely to the SPXT chart above, with the equal-weighted ETF outperforming the cap-weighted ETF from late October 2025 through the end of March 2026. But since the end of March, the RSPT has been underperforming the XLK. The ratio turning lower speaks to the significant strength in the largest members of the XLK, especially semiconductors like Micron (MU).
What about industry groups outside of semiconductors?
The semiconductor group has indeed logged some impressive gains since the end of March, with the VanEck Semiconductor ETF (SMH) demonstrating a clear upside breakout in early April. From that point on, it’s been “onward and ever upward” with very down trading days along the way.
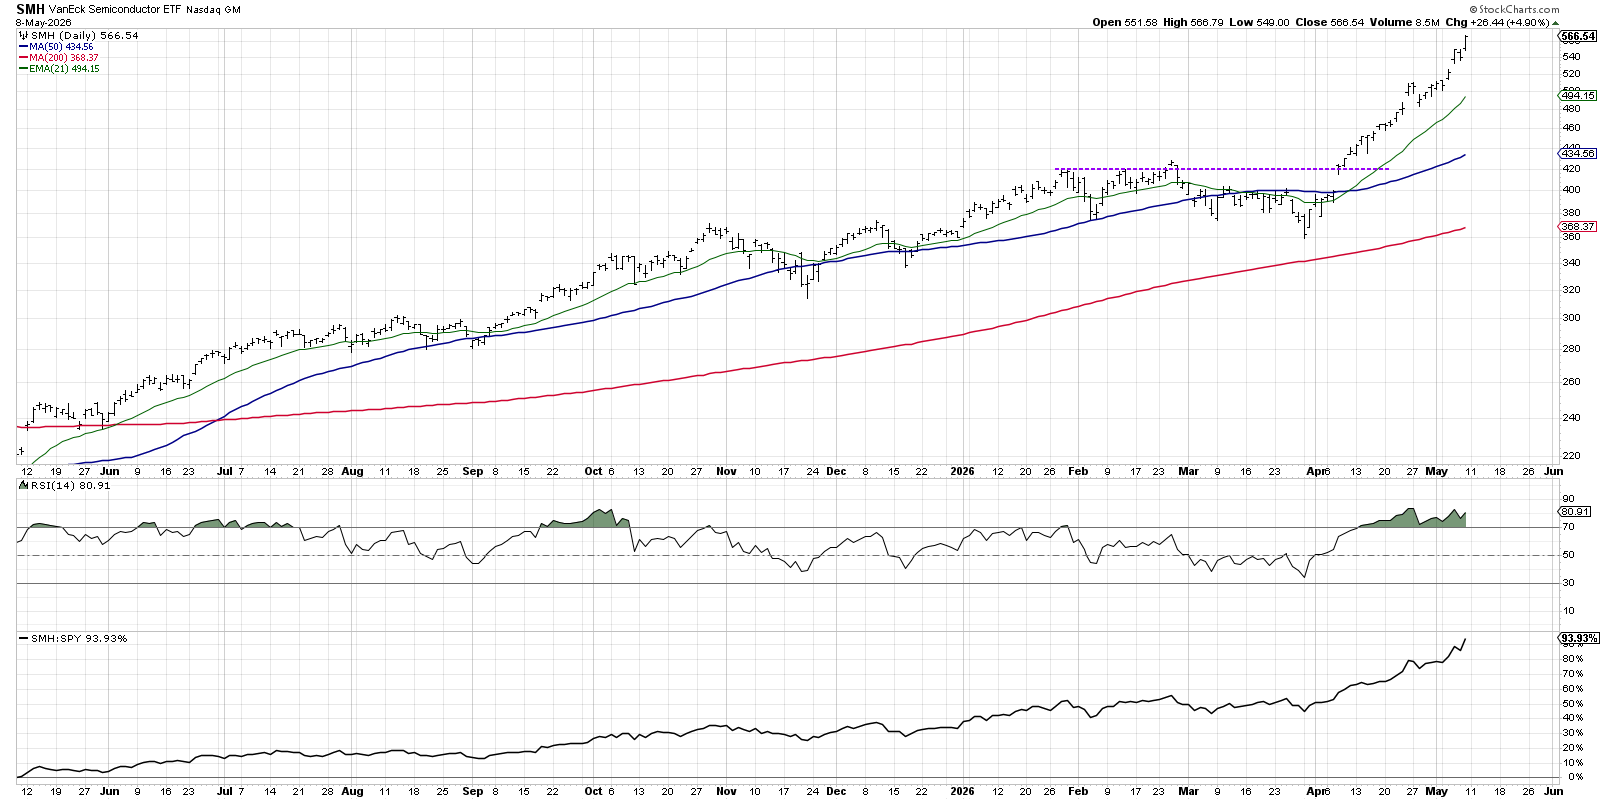
SMH has been overbought since the second week in April, as the relative strength has shown exponential relative gains versus the S&P 500. The moving averages are now clearly in a bullish pattern, with the price, 21-day EMA, 50-day SMA, and 200-day SMA all in proper alignment.
With extreme overbought conditions and many of these semiconductor stocks experiencing upside gaps, the question is whether the uptrend will remain stable and consistent. A break of the 21-day EMA could provide a meaningful initial signal of a change to this uptrend. In the case of a meaningful pullback, I’d be watching the RSI to make sure it finds a low in the 40–50 range. Anything lower could imply a more significant distribution phase.
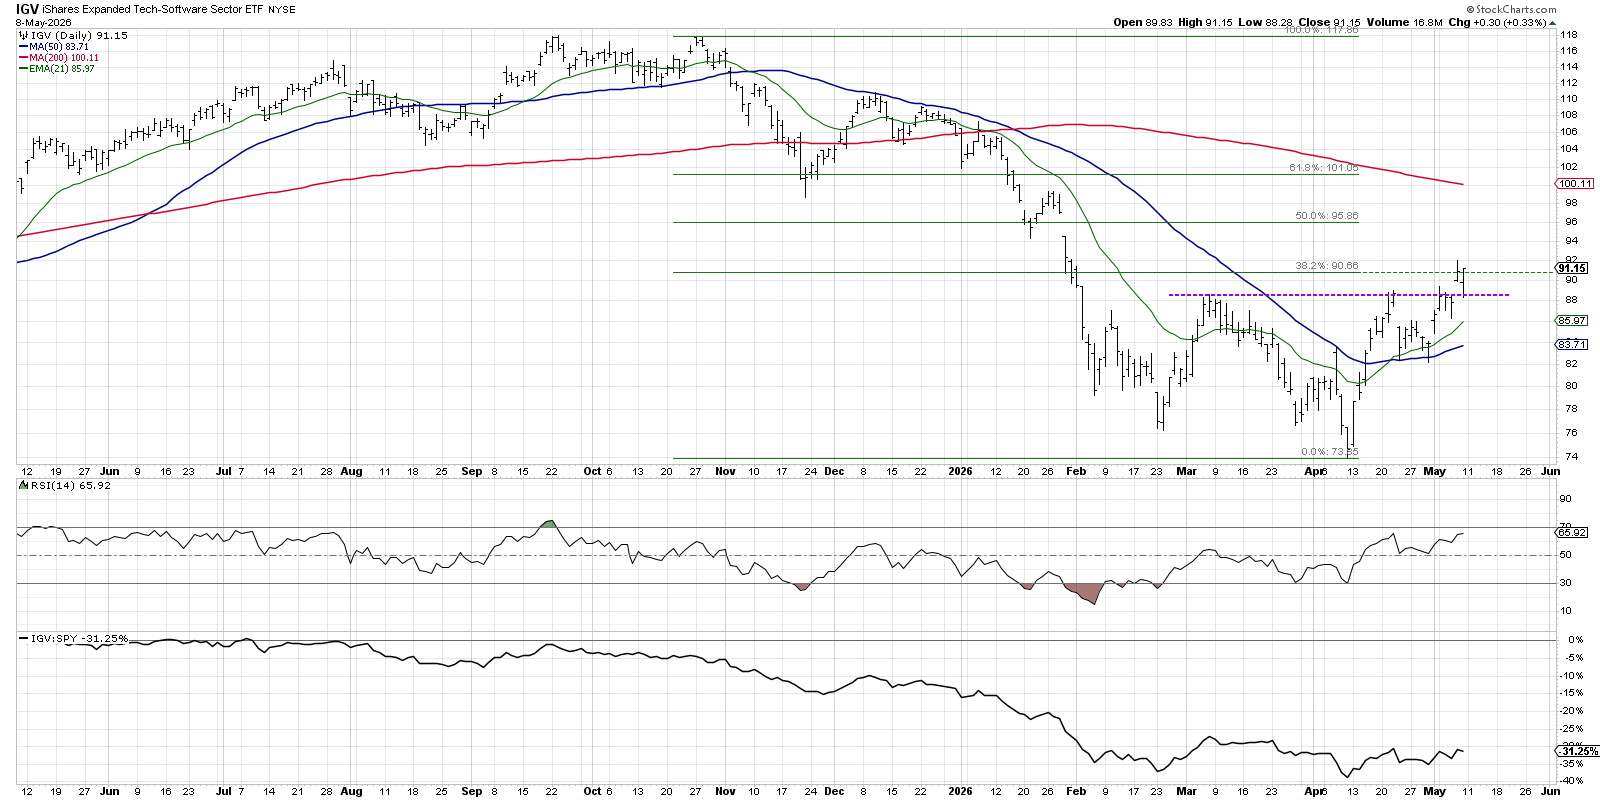
While software stocks like Microsoft (MSFT) have been chronic market laggards, the iShares Expanded Tech-Software Sector ETF (IGV) shows that there has been some meaningful improvement in this group. We can see that the IGV broke above a key resistance level just above $88 this week. After the follow-through on Thursday and Friday, we finished the week sitting just above the 38.2% retracement level based on the October 2025 to April 2026 downtrend.
For the software ETF, next week will be all about confirming this breakout move. Can IGV hold the recent breakout level around $88, and will we see increased volume to validate a new accumulation phase for this emerging group?
We addressed the dominance of the technology sector, as well as a number of fantastic viewer questions, in the latest episode of our daily market recap show!

RR#6,
Dave
P.S. Ready to upgrade your investment process? Check out my free behavioral investing course!
David Keller, CMT
President and Chief Strategist
Sierra Alpha Research LLC
marketmisbehavior.com
https://www.youtube.com/c/MarketMisbehavior
Disclaimer: This blog is for educational purposes only and should not be construed as financial advice. The ideas and strategies should never be used without first assessing your own personal and financial situation, or without consulting a financial professional.
The author does not have a position in mentioned securities at the time of publication. Any opinions expressed herein are solely those of the author and do not in any way represent the views or opinions of any other person or entity.