High-Low Line Turns, RSP Forms Bullish Pattern, Cybersecurity and Cloud ETFs Reverse
Welcome to the Chart Fix!
Key Takeaways
- SPX High-Low line stays bullish and turns up
- EW S&P 500 ETF forms bullish continuation pattern
- Cybersecurity and cloud computing reverse downtrends
Stocks surged in April, with SPY, QQQ, and the tech sector leading the way. Even though the Equal-Weight S&P 500 is lagging, it remains in an uptrend, with a bullish continuation pattern forming. Within the S&P 500, new highs are expanding once more as the High-Low Line turns up again. The tech surge is not just in semis, because we are seeing trend reversals in cybersecurity and cloud computing.
SPX High-Low Line Stays Bullish and Turns Up
Stocks fell in March, but the S&P 500 High-Low Line held up and didn't trigger bearish. This means new lows did not expand during the March decline. Bear markets are marked by an expansion of new lows, and this didn't happen in March. Our breadth models at TrendInvestorPro also remained bullish throughout March.
The chart below shows the S&P 500 in the top window, S&P 500 highs/lows in the middle window and the High-Low Line in the lower window. This is the cumulative measure of net new highs (new highs minus new lows). This line rises when new highs outnumber new lows and falls when new lows outpace new highs.
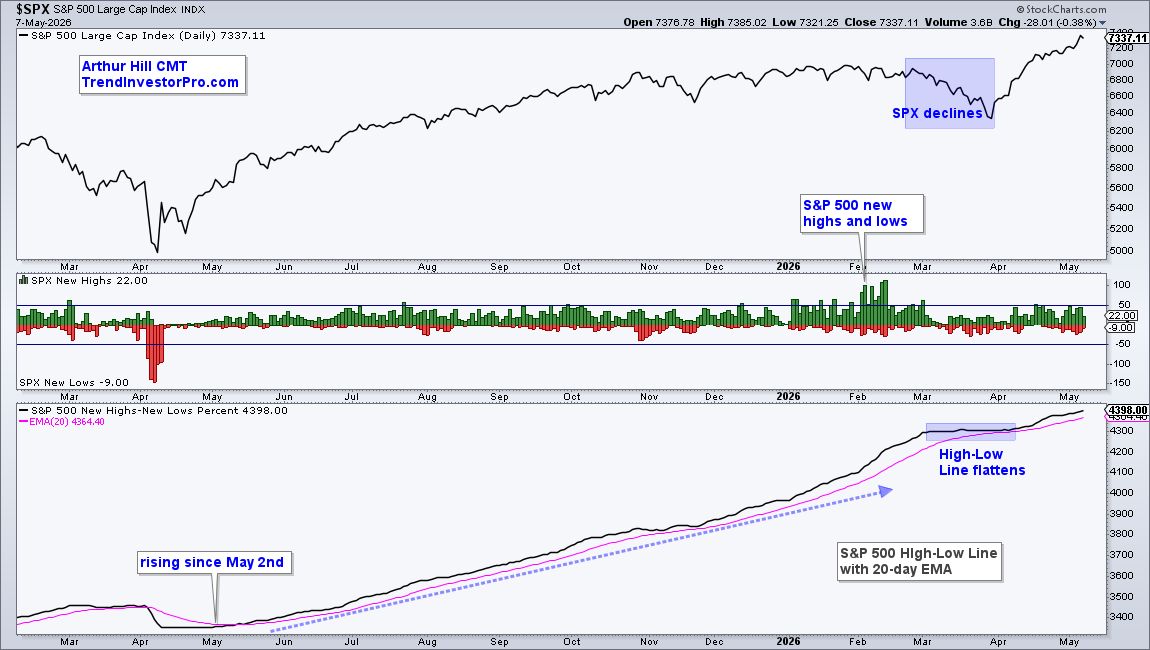
New highs were strong in January–February with several pushes above 50. The number of new highs dropped in March, but new lows did not increase and exceed -50, which shows a serious expansion of new lows. New highs started picking up again in April with a push above 50 on April 17th.
The bottom window shows the High-Low Line crossing above its 20-day EMA on May 2nd and remaining above this EMA. The line flattened as the S&P 500 corrected in March, but never crossed below the 20-day EMA. Most recently, it turned back up in April as new highs outpaced new lows for the last five weeks. The bulls have the edge as long as the High-Low Line holds its 20-day EMA.
EW S&P 500 ETF Forms Bullish Continuation Pattern
The S&P 500 EW ETF (RSP) is not keeping pace with SPY because it has yet to break its February highs. Nevertheless, the long-term trend is up and a bullish continuation pattern is taking shape. RSP provides a good snapshot for the average stock in the S&P 500 because the components are equally-weighted and the tech sector does not have an outsized weighting. Tech accounts for 36.13% of SPY and 16.2% of RSP.
RSP corrected in March as it dipped below its rising 200-day SMA for two days at month-end. The ETF then reversed course and surged to its February high. Overall, an inverse head-and-shoulders is forming. With the bigger trend up, this is a bullish continuation pattern that marks a consolidation within the uptrend. A neckline breakout at 205 would confirm the pattern and suggest that the market rally is broadening, which would be bullish.
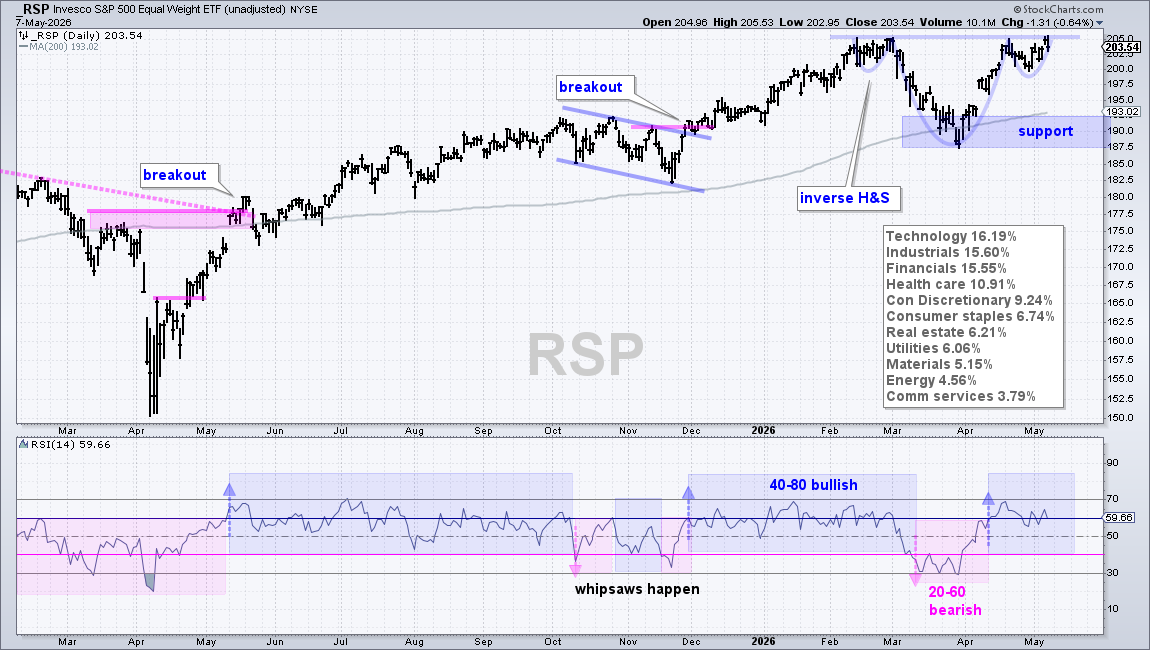
The indicator window shows RSI(14) shifting between bull and bear ranges. A break above 60 puts RSI in the bull range (40–80), and momentum is bullish as long as this range holds (blue shading). A break below 40 puts RSI in the bear range (20–60), and momentum is bearish as long as this range holds (pink shading).
Most recently, RSI crossed above 60 on April 14th, which puts it in the bullish zone. The bulls have a clear edge as long as RSI holds above 40.
Recent Reports and Videos on TrendInvestorPro
- Rotation Strategies for Nasdaq 100 stocks, S&P 500 stocks and ETFs
- AI Complex Leads, but Consumer Discretionary and Housing Lag
- Stocks: Materials Leader, Biotech Breakout and Solar Thrust
- Bonds Trend Lower as Precious Metals and Uranium Set Up
- Trend Trio150 Signals for Dow Stocks and Sector SPDRs
Click here to take a trial and gain full access
Cybersecurity and Cloud Computing Reverse Downtrends
Semiconductors and AI-related stocks led the market surge in April and propelled the Technology SPDR (XLK) to new highs. SMH, SOXX, AIQ, and ARTY all hit new highs with powerful moves. We are also seeing powerful moves and breakouts in other areas of the tech sector, such as the Cybersecurity ETF (CIBR) and Cloud Computing ETF (SKYY).
The chart below shows CIBR peaking way back in October and falling into late February (weekly candlesticks). CIBR then firmed with a trading range in the 60–66 area for seven weeks. An "Opening Marubozu" candlestick formed in mid April as the ETF surged 9.45%.
This candlestick has no lower shadow and a small upper shadow, which means price moved higher immediately after the open and closed near the high (Source: Candlestick Charting Explained by Greg Morris). Marubozu candlesticks mark an outsized advance that shows strong buying pressure.
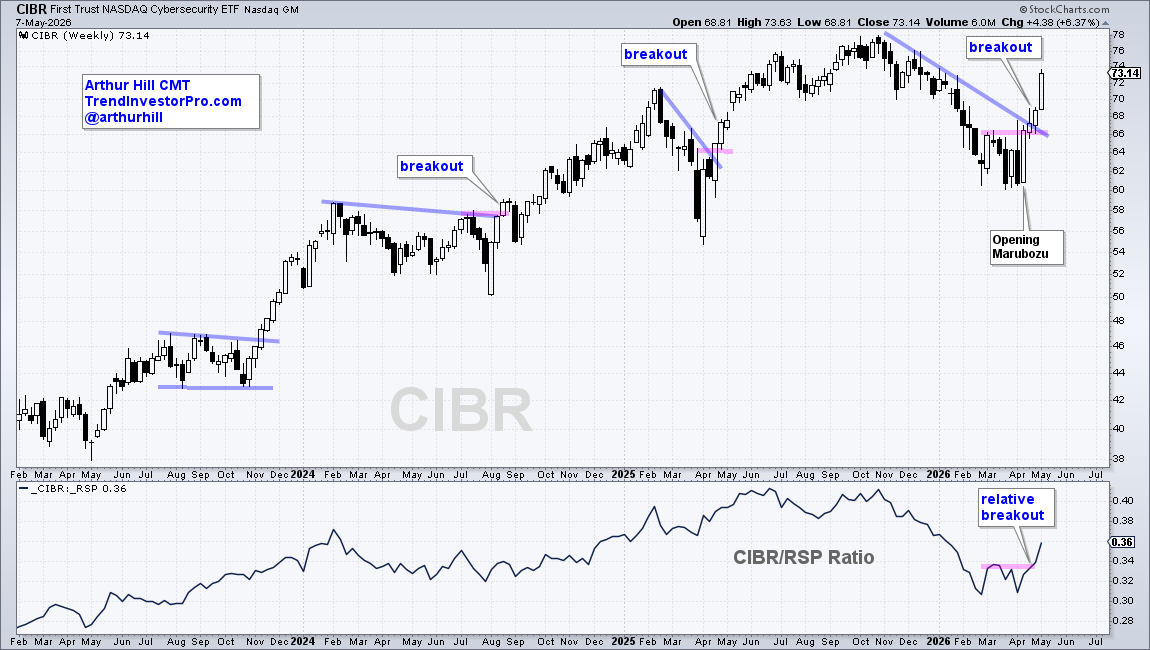
CIBR followed through on this Marubozu with a breakout the next two weeks. The ETF reversed the downtrend from October to March and is now in an uptrend on the weekly chart. The indicator window shows the price-relative (RSP/CIBR ratio) also breaking out, which means CIBR is starting to outperform.
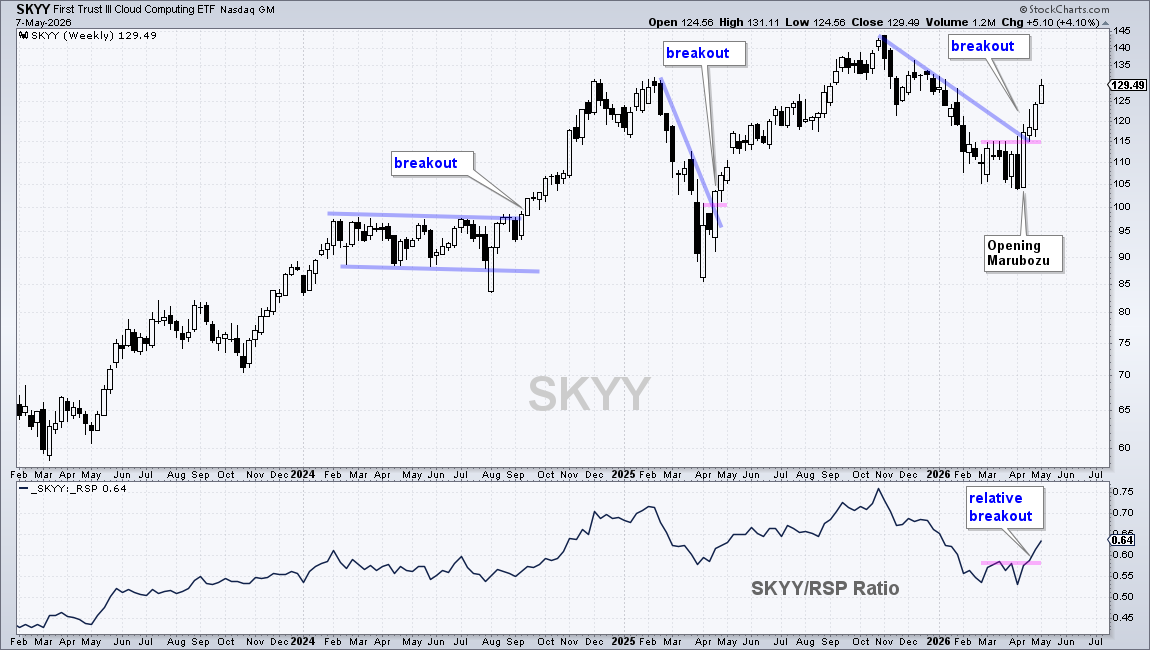
The next chart shows the Cloud Computing ETF (SKYY) with similar characteristics. An Opening Marubozu formed in mid-April as the ETF surged 12.49% and broke the March highs (pink line). SKYY followed through on this breakout with further gains the last three weeks. The bottom window shows the price-relative breaking out.
See TrendInvestorPro for more reports and videos.