What You Need to Know About Current Market Rotation

It's probably obvious to just about everyone right now that we're in an uptrend. Our major indices are seemingly setting new record highs daily. But it's more important to follow WHAT is leading the market higher to get a better sense of the sustainability of the rally. Will it last?
With the correction over, if we look at the S&P 500 ($SPX), we see there are two clear support levels to watch during any bout of selling.
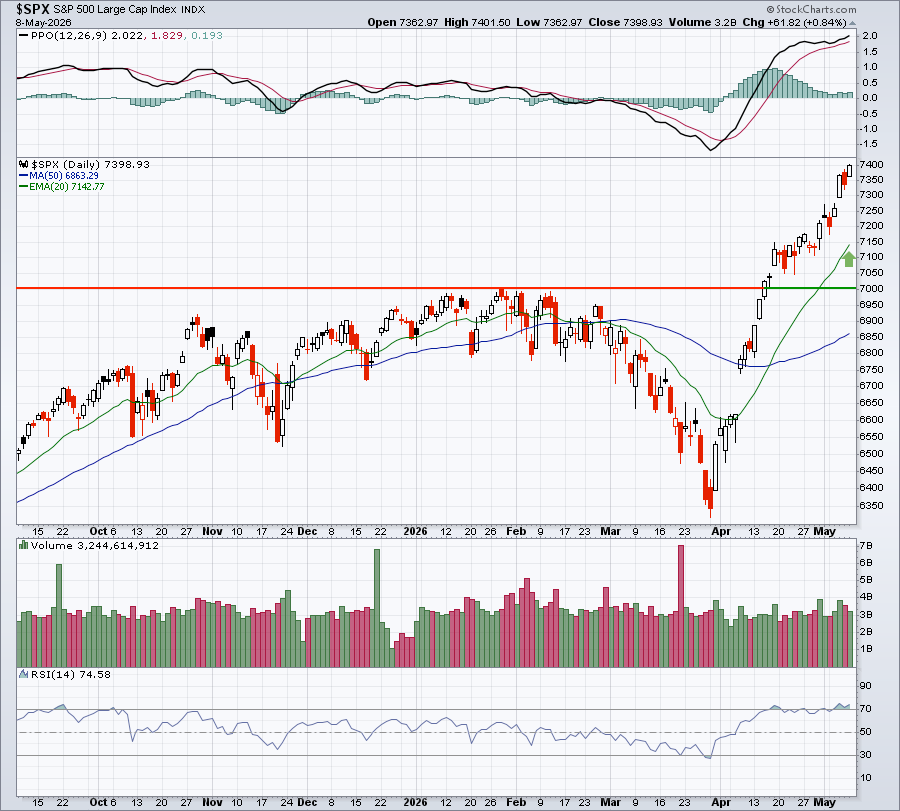
Are we overbought? Of course we are! Take one look at that RSI in the bottom panel. It's nearly 75, which is clearly in overbought territory. But the RSI is just one signal and, during secular bull market rallies, it can remain overbought.
The RSI hit 70 around April 15th. Since triggering this oversold level, the S&P 500 has pushed higher from its 7000 price breakout to where it is today at almost 7400. It doesn't pay to sell during bull market rallies, because the RSI hits 70. That's usually a big mistake, as price breakouts trump all other indicators.
So where do we go from here?
Well, semiconductors ($DJUSSC), as awesome as they've been, will take a breather at some point. It'll be very important to see which groups step up to lead when that happens. Semiconductors have the largest industry group representation in the S&P 500. The second largest industry group — software (IGV) — is showing signs of strengthening ... finally!
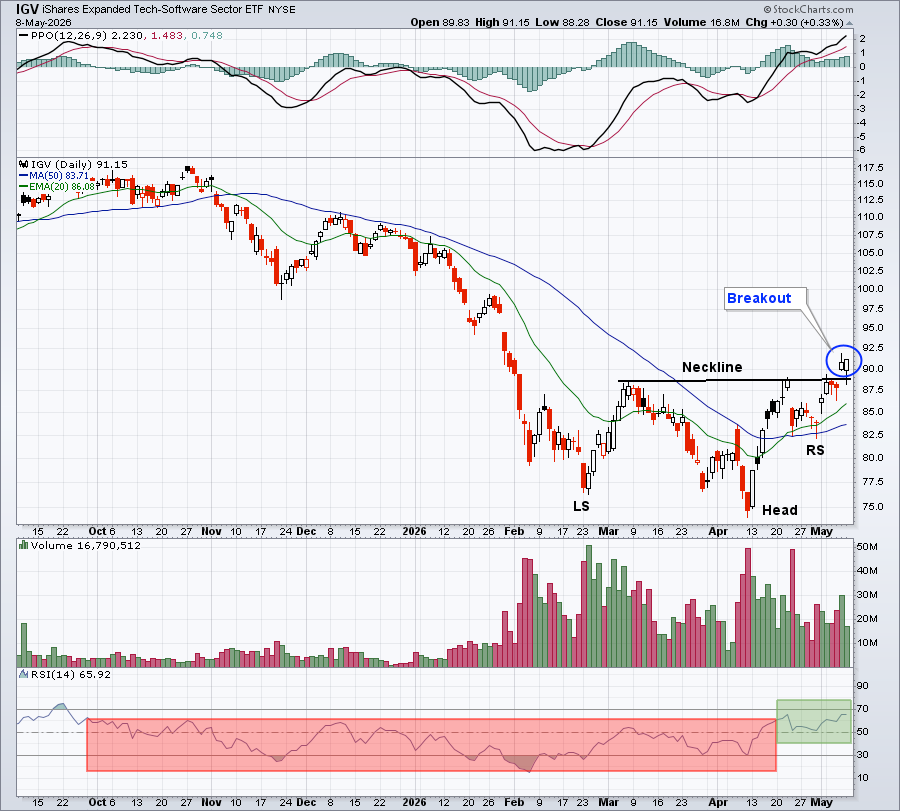
After months of trending lower, the IGV has broken out of a bottoming head & shoulders pattern and its RSI has cleared 60 resistance twice recently, another indication that a bottom is in and an uptrend has begun.
And for the first time in a very long time, software is showing relative strength vs. the S&P 500 over a one-month period.
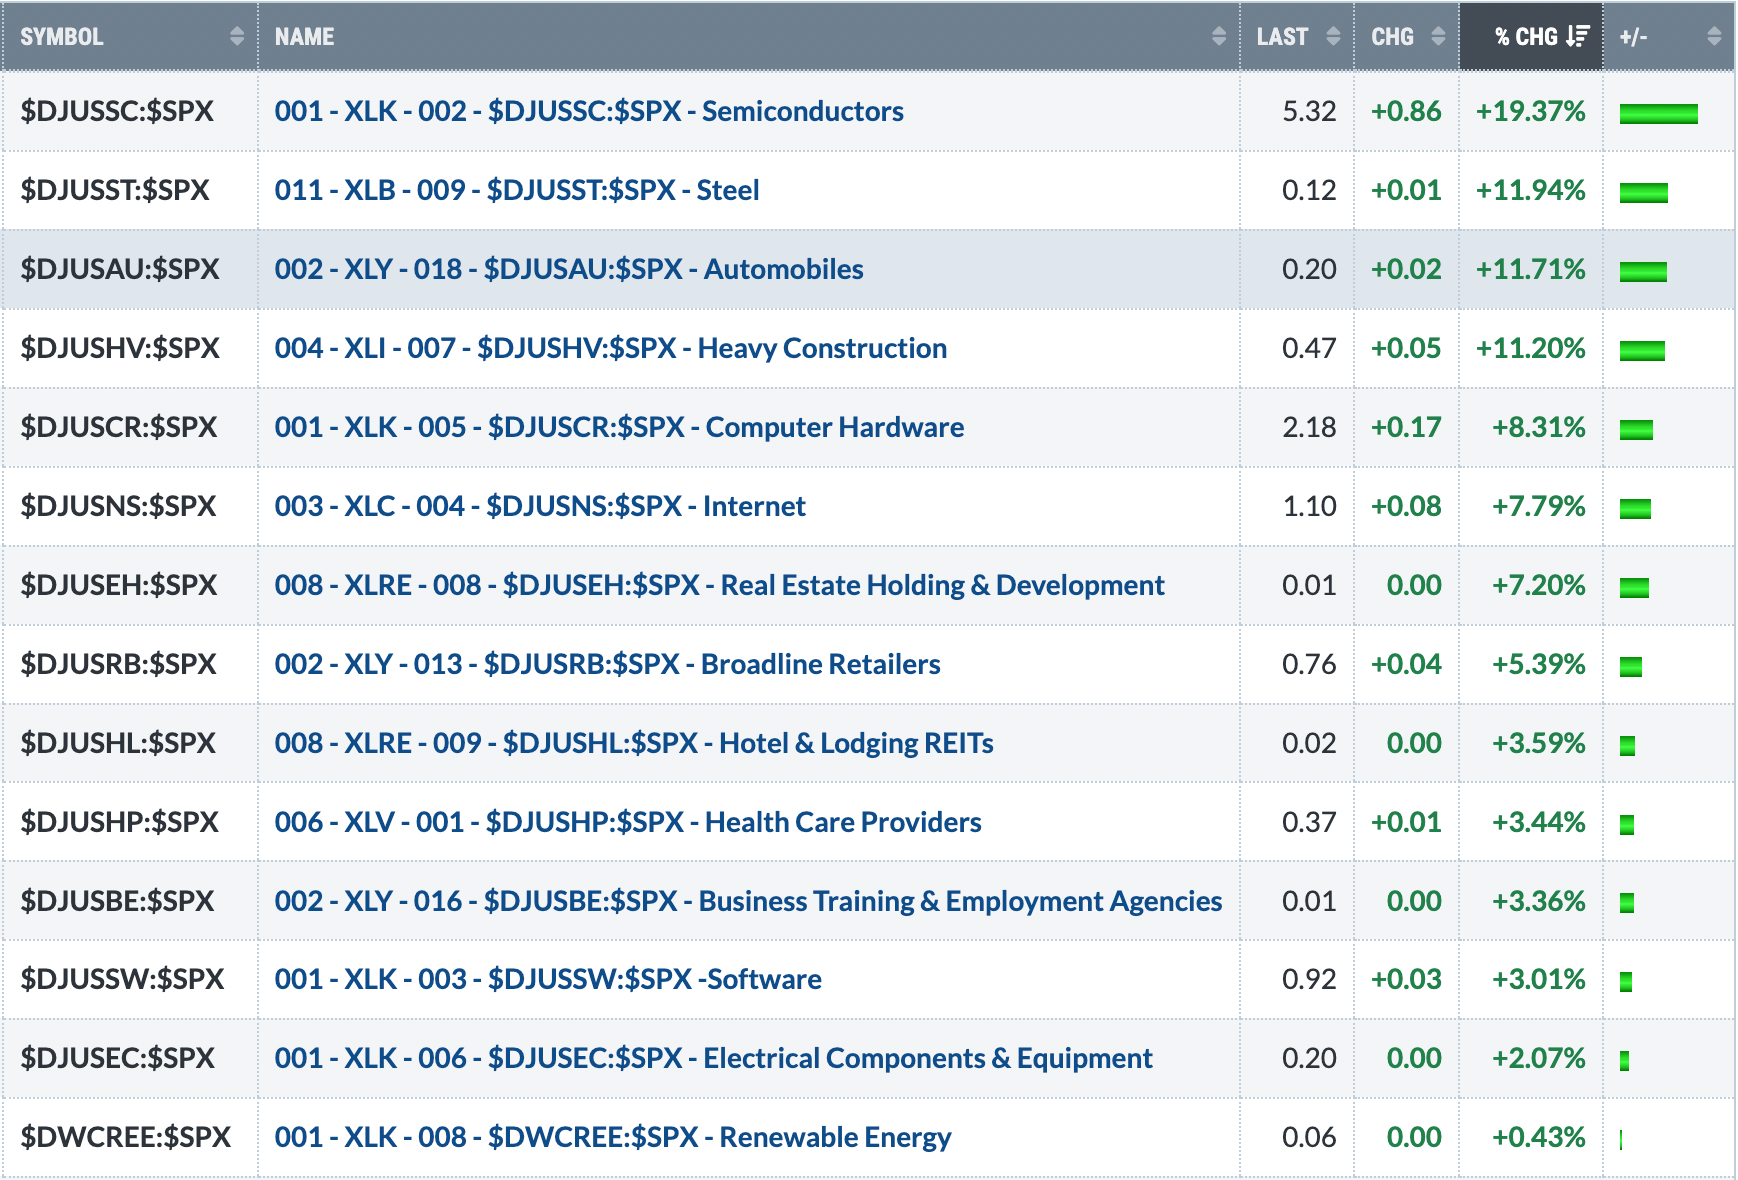
The interesting part about the above is that there are only 14 industry groups that have outperformed the benchmark S&P 500 over the past month. The reason for that is quite simple. Semiconductors, by far the largest industry group, has outperformed by 19 percentage points over the past month. That lifts the S&P 500 bar really high, making it difficult for other industry groups to outperform. Software is large enough to help sustain the S&P 500 if semiconductors retreat for a period of time. Therefore, I'd keep a very close eye on that IGV chart. Now that we've seen a bottoming pattern execute, price support at the neckline, along with the rising 20-day EMA, should provide excellent support for this software ETF.
Rotation is the key to bull market sustainability. We need to see rotation remain among aggressive sectors and industry groups, especially during market advances. That's one critical piece to staying ahead and beating the S&P 500.
At EarningsBeats.com, we have a long history (roughly 7 1/2 years) of constructing portfolios that beat the S&P 500. Our Model Portfolio has doubled the S&P 500 return since November 2018, while our Aggressive Portfolio has outperformed by 60% or so since May 2019. The key, in my opinion, is a consistent, proven approach.
We are hosting a FREE event next Saturday, May 16th, "5-Step Process To Trade With More Confidence", where I will walk you through my exact routine every quarter in selecting a portfolio of stocks designed to outperform the S&P 500. Do we outperform every quarter? Of course not. We have tough times like everyone else, but we know our process works over time and that's the key. If you'd like to attend, please CLICK HERE to learn more about our approach and to register for this unique event.
I hope to see you there!
Tom