MEMBERS ONLY
Short-term Yields Edge Higher - Extrapolating from the June Swoon - First Supports for Fab Five - Chart Potpourri
by Arthur Hill,
Chief Technical Strategist, TrendInvestorPro.com
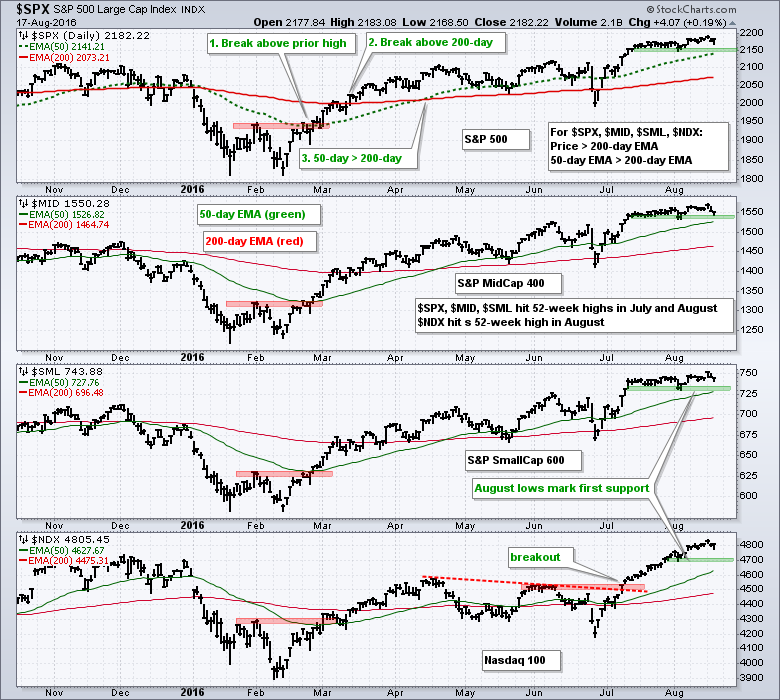
Broad Market Strength affirms Bull Market // Short-term Yields Edge Higher - Will Long-term Yields Follow? // Extrapolating from the June Swoon in Treasury Yields // Finance Sector Remains Strong // Regional Bank SPDR Holds Breakout - JPM, C, BAC, USB // Setting first Supports for the Fab Five - FB, GOOGL, AMZN, AAPL, MSFT...
READ MORE
MEMBERS ONLY
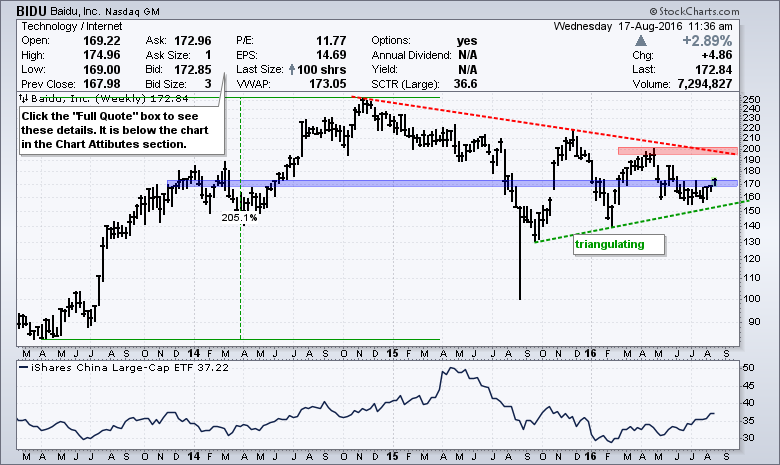
Baidu Goes for Breakout after Long Stall
by Arthur Hill,
Chief Technical Strategist, TrendInvestorPro.com
Baidu ($BIDU) has basically gone nowhere since 2014, but the stock is showing signs of buying pressure recently with a wedge breakout. First, the weekly chart shows the stock surging some 200% and moving above 170 for the first time in late 2013. The stock peaked in late 2014 and...
READ MORE
MEMBERS ONLY
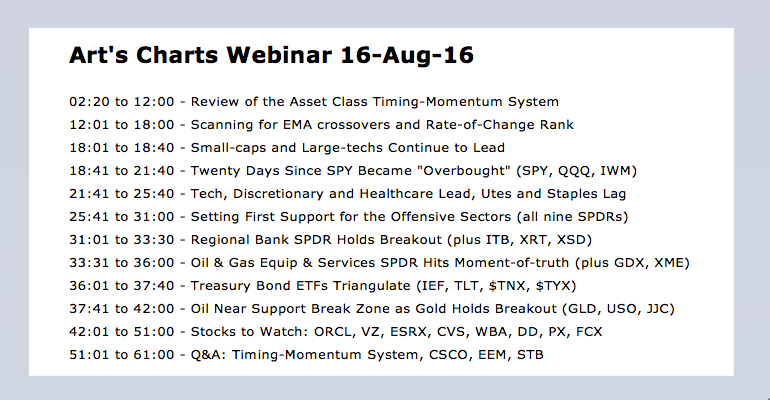
IWM Takes the Lead - Setting First Support for Offensive Leaders - XLU and XLP Continue to Lag - Webinar Video
by Arthur Hill,
Chief Technical Strategist, TrendInvestorPro.com
Click here for the Webinar video - Click here for the Webinar ChartList
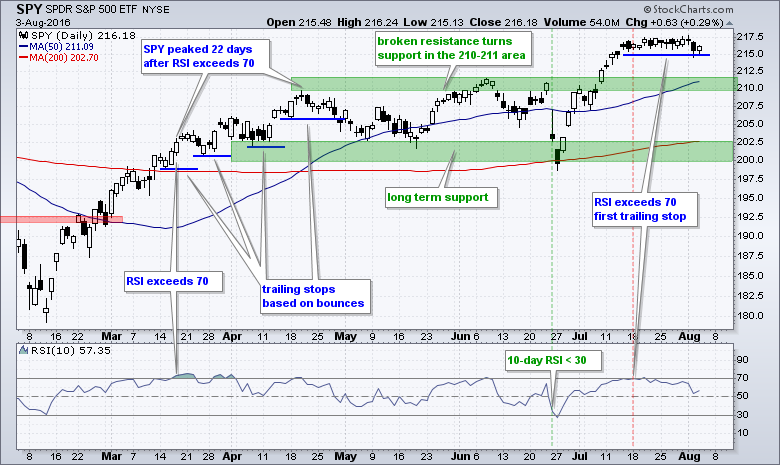
Twenty Days Since SPY Became "Overbought" // RSI for IWM finally Hits 70 // Small-caps and Large-techs Continue to Lead // Tech, Consumer Discretionary and Healthcare Lead // Utilities and Staples are Lagging // Setting First Support for the Offensive...
READ MORE
MEMBERS ONLY
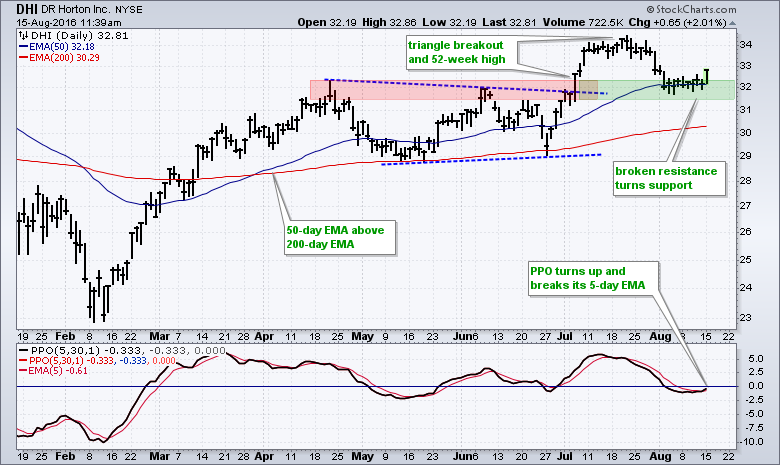
DR Horton Looks Poised to Continue Bigger Trend
by Arthur Hill,
Chief Technical Strategist, TrendInvestorPro.com
DR Horton (DHI) is part of the housing group and the stock is in a long-term uptrend. I based this trend assessment on three things. First, the 50-day EMA is above the 200-day. Second, the 200-day EMA is rising. Third, the stock hit a 52-week high in July. DHI pulled...
READ MORE
MEMBERS ONLY
SystemTrader - A Timing-Momentum System for Trading Asset Classes - Vanguard Mutual Funds and ETFs - Revised
by Arthur Hill,
Chief Technical Strategist, TrendInvestorPro.com
SystemTrader // Introduction // Setting Ground Rules // Picking the Securities // Buy-and-Hold Performance // Reducing Drawdowns with Simple Timing // Increasing Returns with Pure Momentum // Combining Trend-Following and Momentum // Conclusions - Past Performance.... // Asset Group ETFs // Further Study //// ........
Introduction
Today we will dive into the world of asset class rotation by testing some tradi...
READ MORE
MEMBERS ONLY
Bulls Maintain Short-term Edge - Energy Complex Weakens - Setups in IHF and IYZ - Watching XLF and KRE
by Arthur Hill,
Chief Technical Strategist, TrendInvestorPro.com
Bulls Maintain Short-term Edge // Nasdaq and Russell 2000 Outperforming // Energy Complex Weakens Across the Board // Energy-related ETFs Could be Vulnerable // Bullish Setups in HealthCare Providers and Telecoms // Regional Bank SPDR and Finance SPDR Stutter after Breakouts ///// .....
Bulls Maintain Short-term Edge
Long-term, the stock market is in bull mode, which means...
READ MORE
MEMBERS ONLY
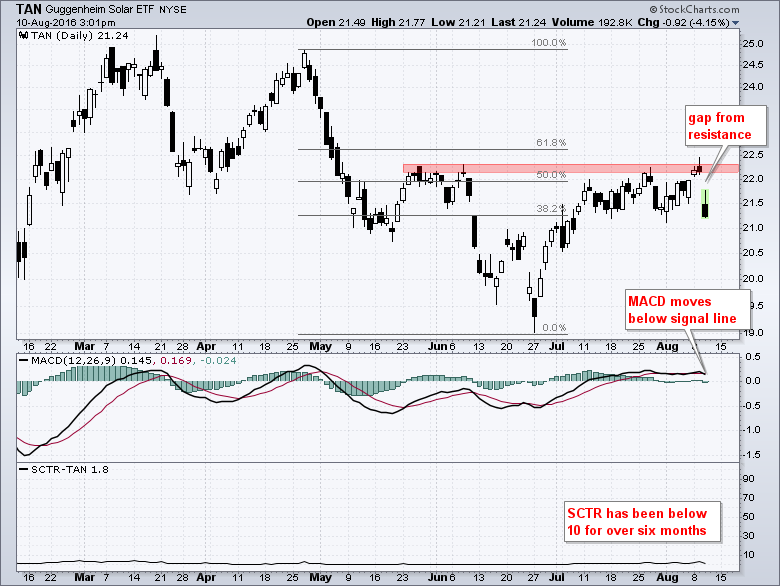
Solar ETF Fails at Resistance Yet Again
by Arthur Hill,
Chief Technical Strategist, TrendInvestorPro.com
The Solar Energy ETF (TAN) got a nice bounce along with the stock market from late June to early August, but this bounce has now reversed and it looks like the bigger downtrend is resuming. The chart shows the highs from late May and early June marking resistance in the...
READ MORE
MEMBERS ONLY
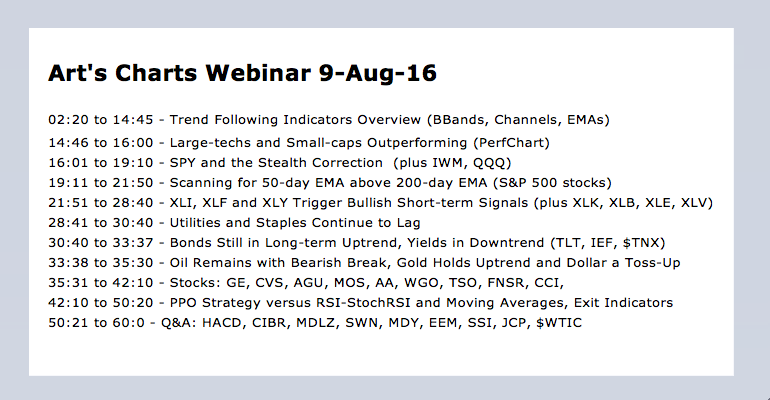
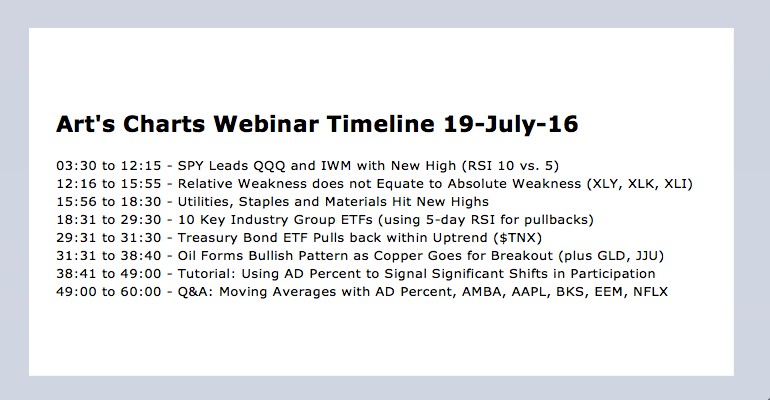
Large-techs and Small-Caps Lead - Utes and Staples Lag - PPO versus RSI-StochRSI Strategy - Webinar Video
by Arthur Hill,
Chief Technical Strategist, TrendInvestorPro.com
Click here for Webinar Video
Large-techs and Small-caps Outperforming // SPY and the Stealth Correction // Golden Crosses remain for All Nine Sector SPDRs // XLI, XLF and XLY Trigger Bullish Short-term Signals // Utilities and Staples Continue to Lag // PPO Strategy versus RSI-StochRSI and Moving Averages // Webinar Preview ///// .....
Large-techs and Small-caps Outperforming
Once...
READ MORE
MEMBERS ONLY
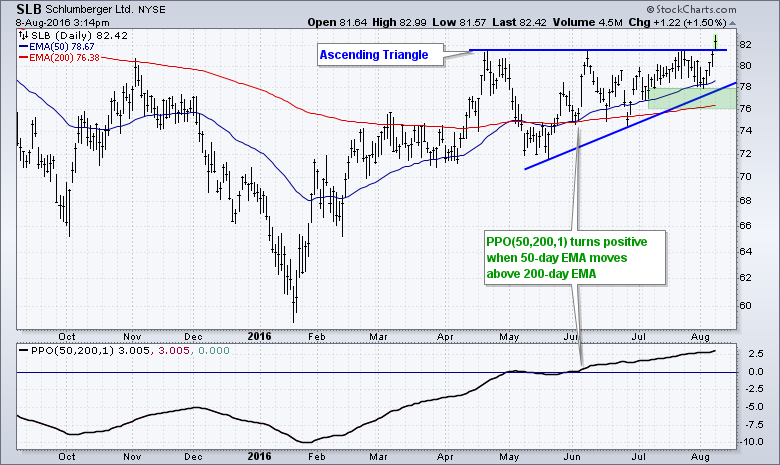
Schlumberger Confirms Bullish Continuation Pattern
by Arthur Hill,
Chief Technical Strategist, TrendInvestorPro.com
Schlumberger (SLB) broke above resistance today and this breakout confirms a bullish ascending triangle. First, note that the bigger trend is up because the 50-day EMA is above the 200-day EMA. Chartists can also plot this difference using the Percentage Price Oscillator (50,200,1), which is shown in the...
READ MORE
MEMBERS ONLY
SystemTrader - BBand Breakout - Donchian Channels - Weekly EMA Test - Trend Troika Strategy
by Arthur Hill,
Chief Technical Strategist, TrendInvestorPro.com
SystemTrader // Adding Trend to Broad Market Assessment // Three Trend Following Indicators // Using Donchian Channels // Hard to Beat the Humble MA Crossover // Testing Crosses of the 40 Week EMA // Optimizing and Choosing a Focus Index // Setting up the Trend Troika // .....
Adding Trend to Broad Market Assessment
This is the fourth, and...
READ MORE
MEMBERS ONLY
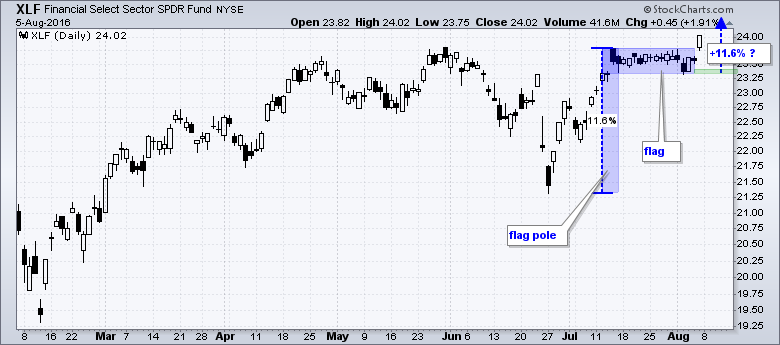
Gaps and Flag Breakouts Dominate Finance Sector
by Arthur Hill,
Chief Technical Strategist, TrendInvestorPro.com
Before looking at some patterns and breakouts, let's first review the basic of the flag pattern. Flags are continuation patterns that depend on the prior move for a directional bias. Flags are bullish continuation patterns when the prior move was up and bearish continuation patterns when the prior...
READ MORE
MEMBERS ONLY
Trends Versus Seasonal Patterns - IWM and SPY Hold Short-Term Support - Correlations with the 10-yr Yield (banks, gold, utilities)
by Arthur Hill,
Chief Technical Strategist, TrendInvestorPro.com
Trend > Seasonality // QQQ and IWM Hold Support // EW Finance ETF Nears 52-week High // Measuring Correlations with the 10-yr Yield ///// .....
Trend > Seasonality
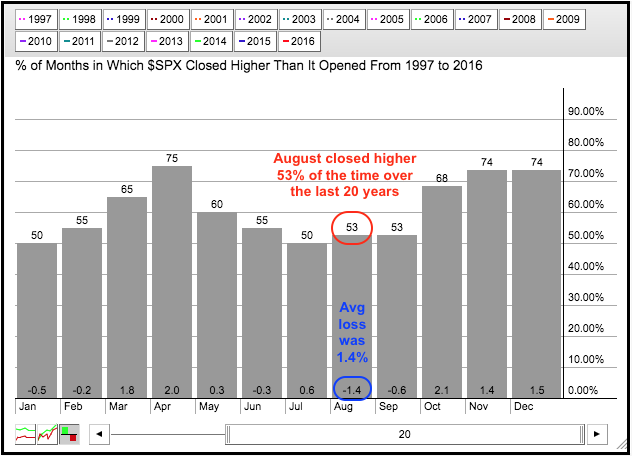
.... I pointed out the negative seasonal pattern for August over the last 20 years, but this does not guarantee a correction or pullback in the stock market....
READ MORE
MEMBERS ONLY
Finance Sector Perks Up as JP Morgan Forms a Flag
by Arthur Hill,
Chief Technical Strategist, TrendInvestorPro.com
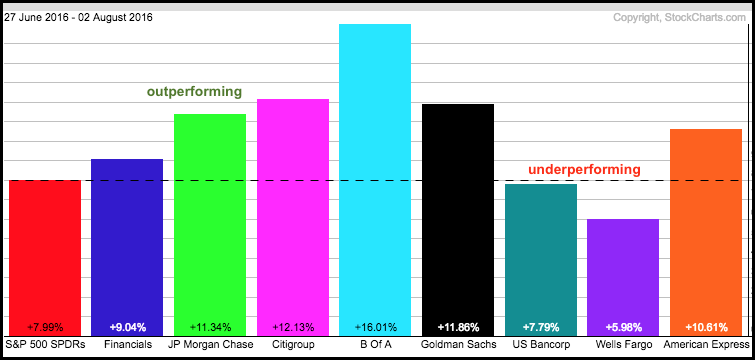
One would not think it from the price charts, but the Finance SPDR (XLF) and several banking stocks are outperforming the S&P 500 SPDR (SPY) since late June. XLF, KRE and many banking stocks are trading below their spring highs and SPY is trading near a 52-week high....
READ MORE
MEMBERS ONLY
Video - Breadth Overview - Seasonal Patterns - 5 SPDRs Consolidating - GLD and GDX Extend Signals - 8 Stocks
by Arthur Hill,
Chief Technical Strategist, TrendInvestorPro.com
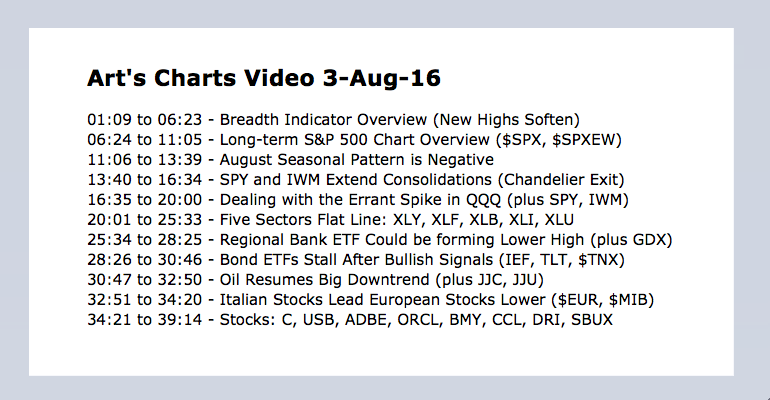
Tuesday's webinar for Art's Charts was cancelled due to technical difficulties. Most of the webinar is based on the charts from Tuesday's commentary, which are posted again below. In addition to these charts, I am also covering the nine sector SPDRs, T-Bond ETFs, Gold,...
READ MORE
MEMBERS ONLY
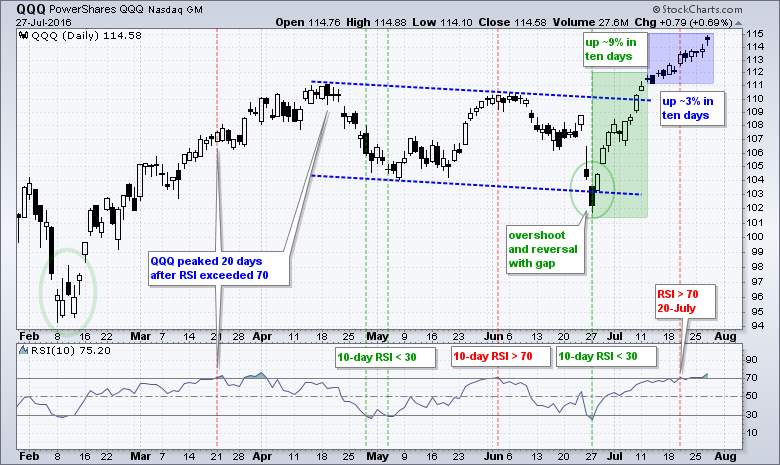
SPY is Ripe for Pullback as Seasonals Turn - New Highs Soften - Dealing with the QQQ Spike
by Arthur Hill,
Chief Technical Strategist, TrendInvestorPro.com
Breadth Indicator Review // New Highs Soften in late July // %Above 200-day Remains Strong // Marking First Support for S&P 500 // Dealing with the Spike in QQQ // SPY Extends Trading Range //// .....
The stock market environment remains bullish, but the major index ETFs are extended after big gains the last five...
READ MORE
MEMBERS ONLY
Plotting 52-week Highs on the Microsoft Price Chart
by Arthur Hill,
Chief Technical Strategist, TrendInvestorPro.com
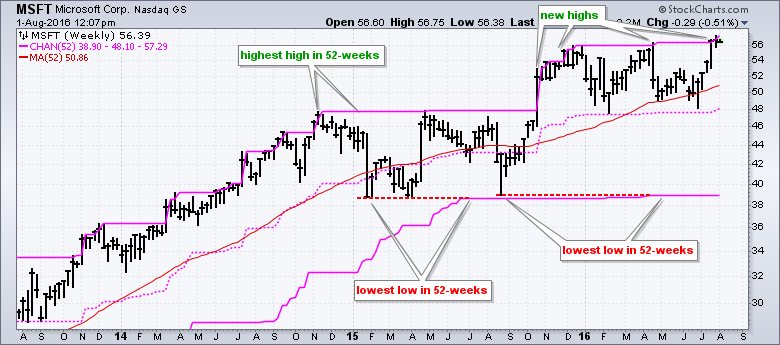
Chartists can plot 52-week highs right on the price chart by using the Price Channels overlay. The upper line of a 52-week Price Channel marks the high of the last 52-weeks, the lower line marks the low and the middle line is the average of the two. By plotting this...
READ MORE
MEMBERS ONLY
A Flag Break for IWM - Looking at August Seasonal Patterns - Adding Parabolic SAR to Gold and Bond Signals
by Arthur Hill,
Chief Technical Strategist, TrendInvestorPro.com
Waning Momentum is Not Always Negative // Selling Pressure Remains Muted // IWM Breaks Out of Flag // Here Comes August // Positive Correlation between Bonds and Gold // Adding Parabolic SAR to IEF Signal // Gold Follows Through on Bullish Signal // Scanning the S&P 1500 for RSI-StochRSI Signals // Scan Code //// .....
Waning Momentum is...
READ MORE
MEMBERS ONLY
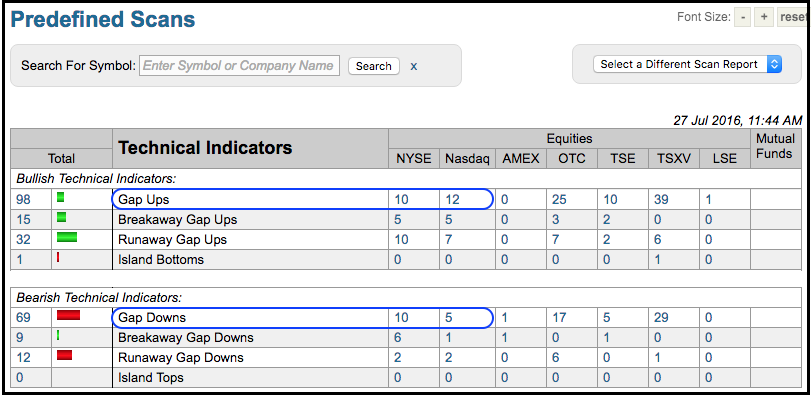
Counting the Gaps for Clues on Earnings Season
by Arthur Hill,
Chief Technical Strategist, TrendInvestorPro.com
There were dozens of gaps today with most coming to the upside. Down gaps in Akamai (AKAM) and Lumber Liquidators (LL) were countered with up gaps in Apple (AAPL) and Buffalo Wild Wings (BWLD). At midday on Wednesday, the Predefined Scan results showed 22 up gaps on the NYSE-Nasdaq, and...
READ MORE
MEMBERS ONLY
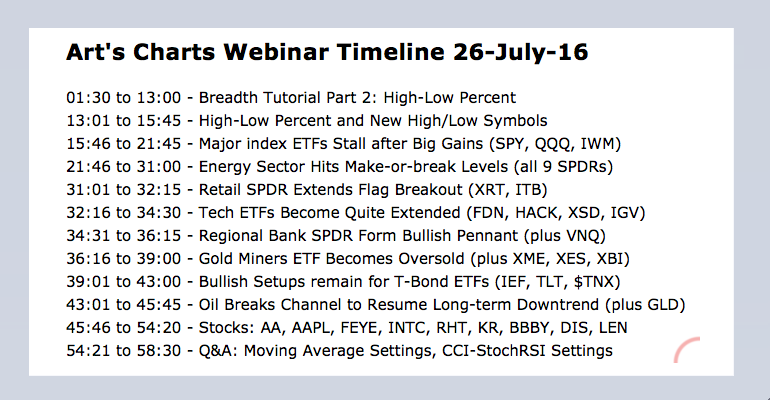
Major Index ETFs Hold Gains - Energy Sector Hits Make-of-Break Level - Oil Resumes Big Downtrend - Webinar Video
by Arthur Hill,
Chief Technical Strategist, TrendInvestorPro.com
SPY Stalls and Gains Hold // Marking First Support for QQQ // IWM Forms High and Tight Flag // Energy Sector Nears Make-or-break Level // XES Breaks Channel Trend Line // Oil Resumes Long-term Downtrend // Webinar Preview //// .....
Click here for Webinar Video
SPY Stalls and Gains Hold
There is no real change in SPY, QQQ...
READ MORE
MEMBERS ONLY
SystemTrader - Difference between SMA and EMA - Using Stocks Above 200-day EMA to Measure Trend Participation
by Arthur Hill,
Chief Technical Strategist, TrendInvestorPro.com
SystemTrader // Introduction - Measuring Trend Participation // 200-day EMA versus 200-day SMA // Backtesting the Moving Averages // Percent above 200-day Breadth Indicator // Smoothing and Reducing Whipsaws // Capturing Broad Market Participation // Conclusions on Trend Participation // Stocks Above EMA Symbols at StockCharts //// . . . . .
Introduction - Measuring Trend Participation
The humble moving average remains on...
READ MORE
MEMBERS ONLY
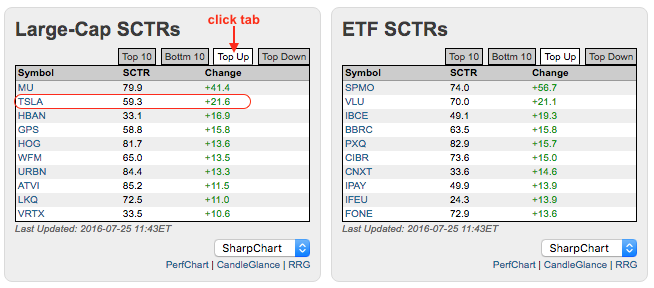
Tesla Gets a Relative Strength Surge ahead of Earnings
by Arthur Hill,
Chief Technical Strategist, TrendInvestorPro.com
Tesla (TSLA) caught my eye on Monday because its StockCharts Technical Rank (SCTR) surged over 20 points. The image below shows the SCTR tables for large-cap stocks and ETFs. Notice that I clicked the Top Up tabs to view those with the biggest SCTR gains. Micron (MU) is the top...
READ MORE
MEMBERS ONLY
SystemTrader - Testing and Improving the 5-day RSI Mean Reversion System with the Sector SPDRs
by Arthur Hill,
Chief Technical Strategist, TrendInvestorPro.com
SystemTrader // System Rules and Conditions // Why 5-day RSI? // Testing with S&P 500 Trend Condition // Surviving Some Bad Signals // Sensitivity Testing // Reducing the MDD with Another Trend Condition // Testing Each SPDR Individually // The Power of the Portfolio // Further Study //// ........
Today's Trading Strategy article will test different trading...
READ MORE
MEMBERS ONLY
Using Raff Channel for Steep Trends - Apply Chandelier Exit to IWM - Scan Code for RSI-StochRSI Strategy - EEM Breakout
by Arthur Hill,
Chief Technical Strategist, TrendInvestorPro.com
Nothing to Do but Trail a Stop // Reviving the Raff Regression Channel for QQQ // Chandelier Exit for IWM // Retail Continues to Impress // Applying the 5-day RSI-StochRSI Strategy to IEF and TLT // USO, BNO and XES Stutter after Bullish Signals // Scan Code for RSI-StochRSI Strategy // Emerging and Latin American Markets Turn...
READ MORE
MEMBERS ONLY
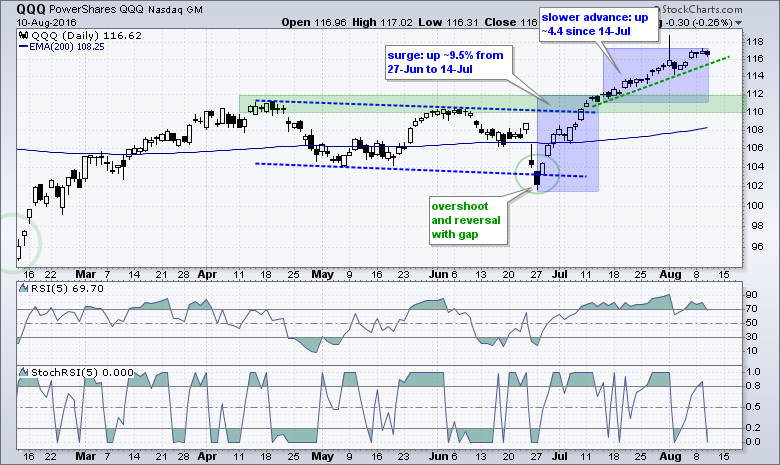
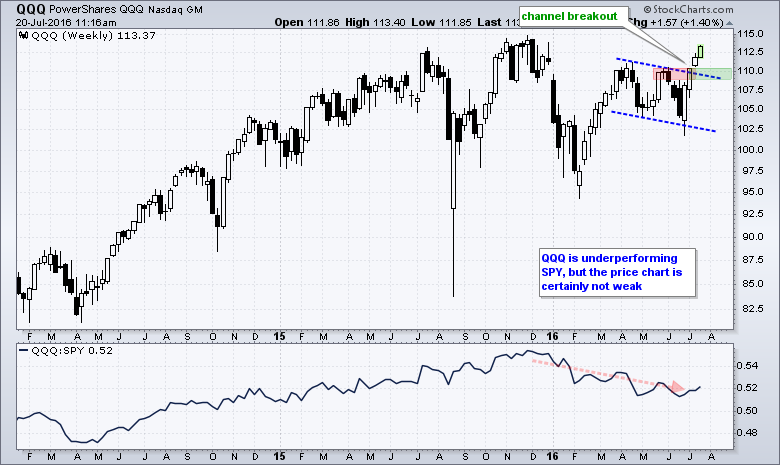
QQQ Sets Sights on All Time High with Channel Breakout
by Arthur Hill,
Chief Technical Strategist, TrendInvestorPro.com
The surge in stocks entered its fourth week with QQQ extending its channel breakout. The chart below shows the ETF surging earlier this year and then embarking on a correction with a falling channel into June. This correction clearly ended with the breakout near 110 and this zone now becomes...
READ MORE
MEMBERS ONLY
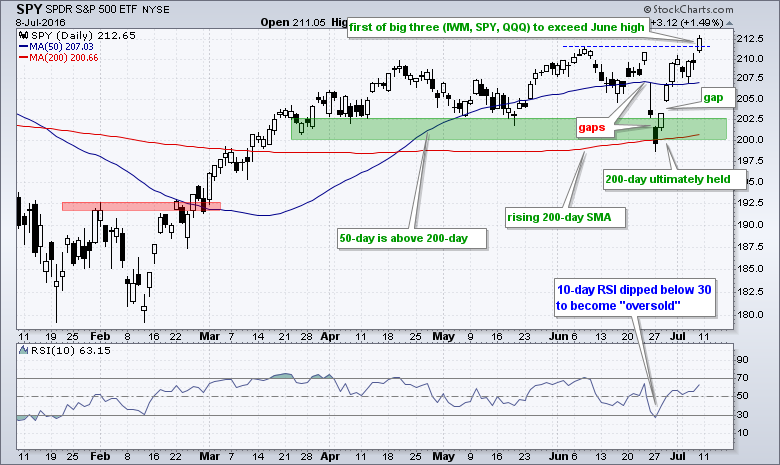
SPY Leads Big 3 - Sector SPDRs Reflect Broad Market Strength - Webinar Video
by Arthur Hill,
Chief Technical Strategist, TrendInvestorPro.com
Webinar Video
SPY Continues to Lead the Big Three // RSI Nears 70 for IWM // Sector SPDRs Reflect Broad Market Strength // Webinar Preview - Using Breadth Indicators // Submit a Webinar Question //// .....
SPY Continues to Lead the Big Three
Stocks are up sharply over the last three weeks with small-caps leading the...
READ MORE
MEMBERS ONLY
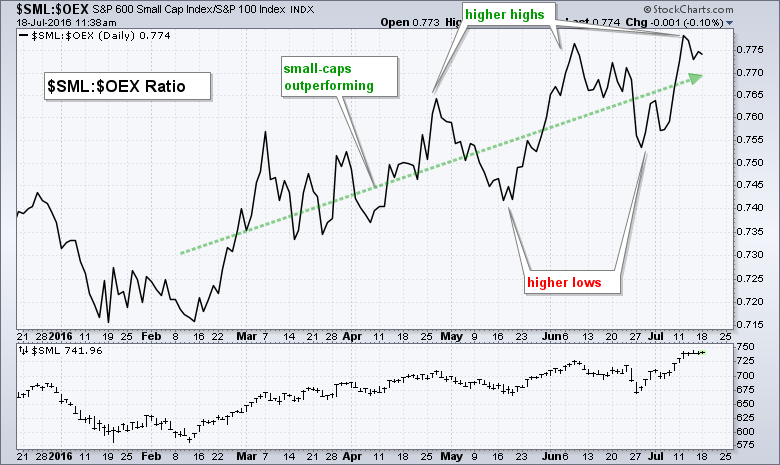
Small-caps Continue to Outperform Large-caps
by Arthur Hill,
Chief Technical Strategist, TrendInvestorPro.com
The S&P Small-Cap 600 has been leading the S&P 500 since mid February as a key ratio chart hit a multi-month high last week. The main window in the chart below shows the $SML:$OEX ratio, which plots the performance of the S&P Small-Cap...
READ MORE
MEMBERS ONLY
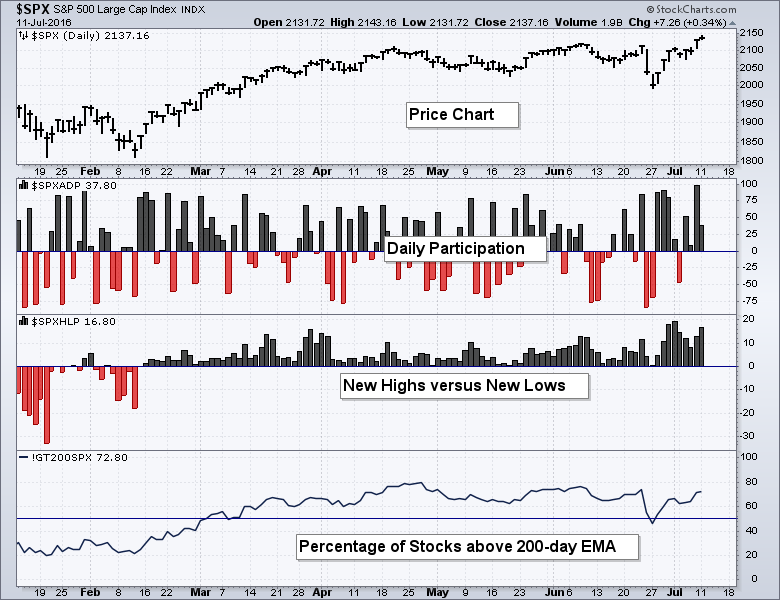
SystemTrader - Using High-Low Indicators to Determine the Broad Market Trend
by Arthur Hill,
Chief Technical Strategist, TrendInvestorPro.com
SystemTrader // Introduction - the Bias is Obvious // High-Low Percent Calculation // Massaging the Data with Different Indicators // Setting Bullish and Bearish Thresholds // Breaking Down the S&P 1500 for more Clues // Conclusions on this Trend Following Indicator // High-Low Percent Symbols at StockCharts //// . . . . .
Introduction - the Bias is Obvious
52-week highs...
READ MORE
MEMBERS ONLY
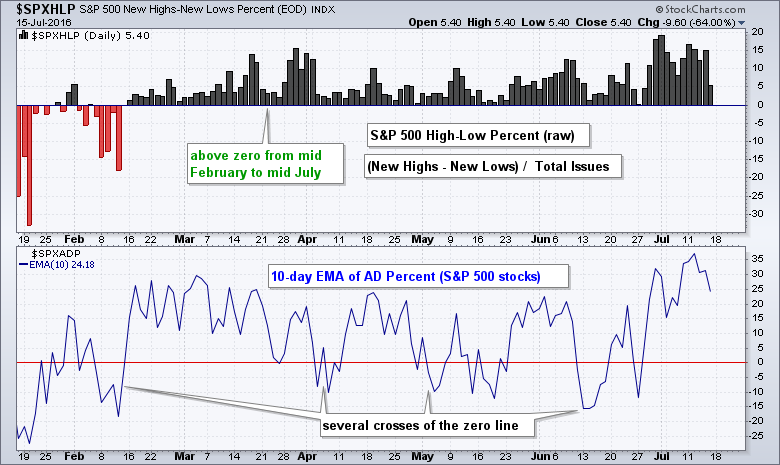
SystemTrader - Using Advance-Decline Percent to Measure Significant Shifts in Broad Market Breadth
by Arthur Hill,
Chief Technical Strategist, TrendInvestorPro.com
SystemTrader // Introduction // Picking the Market Benchmark // Advance-Decline Percent // Massaging the AD Data // Measuring Significant Shifts // Dividing, Conquering and Affirming // Conclusions AD Percent Indicators at StockCharts //// . . . . .
Introduction
This is the first in a multi-part series on the key breadth indicators I use to determine the broad market environment. Most readers are...
READ MORE
MEMBERS ONLY
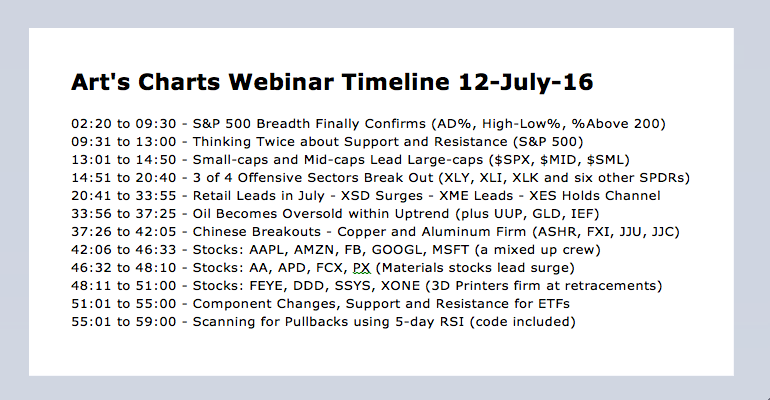
S&P 500 Breadth Confirms - Small-Cap New Highs Surge - Webinar Recording
by Arthur Hill,
Chief Technical Strategist, TrendInvestorPro.com
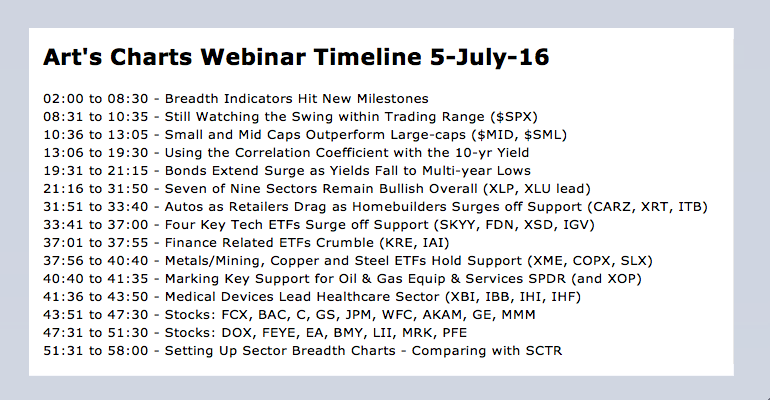
Webinar Video for Tuesday, July 12th
S&P 500 Reaches Uncharted Territory // Support and Resistance for Indexes and ETFs // Small-caps and Mid-caps Outperforming // S&P 500 Breadth Finally Confirms // Small-cap New Highs Surge // Percent above 200-day Stays Bullish // Webinar Preview //// .....
S&P 500 Reaches Uncharted Territory
The...
READ MORE
MEMBERS ONLY
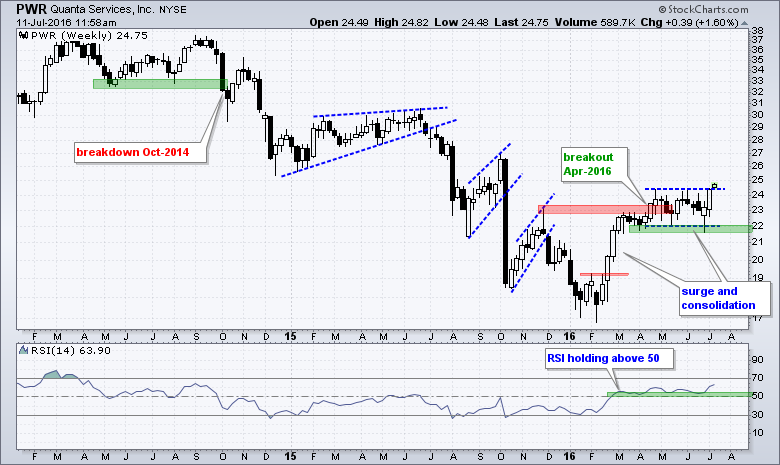
Quanta Services Breaks out of Consolidation
by Arthur Hill,
Chief Technical Strategist, TrendInvestorPro.com
Quanta Services (PWR) is showing signs of a long-term trend reversal with its third resistance break this year. The weekly chart shows PWR breaking down in October 2014 and trending lower until early 2016. This downtrend showed its first sign of reversing with the February surge and breakout near 19....
READ MORE
MEMBERS ONLY
Weekly Closing High for S&P 500 - QQQ Breaks Channel - New Highs Surge in Nasdaq 100 - Consumer Discretionary Comes Alive
by Arthur Hill,
Chief Technical Strategist, TrendInvestorPro.com
Bullish Resolution to an Already Bullish Chart // QQQ Breaks Channel Trend Line // New Highs Surge in Nasdaq 100 // Creating an Up-Down Pair Chart // Small-caps Come Alive // Consumer Discretionary Leads all Sectors // RCD Breaks June High //// .....
Bullish Resolution to an Already Bullish Chart
The stock market is up sharply over the...
READ MORE
MEMBERS ONLY
QQQ and IWM Hold Gaps - Measuring the Sector Balance - Golden Crosses Dominant Sector SPDRs - Amazon and Home Depot Power Retail
by Arthur Hill,
Chief Technical Strategist, TrendInvestorPro.com
SPY Looks More Bullish than Bearish // QQQ and IWM Hold the Gaps // Measuring the Sector Balance in the S&P 500 // All Nine Sector SPDRs have Golden Crosses Working // Healthcare SPDR Clears Benchmark High // Overbought, Oversold and the Bigger Trend // Amazon and Home Depot Power MarketVectors Retail ETF // Retail...
READ MORE
MEMBERS ONLY
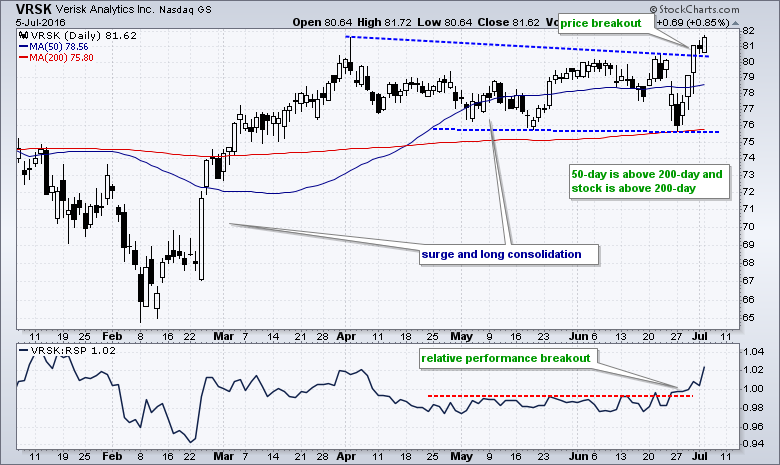
Verisk Analytics Leads with an Upside Breakout
by Arthur Hill,
Chief Technical Strategist, TrendInvestorPro.com
Verisk (VRSK) was not immune to the volatility of the last two weeks, but the stock held up well during the dip and outperformed during the bounce. First, notice that the stock ultimately held the mid May low and 200-day SMA during the late June dip. Second, notice that the...
READ MORE
MEMBERS ONLY
Watching the Swing within the Range - New High in Broad AD Line - Falling Yields Hurting Banks - Webinar Video
by Arthur Hill,
Chief Technical Strategist, TrendInvestorPro.com
Still Watching the Swing within Trading Range // Mid-caps Outperform Large-caps // Small-caps Hold Support Zone // Breadth Indicators Hit New Milestones // Bonds Extend Surge as Yields Fall // Falling Yields Weigh on Finance-related Groups // Break Down Holds for Finance SPDR // Webinar Preview //// .....
Still Watching the Swing within the Range
The S&P...
READ MORE
MEMBERS ONLY
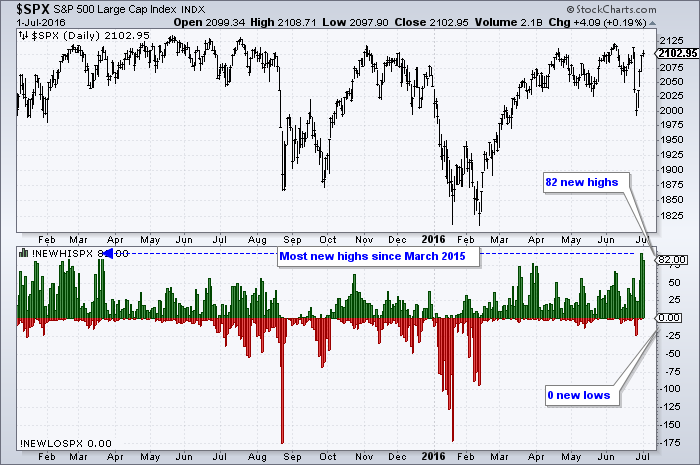
New High Surge Shows Broadening Participation
by Arthur Hill,
Chief Technical Strategist, TrendInvestorPro.com
The S&P 500 surged over the last four days and new highs in the S&P 500 expanded to their highest level since March 2015. The chart below shows $SPX surging around 5% in four days and new highs exceeding 80 the last two days. Even though...
READ MORE
MEMBERS ONLY
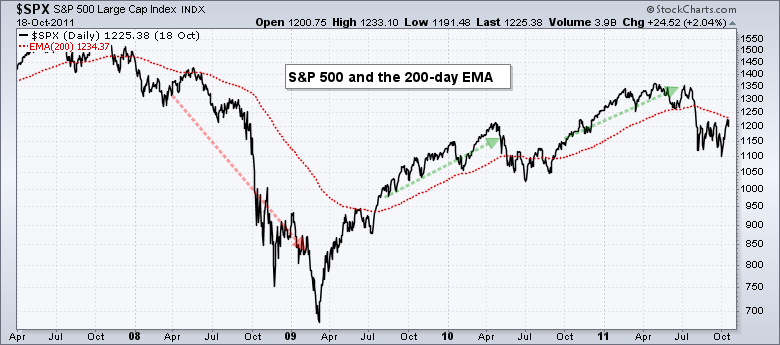
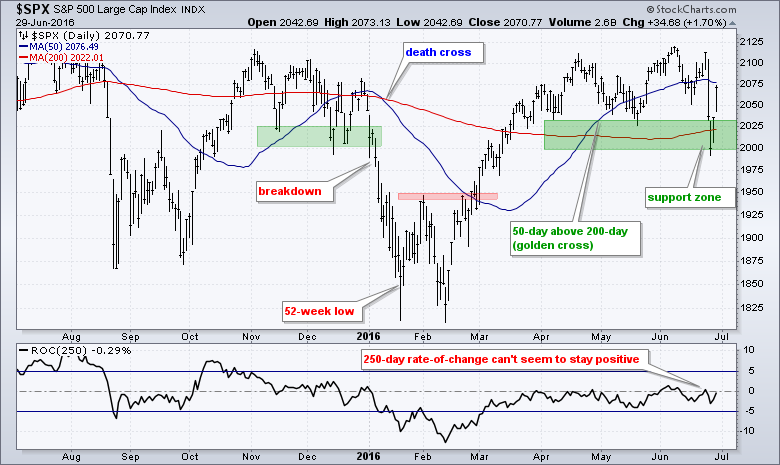
A Clear Trend and Pattern Emerge on Monthly S&P 500 Chart
by Arthur Hill,
Chief Technical Strategist, TrendInvestorPro.com
Chartists will look back at the long-term charts and try to figure out where exactly this big Brexit panic actually occurred. Was there even such an event? There is something to be said for monthly close-only charts because they filter a lot of noise, and June was definitely a month...
READ MORE
MEMBERS ONLY
SystemTrader - Testing a Basic Mean Reversion System - Catch the Knife or Wait for the Bounce? - Take Quick Profits or Wait for Counter Signal?
by Arthur Hill,
Chief Technical Strategist, TrendInvestorPro.com
SystemTrader // Testing a Basic Mean-Reversion System // Tweaking RSI for Sensitivity // Setting the Ground Rules // Mean Reversion Scan Code // Buy the Falling Knife // Buy after the Bounce // And the Best System Is.... // A Portfolio with No Exceptions // Would You have the Guts? // Further Study //// ........
Testing a Basic Mean Reverions System
Today...
READ MORE
MEMBERS ONLY
SPX Holds Key Level - A Little Smoothing Can Go a Long Way - IWM Forms Island Reversal - Three Biotechs to Watch
by Arthur Hill,
Chief Technical Strategist, TrendInvestorPro.com
S&P 500 Affirms Uptrend with Big Bounce // Short-term Smoothing Improves Returns and Reduces Drawdowns // QQQ leads Recover as IWM Forms Island Reversal // HealthCare SPDR Shows Some Resilience // EW Technology Holds May Low // Five Stocks to Watch: ORCL, CMCSA, ABBV, CERN and ZTS //// .....
S&P 500 Affirms Uptrend...
READ MORE
MEMBERS ONLY
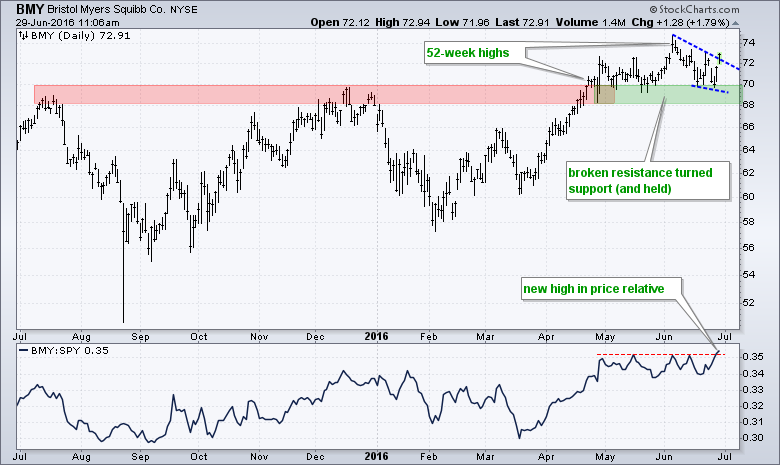
Bristol Meyers Leads as Price Relative Hits New High
by Arthur Hill,
Chief Technical Strategist, TrendInvestorPro.com
Chartists need just two plots to find leaders and stocks in uptrends: price and the price relative. Price, of course, can be a line chart, bar chart or candlestick chart. Stocks hitting 52-week highs are in clear uptrends and often leading the market. Bristol Meyers is one such stock because...
READ MORE
MEMBERS ONLY
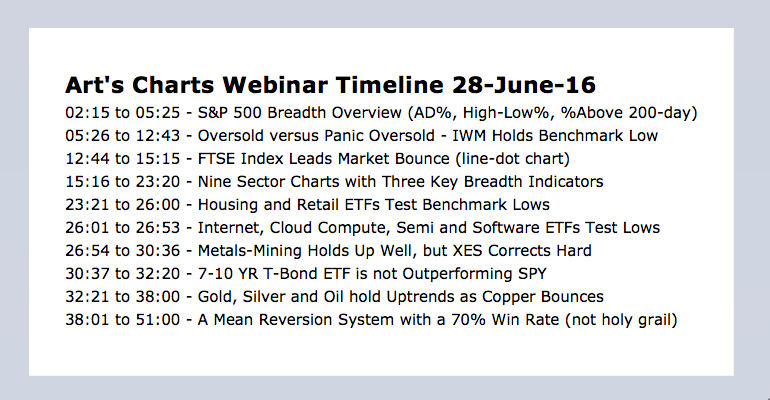
Oversold versus Panic OVERSOLD - IWM Holds the May Low - Revisiting the Sovereign Debt Crisis - Webinar Video
by Arthur Hill,
Chief Technical Strategist, TrendInvestorPro.com
Oversold versus Panic OVERSOLD // IWM Holds the May Low // Housing and Retail Test Benchmark Lows // XSD Becomes Most Oversold // Revisiting the Sovereign Debt Crisis // Brexit View from Belgium //// .....
Oversold versus Panic Oversold
Stocks plunged the last two days and most are short-term oversold. Not just oversold, but panic oversold. Note...
READ MORE