Are Bearish Momentum Divergences Warning of a Market Top?

During extended uptrends, such as what we’re currently observing with several leading growth stocks (e.g., semiconductors), it becomes important to watch diligently for signs that there could be a “change of character” on the charts.
To be clear, the long-term uptrend phase evident on charts like Micron (MU) can also be seen on industrial names like Caterpillar (CAT), banks like Morgan Stanley (MS), and others representing many different S&P 500 sectors. As long as new highs are driven by strong positive momentum, it’s fair to expect that the uptrend phase will likely continue. But when we see a “bearish momentum divergence” of higher price action combined with lower trends in the Relative Strength Index (RSI), then we have to question the sustainability of the accumulation phase.
The chart of Micron provides a good example of the types of long-term uptrends to be found in the semiconductor group. Note the consistent pattern of higher highs and higher lows, plus the upward-sloping moving averages that confirm the consistency of the uptrend in Q2.
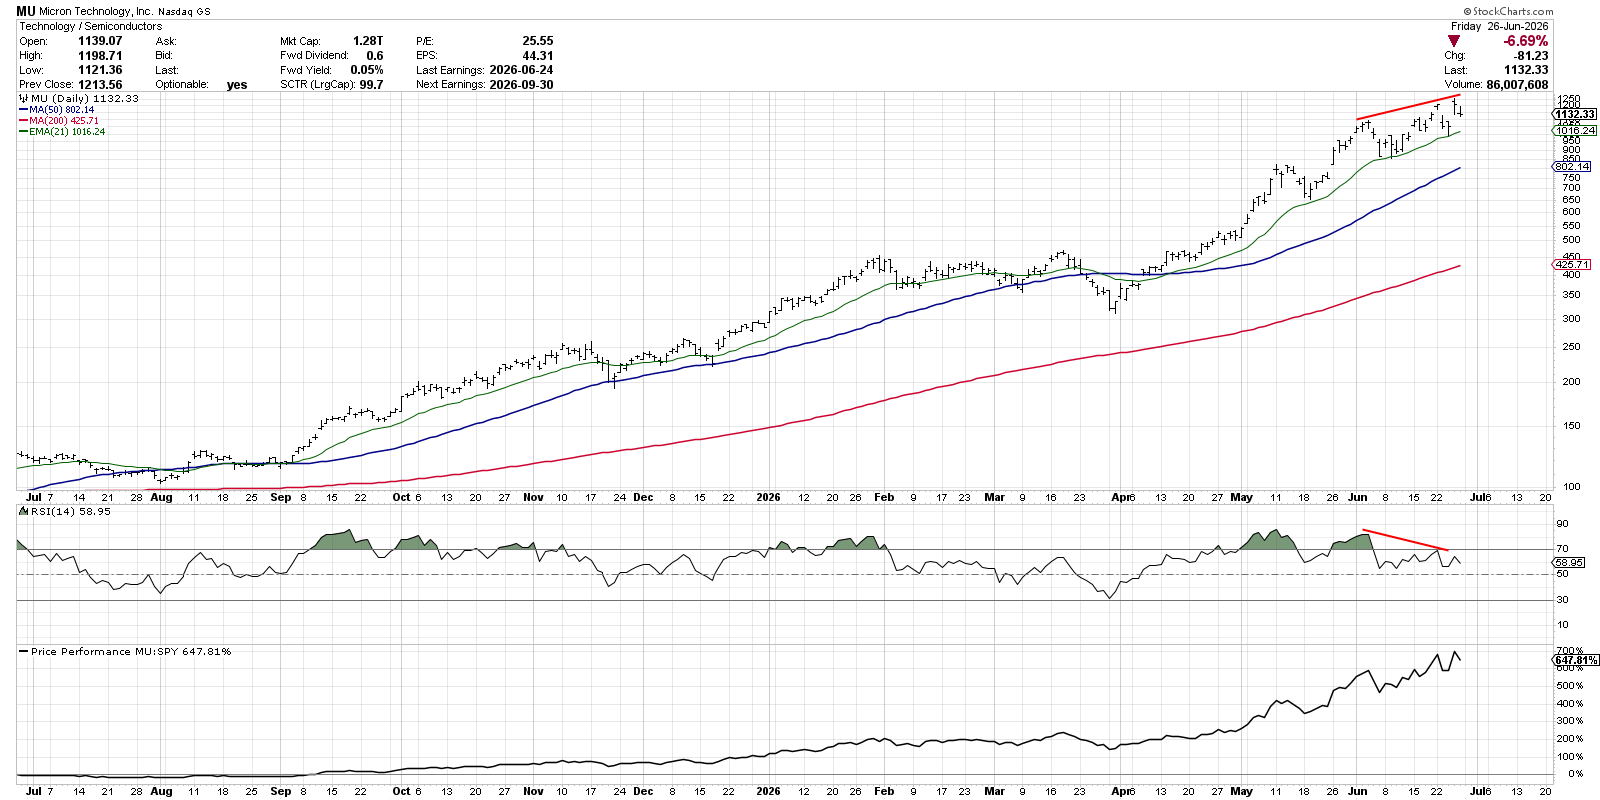
The new all-time high in early June was marked by an RSI up above the 80 level, but subsequent peaks in late June saw the RSI just barely reach the overbought level of 70. While a bearish momentum divergence such as this does not guarantee a major peak in price, it does suggest a weakening of momentum and a lack of upside support.
While these divergences are prevalent in the technology sector, we can also find these bearish warning signs in charts like Morgan Stanley.
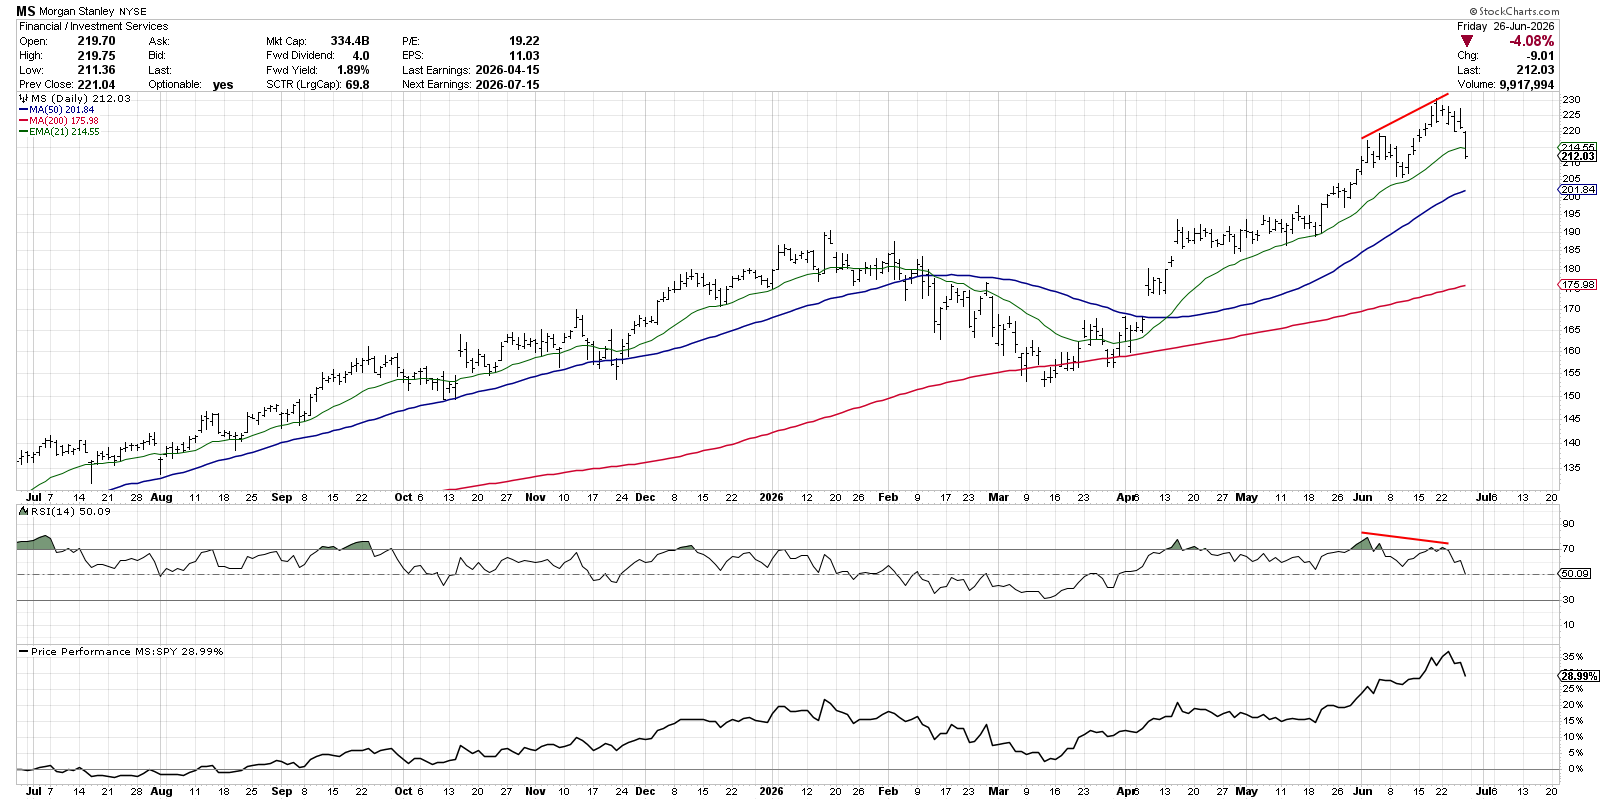
If you covered up the ticker, you might actually assume that you’re looking at a semiconductor chart! With similar trend patterns, a clear resemblance in the moving average configuration, and improving relative strength readings, MS looks to be firing on all cylinders.
Morgan Stanley traded lower on Friday along with a number of other financial institutions, pushing the stock below its 21-day exponential moving average. So what do we look for on charts that present a clear momentum divergence? Essentially, we want to watch the RSI to see if it remains in the bullish range. As we covered in our latest show on StockCharts TV, the RSI needs to remain above 40 to confirm an ongoing uptrend on the medium-term timeframe.
If MS were to experience a deeper drawdown next week, and the RSI were to fall below the 40 level, that could indicate a new distribution phase for the stock. A quick review of Caterpillar shows how a chart like this could actually resolve in a positive direction.
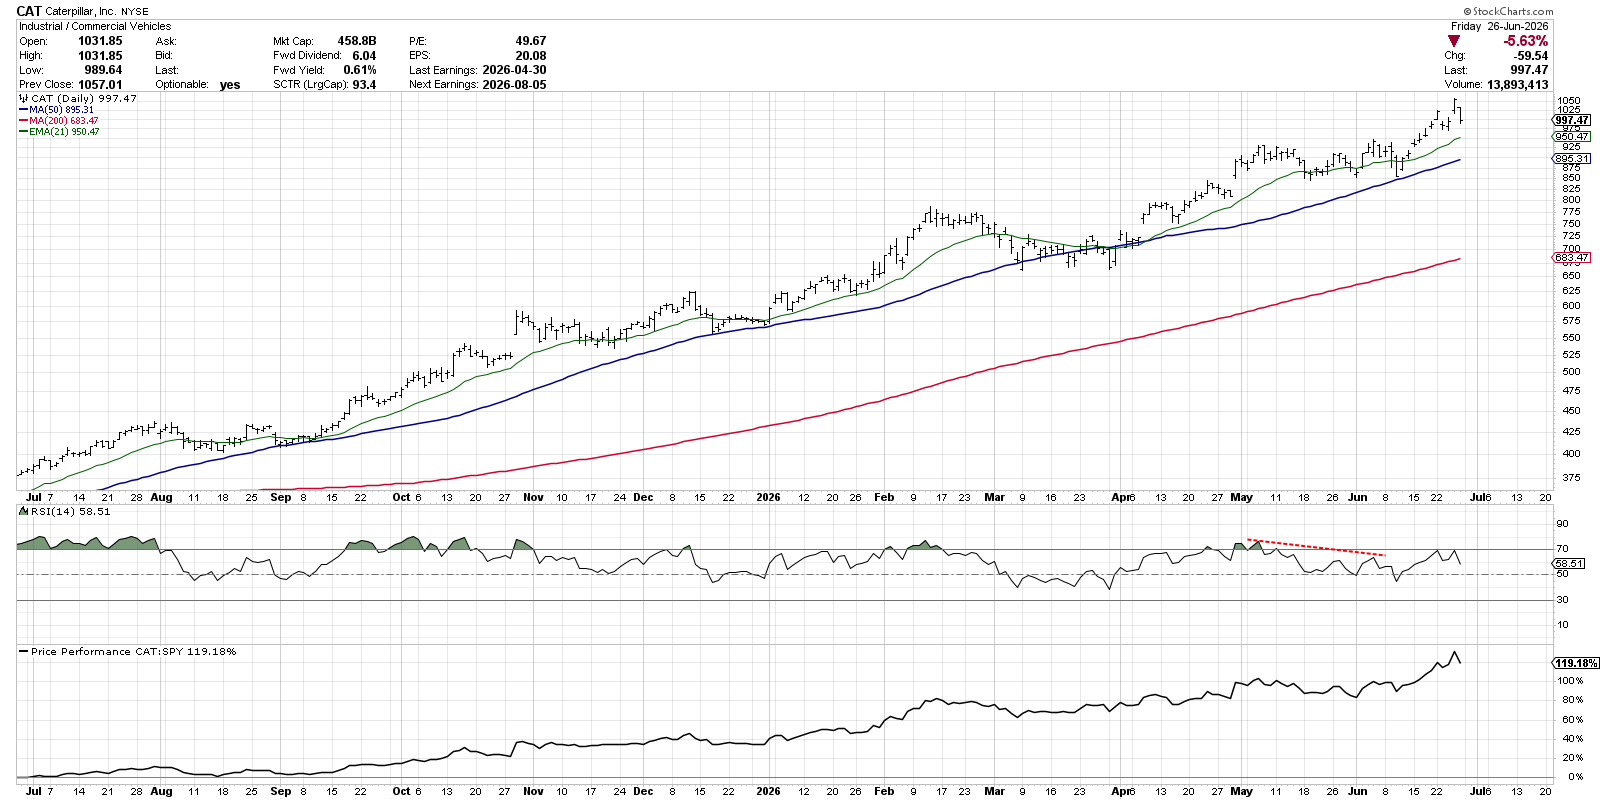
We can see a very similar bearish momentum divergence in May and June, with higher price highs combined with lower highs in RSI. In mid-June, CAT broke to a new 52-week high on stronger price momentum. The RSI pushed back up to the 70 level during that upswing in price, suggesting an influx of buying power and a continuation of the accumulation phase.
This proliferation of bearish momentum divergences certainly has us digging out our Market Top Checklist, reflecting on growing signs that this market is indeed in a crucial period of transition. Now is the time for investors to closely monitor momentum levels on previous leadership, as pullbacks marked by negative momentum have often provided a prescient warning of further weakness to come.
For further coverage of these bearish momentum divergences, check out our daily market recap show!

RR#6,
Dave
P.S. Ready to upgrade your investment process? Check out my free behavioral investing course!
David Keller, CMT
President and Chief Strategist
Sierra Alpha Research LLC
marketmisbehavior.com
https://www.youtube.com/c/MarketMisbehavior
Disclaimer: This blog is for educational purposes only and should not be construed as financial advice. The ideas and strategies should never be used without first assessing your own personal and financial situation, or without consulting a financial professional.
The author does not have a position in mentioned securities at the time of publication. Any opinions expressed herein are solely those of the author and do not in any way represent the views or opinions of any other person or entity.