Gold Triggers a Squeeze-Thrust Sequence; Second Time in 12 Months
Key Takeaways
- For the second time in 12 months, GLD went through a Bollinger BandⓇ squeeze-thrust sequence.
- GLD broke above resistance and moved above the upper Bollinger Band.
The SPDR Gold Shares (GLD) turned boring in July as price action contracted and the Bollinger BandsⓇ narrowed. As in August 2025, falling asleep is not an option, as boring periods often give way to excitement. Gold is following the August 2025 script with a squeeze play and strong breakout this week.
The Squeeze Play is on for GLD
GLD went through a Bollinger Band squeeze-thrust sequence for the second time in 12 months. The first squeeze-thrust sequence occurred in summer 2025 and foreshadowed a big run into January 2026.
On the price chart, Bollinger Bands (20,2) are in area format with blue shading, which makes it easy to see the widening and narrowing. Notice how the Bollinger Bands narrowed significantly from late June to late August 2025. This narrowing range reflected low volatility as GLD consolidated within a tight range, with the Bollinger Bands squeezing prices. The theory here is that a volatility expansion will follow a volatility contraction, and this expansion can lead to a big move.
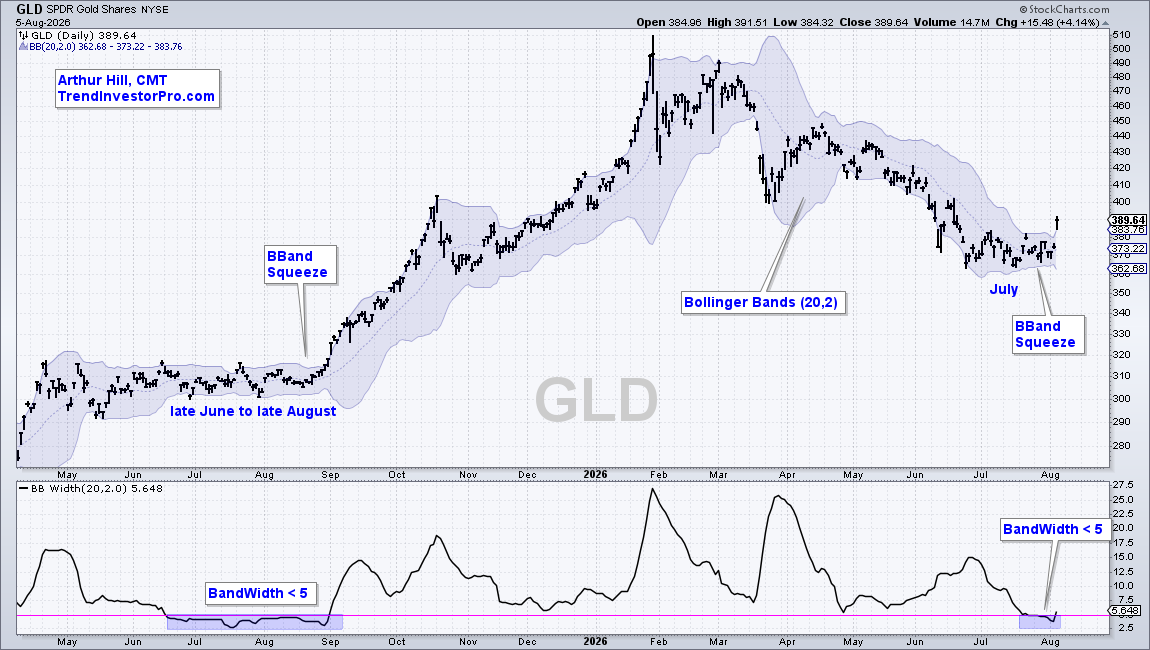
The indicator window shows BandWidth (20,2), which quantifies the distance between the upper and lower Bollinger Bands. Notice how BandWidth fell below 5 from late June to late August 2025 (blue shading). BandWidth again fell below 5 in July, which confirms a significant narrowing. The squeeze play is on!
This week at TrendInvestorPro:
- Biotech ETFs Setup Up (plus two biotech stock setups)
- Eight AI ETFs Bidding to End Corrections and Extend Uptrends
- Copper Hits New High as Copper Miners Break Out
- Gold Breaks Out as Oil and Dollar Turn Lower
Click here to take a trial and gain full access.
From Squeeze to Strong Breakout
The Bollinger Band squeeze alerts traders to a volatility contraction that can lead to a volatility expansion and big move. However, this squeeze doesn't offer any directional clues, and chartists must use other technical tools for a directional bias. TrendInvestorPro was also focused on the corrective pattern and Bullish Setup Zone.
Directionally, GLD broke resistance with a price thrust, which is bullish.
Let's first review the signal in late August 2025. After the Bollinger Band squeeze into late August, GLD broke resistance with a strong move and recorded multi-month highs. This move was so strong it pushed prices well above the upper Bollinger Band as %B hit 1.31. %B moves above 1 when the close is above the upper Bollinger Bands. A value of 1.31 reflects a significant move above the upper Bollinger Band. This shows strong upside momentum that further validates the breakout.
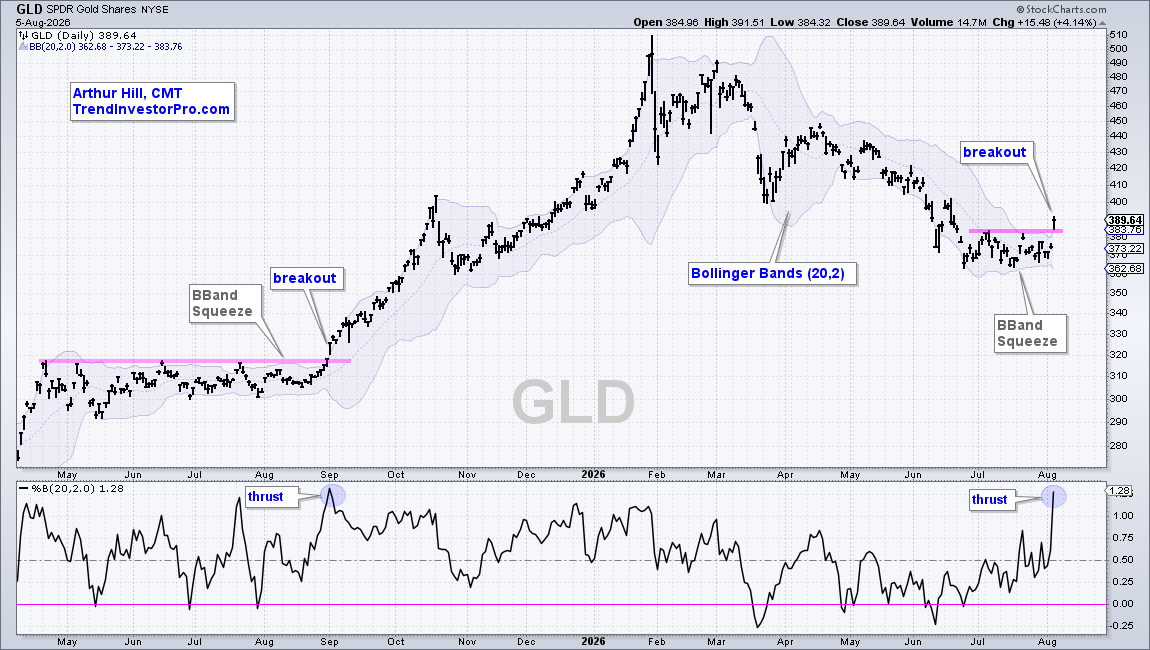
Turning to the current move, GLD broke resistance from the July highs with a strong move on Wednesday. This move also broke the upper Bollinger Band as %B hit 1.28, its highest level since September 2nd. A resistance breakout and significant move above the upper Bollinger Band are bullish for GLD. A close below the July lows would call for a re-evaluation.