Looking Beyond Technology for Market Leadership

While investors have understandably been focused on the dominance of the AI trade, several S&P 500 ($SPX) sectors have managed to log some meaningful outperformance in recent months. And even though the major equity benchmarks are very growth-oriented in 2026, it’s worth remembering that many sectors often have a much lower correlation to the technology sector.
A viewer of my daily market recap show recently posed this question on our weekly mailbag episode:
For XLB (Materials) and XLI (Industrial), which one do you consider more of a barometer of the U.S. economy, and do you think the stock market takes cues from one or the other?
The Sector PerfChart page on StockCharts includes a visualization showing an idealized sector rotation relative to market and economic cycles. This chart was developed based on the work of legendary market strategist Sam Stovall of CFRA Research, and shows which sectors tend to lead at different phases of the market cycle.
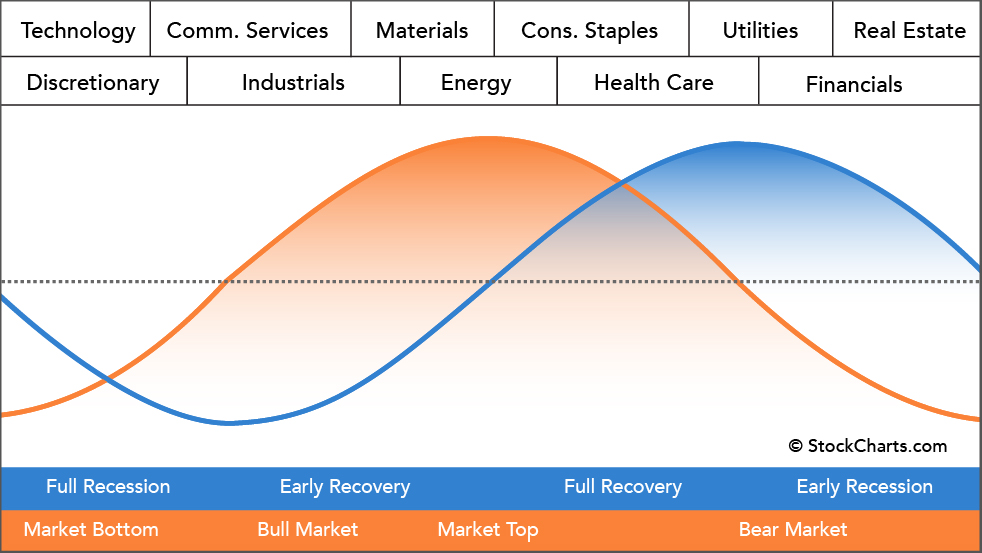
In early bull market phases, growth sectors like Technology and Consumer Discretionary tend to drive the market higher. As the bull market matures, “late cycle” sectors including Materials, Industrials, and Energy tend to take on a leadership role. And while the sectors don't always follow this idealized leadership pattern, my mentor Ralph Acampora often pointed out that healthy bull markets often see a rotation in leadership.
This transition to areas of emerging strength was often an important factor to confirm the sustainability of a broad market advance. With previous leaders, including semiconductors, stuck in a pullback phase, have we observed a broader rotation to these late-cycle sectors?
Well, several stocks in Materials, Industrials, and Energy have been doing quite well for some time! And while we’ll keep an eye on sector breadth readings to identify sectors with increasing strength, here is one stock from each of the sectors that has demonstrated technical strength going into August.
Nucor Corp. (NUE)
Steel companies have experienced renewed strength in recent weeks, but this comes after a long uptrend phase going back to mid-2025. NUE is a good example of how a strong price trend has led to strong outperformance.
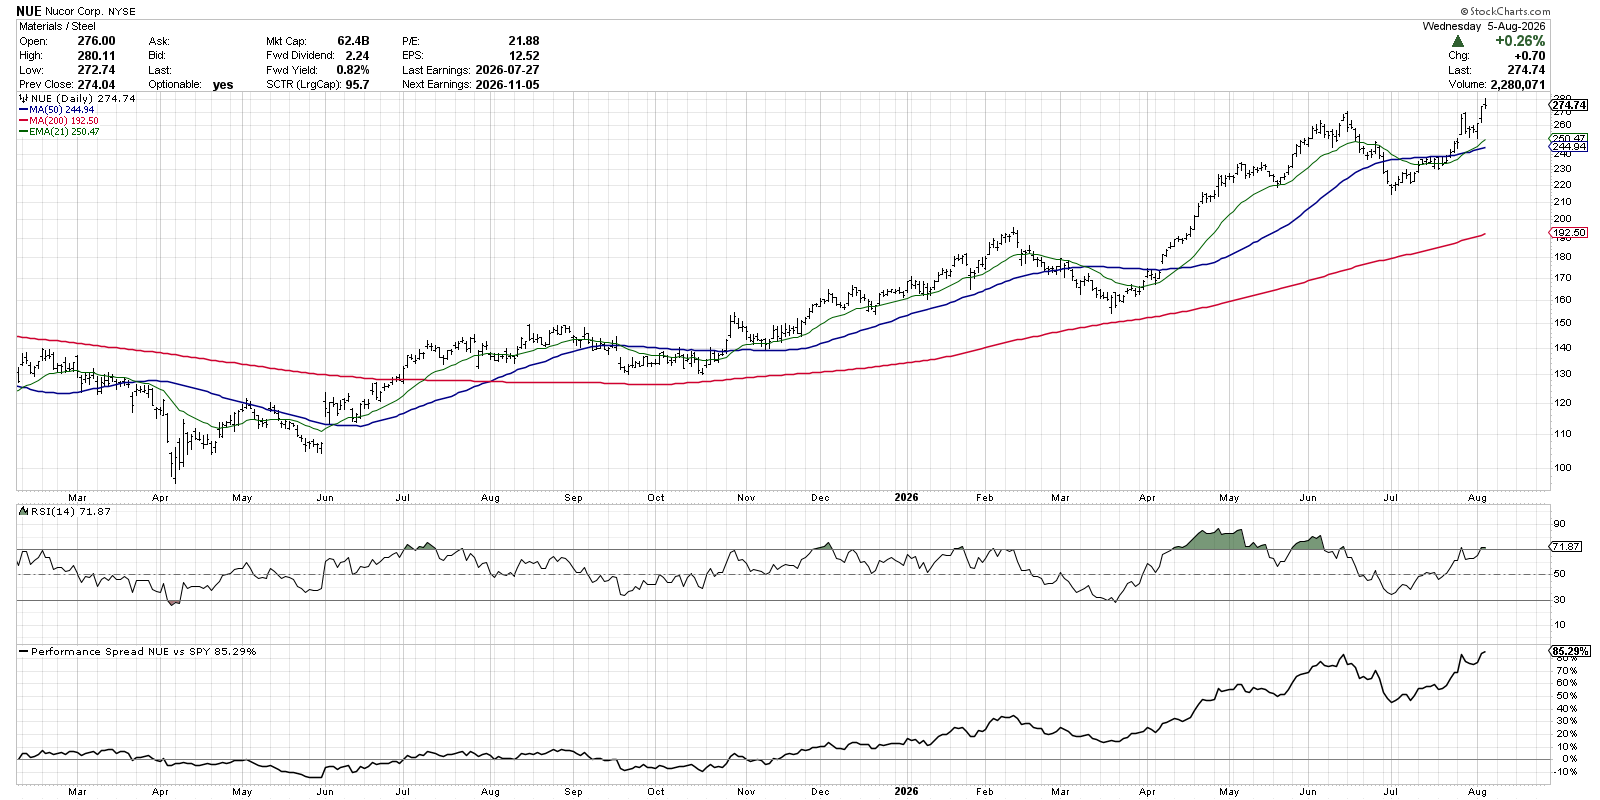
In the bottom panel, we’re using the new Performance Spread indicator to show the performance differential between NUE and SPY over the last 18 months. What’s compelling about this chart is how the stock outperformed the S&P 500 during previous market rallies in Q1 and Q2.
And while the Relative Strength Index (RSI) is recently overbought, I’m noting similar conditions in December 2025 and July 2025, when the strong momentum often led to further trend strength in the coming months. With NUE back above moving average support, the trend appears to be resuming an upward push.
Howmet Aerospace Inc. (HWM)
Shares of Howmet have been in a fairly consistent pattern of higher highs and higher lows going all the way back to April 2025. This strong uptrend in price has led to consistent outperformance for this leading aerospace company.
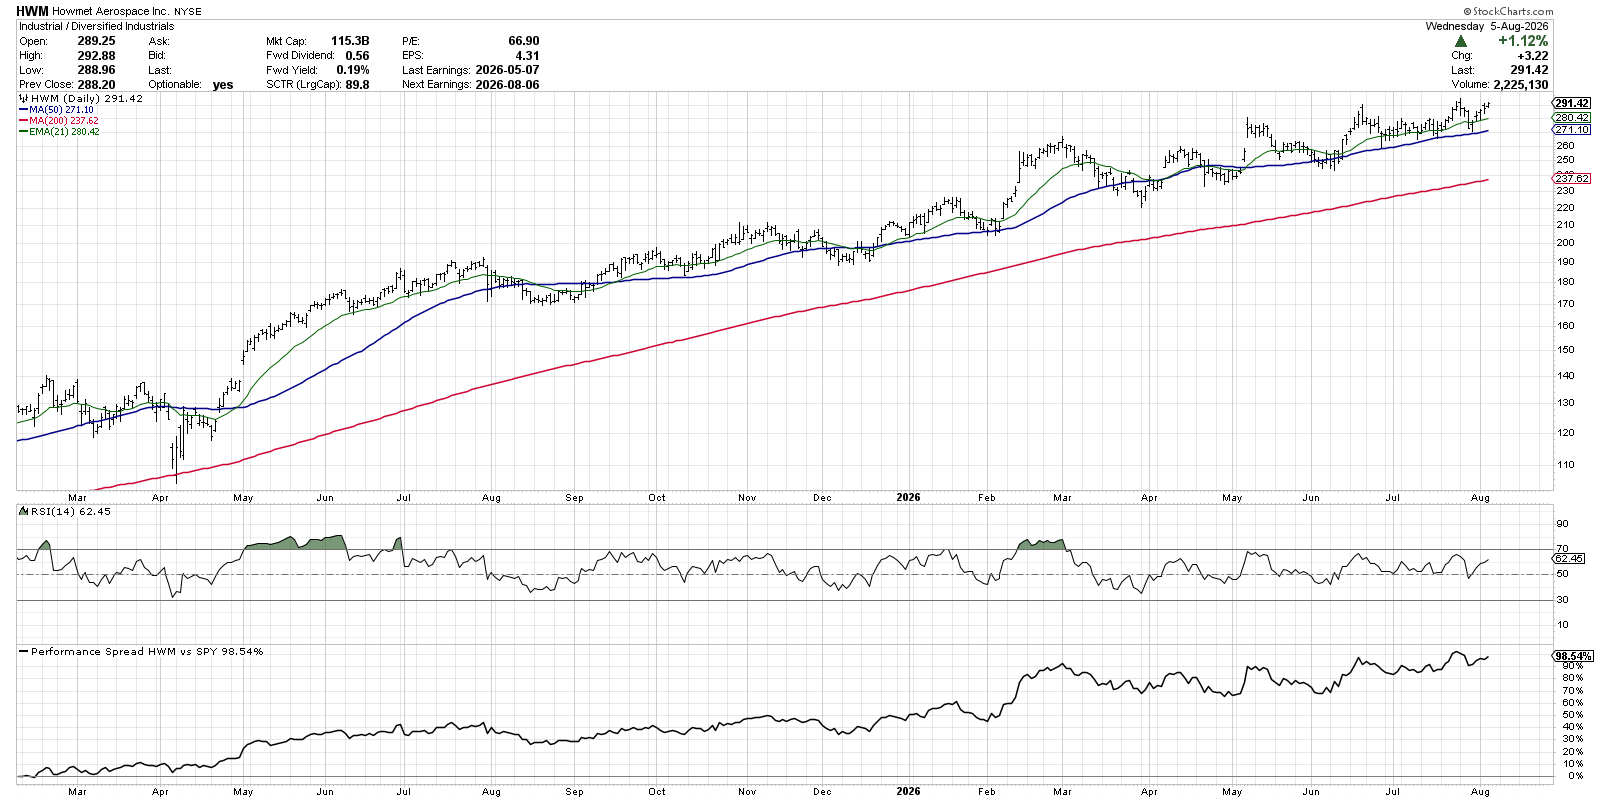
The chart of HWM illustrates how long-term outperformers often go through short-term periods of underperformance. But just as we would monitor the price action to ensure it remains above key moving averages, we also want to track that the relative performance line is generally trending higher and making higher lows, even during short-term pullbacks.
Phillips 66 (PSX)
Now, the Energy sector is driven primarily by crude oil prices, so, given the volatility of the situation in the Middle East, the chart of most energy stocks also includes an excessive amount of volatility these days. Phillips 66 has been a much stronger long-term play, mainly because downstream names are usually much less impacted by crude oil prices.
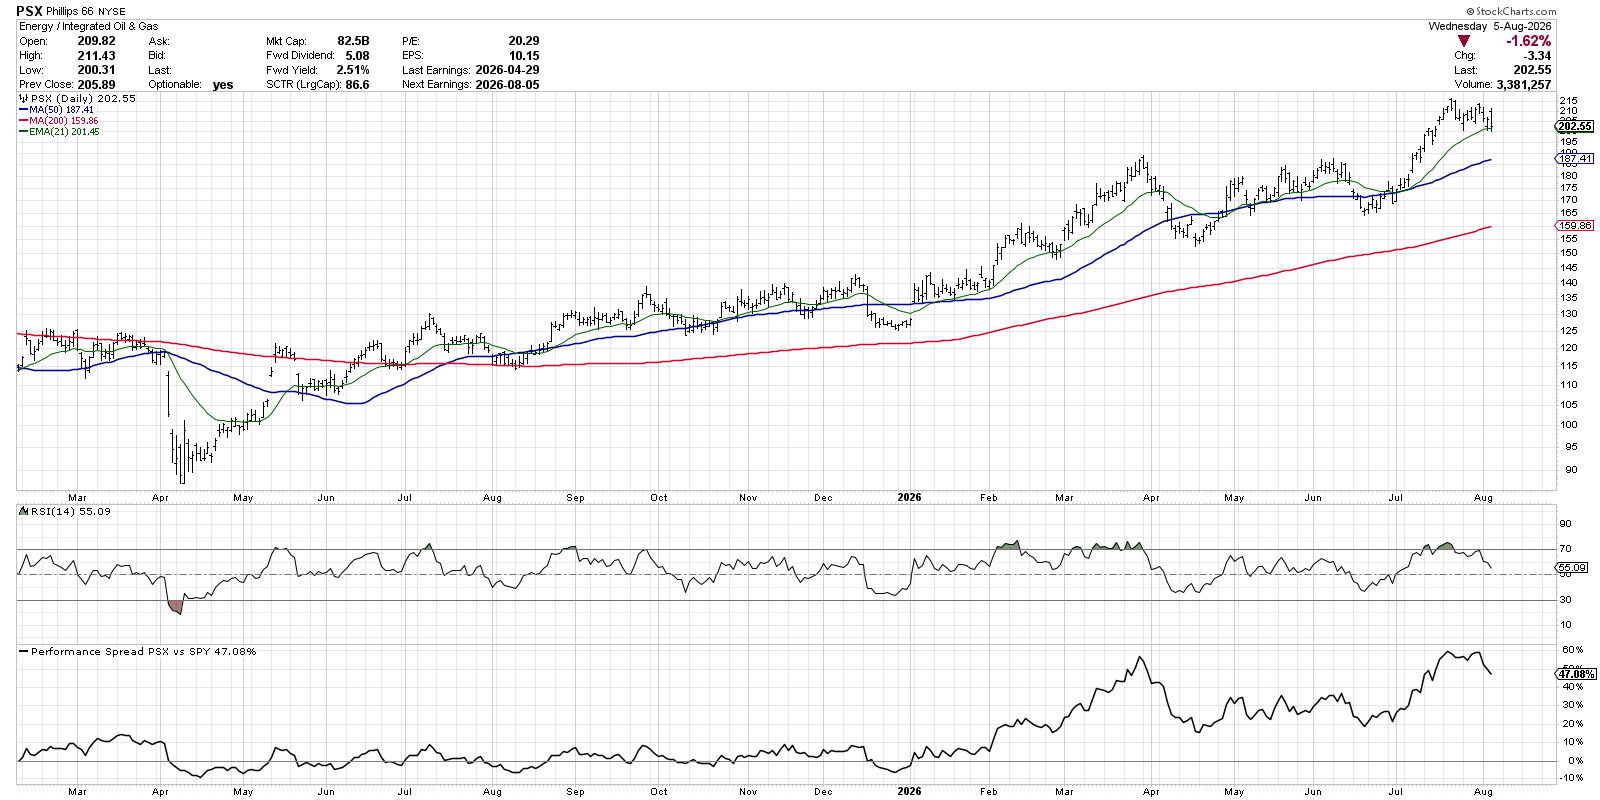
PSX actually made a new 12-month relative high in July, as the stock achieved a new price high while the S&P 500 index remained rangebound. The stock remains above upward-sloping 50-day and 200-day moving averages and, as long as PSX continues to make higher lows, the uptrend appears to be in good shape.
Mindful investors know that by tracking sector rotation themes, we can relate this information to idealized market cycles and reflect on a broader market message. By spending more time scanning for strong relative performance in late cycle leadership names, we can be better prepared for the next shift in market cycle!
This topic was featured in our latest weekly mailbag episode, which you can find over on our YouTube channel.
RR#6,
Dave
P.S. Ready to upgrade your investment process? Check out my free behavioral investing course!
David Keller, CMT
President and Chief Strategist
Sierra Alpha Research LLC
marketmisbehavior.com
https://www.youtube.com/c/MarketMisbehavior
Disclaimer: This blog is for educational purposes only and should not be construed as financial advice. The ideas and strategies should never be used without first assessing your own personal and financial situation, or without consulting a financial professional.
The author does not have a position in mentioned securities at the time of publication. Any opinions expressed herein are solely those of the author and do not in any way represent the views or opinions of any other person or entity.