Gold Just Broke Out. Is the Debasement Trade Back?
Key Takeaways
- Gold broke through key downtrend resistance, posting its best weekly gain since January.
- Shares of gold miners showed even greater strength, with GDX surging 21.3% for its best week since 2008.
- The debasement trade may have returned, though rising real interest rates and potential gold resistance near $4500–$4600 challenge the bullish reversal.
The S&P 500 ($SPX) broke out to all-time highs, rising 3.6% for its best week since April. It was a global story, too, with the Vanguard FTSE All-World ex-US ETF (VEU) tacking on 2.9% of its own, tagging a record weekly settle if you include dividends. Markets digested a slew of clearing events, including the Situational Awareness hedge fund blow-up and partial ‘takeunder’ by Citadel, Fed Chair Warsh’s shaky FOMC presser, massive deleveraging across the chip stocks, and then last Friday’s July jobs report.
The macro backdrop may not feel firm, but price action calls for optimism. Bears still point to the conflict in Iran, which could lift oil prices and Treasury yields on a whim. That story has been ongoing for many months now, but a new real-asset development caught intermarket traders’ attention to begin August.
Gold Returns to Flat YTD
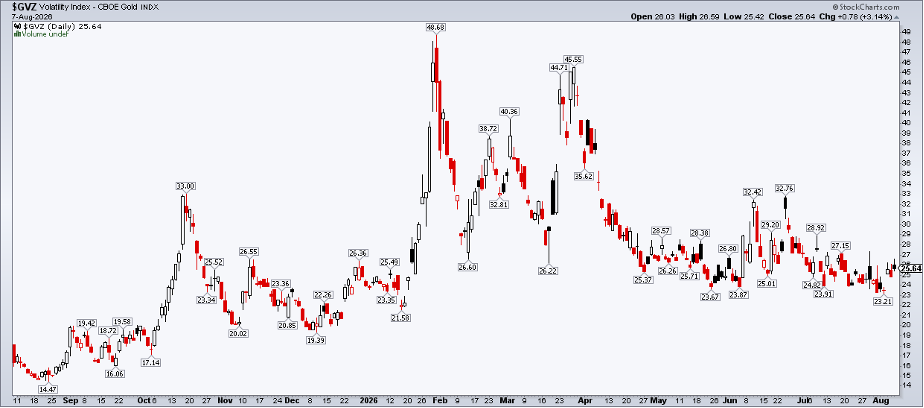
Gold posted its best week since January, back when it hit a record high. The rally seemed to come out of nowhere, too, as the Gold Volatility Index ($GVZ) had been stagnant for months leading into the price thrust. Even with the 7.5% advance, $GVZ is on track to begin Inflation Week on Wall Street at just 26%.
Zooming out, the yellow metal is back in black for the year, up half a percentage point ahead of July CPI, PPI, and Retail Sales data that rolls in starting Wednesday morning.
Downtrend Busted
Spot gold now enters the mid-August stretch on a heater. Notice in the chart below that the shiny metal rallied through its now-flattening short-term 50-day moving average last Wednesday. That bullish marubozu candle, marking gold’s best session since February 3, was pivotal technically, as it emphatically pierced the major downtrend resistance line that dated back to early Q1. Gold bugs then got their price-action confirmation over the second half of the week, followed by Friday’s exclamation point.
Also take a look at the RSI momentum oscillator at the top of the chart. It's now at its highest mark since late January, when the crash began. This means momentum largely confirms the price ascent. It’s by no means clear skies above, though, as evidenced by the also-flat 200-DMA. I see potential resistance in the $4500 to $4600 zone; that's where gold notched a short-term peak last December, and a spot from which the hard asset broke down in early June (not to mention having confluence with the 200-DMA).
To clutter gold’s chart even more, I applied Fibonacci retracement levels. The 38.2% level is just below $4600, adding further credence to resistance being not too far above the current price.
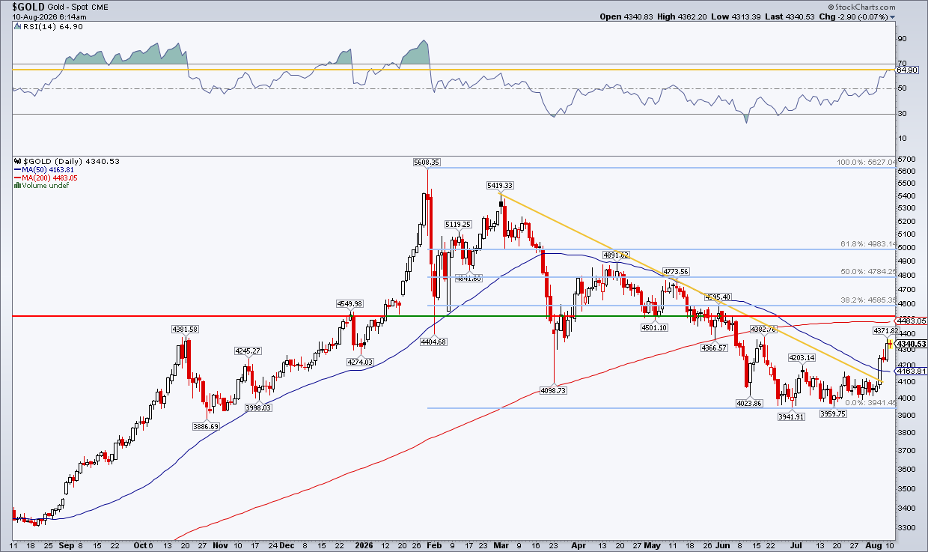
The upshot? The rally has legs, but don’t be surprised to see gold take a breather toward the end of the quarter. A consolidation followed by a year-end rebound is certainly not out of the question, though, following a major Q1–Q2 price and sentiment reset.
Gold Miners Had Their Best Week Since the GFC
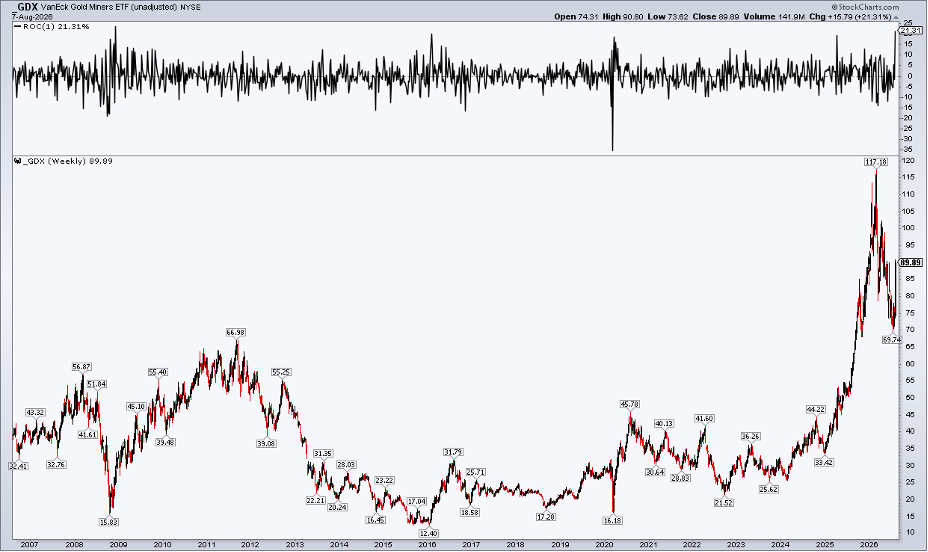
Gold miners were several notches more explosive than the metal. The VanEck Gold Miners ETF (GDX) scored an outright historic 21.3% gain, its best weekly climb since December 2008.
Readers know I enjoy finding those “best since...” stats. Here’s how I do it: On a SharpChart, apply the Rate of Change (ROC) indicator, then be sure to toggle on the Inspect (Crosshairs) button located above the chart. From there, you can hover over the notable periods.
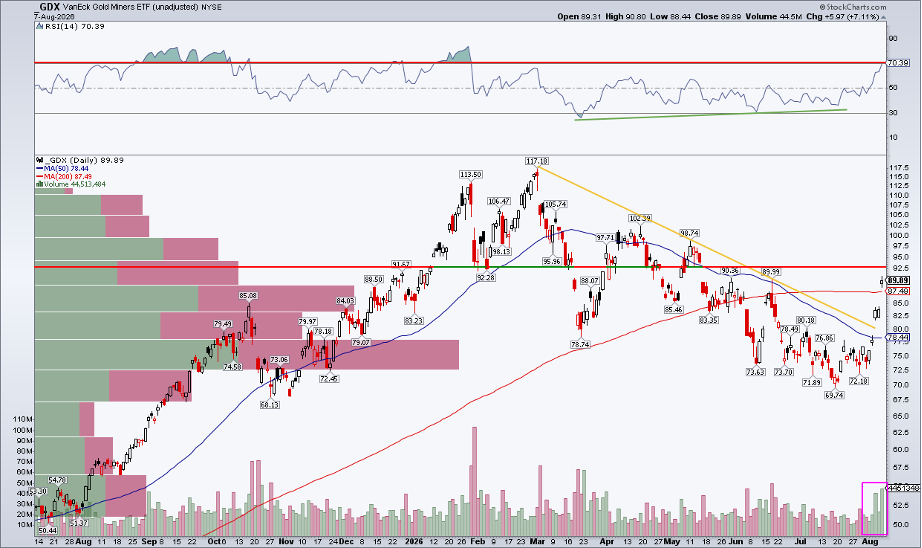
Pennies from its best weekly gain in the fund’s 20-year history, GDX rose through its 50-DMA with vigor last Friday. Like gold, a bearish death cross in June confirmed a downward trend, suppressing any inklings of bullish hope. Now on a 5-day winning streak (on sizable volume), GDX’s RSI is also the best since early in the year, and its downtrend line was breached. RSI momentum hinted at a price reversal, though. Like gold, bullish RSI divergence brewed in Q2, meaning that, as price fell further, momentum was making higher lows.
Today, with a high amount of Volume-by-Price below last Friday’s settle, there should be support upon a pullback (such as the filling of any of the three August gaps). Though not illustrated on this chart, GDX (like gold) is now above its 38.2% Fibo retracement level. Soft resistance could come into play near $92–$93.
Interestingly, if we peel back the chart, GDX defended its September 2011 high of $67 this summer. The polarity principle asserts that former resistance should become new support, and (so far) GDX is a case in point.
Cross-Asset Trends
From an intermarket perspective, rising real interest rates are the obvious potential headwind for gold and GDX, while higher oil is often a near-term momentum killer for gold miners. But even considering multi-year peaks in real yields, gold demonstrates absolute and relative strength. Bitcoin, too, has found its footing.
It begs the question: Is 2025’s so-called “debasement trade” back on? It was cast aside as the war in Iran brewed, and once again during the chip craze. We’ll find out soon if last week was just a flash in the pan.
The Bottom Line
Gold broke through its major downtrend resistance to begin August. The dramatic advance came amid no major fundamental catalyst, and strength was about 3x more intense in GDX. Despondency set in over the summer, as macro factors, such as rising real interest rates, suppressed rally attempts. Precious metals and related stocks may have turned the page, with a ‘buy the dip’ mentality supplanting a months-long ‘sell the rip’ theme.
Disclaimer: This blog is for educational purposes only and should not be construed as financial advice. The ideas and strategies should never be used without first assessing your own personal and financial situation, or without consulting a financial professional.