StockCharts Logo StockCharts Icon
  • Log In
  • Free Trial
  • Welcome
    •   Your Dashboard
    •   Your ChartLists
    •   Your Scans
    •   Your Alerts
    •   Notifications
    •   Your Account
    •   Support Center
    •   Contact Us
    •   Log Out
  • Symbol Summary
  • SharpChart
  • ACP
  • Point & Figure
  • GalleryView
  • Seasonality
  • Options
  • PerfChart
  • CandleGlance
  • RRG
  • Symbol Lookup
  • Charts & Tools
  • Articles
  • StockCharts TV
  • ChartSchool
  • Your Dashboard
  • Help

Latest Interview

January 04, 2024 at 11:43 AM
Greg Morris
by Greg Morris,
Veteran Technical Analyst, Investor, and Author

I was recently interviewed.   Here is the link: Traders of the World: Greg Morris (USA) - Episode 05 (youtube.com)

Greg Morris
About The Author:

Greg has a 50-year investing career as a technical analyst, developing several important indicators and trading systems. He has authored notable books on trend analysis, breadth, and candlesticks. Learn More 

 Previous Article Next Article 

Read More

MEMBERS ONLY

Chart with up arrow and down arrow: stock market breaking out or breaking down

Breakout or Breakdown? Why Last Week’s Rally Raises Red Flags

Martin Pring
by Martin Pring,
President, Pring Research

As false breakouts take place in some of the major indexes, Martin Pring reviews breakouts in the Dow Jones Industrial Average and Value Line Geometric Average and identifies key areas to monitor....   READ MORE 

MEMBERS ONLY

US dollar with price chart overlay

The Dollar Breakout Is Here. What It Means for Stocks, Bonds, and Commodities

Mike Zaccardi
by Mike Zaccardi,

The US dollar broke through a resistance level after Fed Chair Kevin Warsh's first meeting. Find out what this means for international stocks, homebuilders, and commodities....   READ MORE 

MEMBERS ONLY

StockCharts Insider: How to Use MarketCarpet and SCTR to Spot Potential Leaders Early On

StockCharts Insider: How to Use MarketCarpet and SCTR to Spot Potential Leaders Early On

Karl Montevirgen
by Karl Montevirgen,
The StockCharts Insider

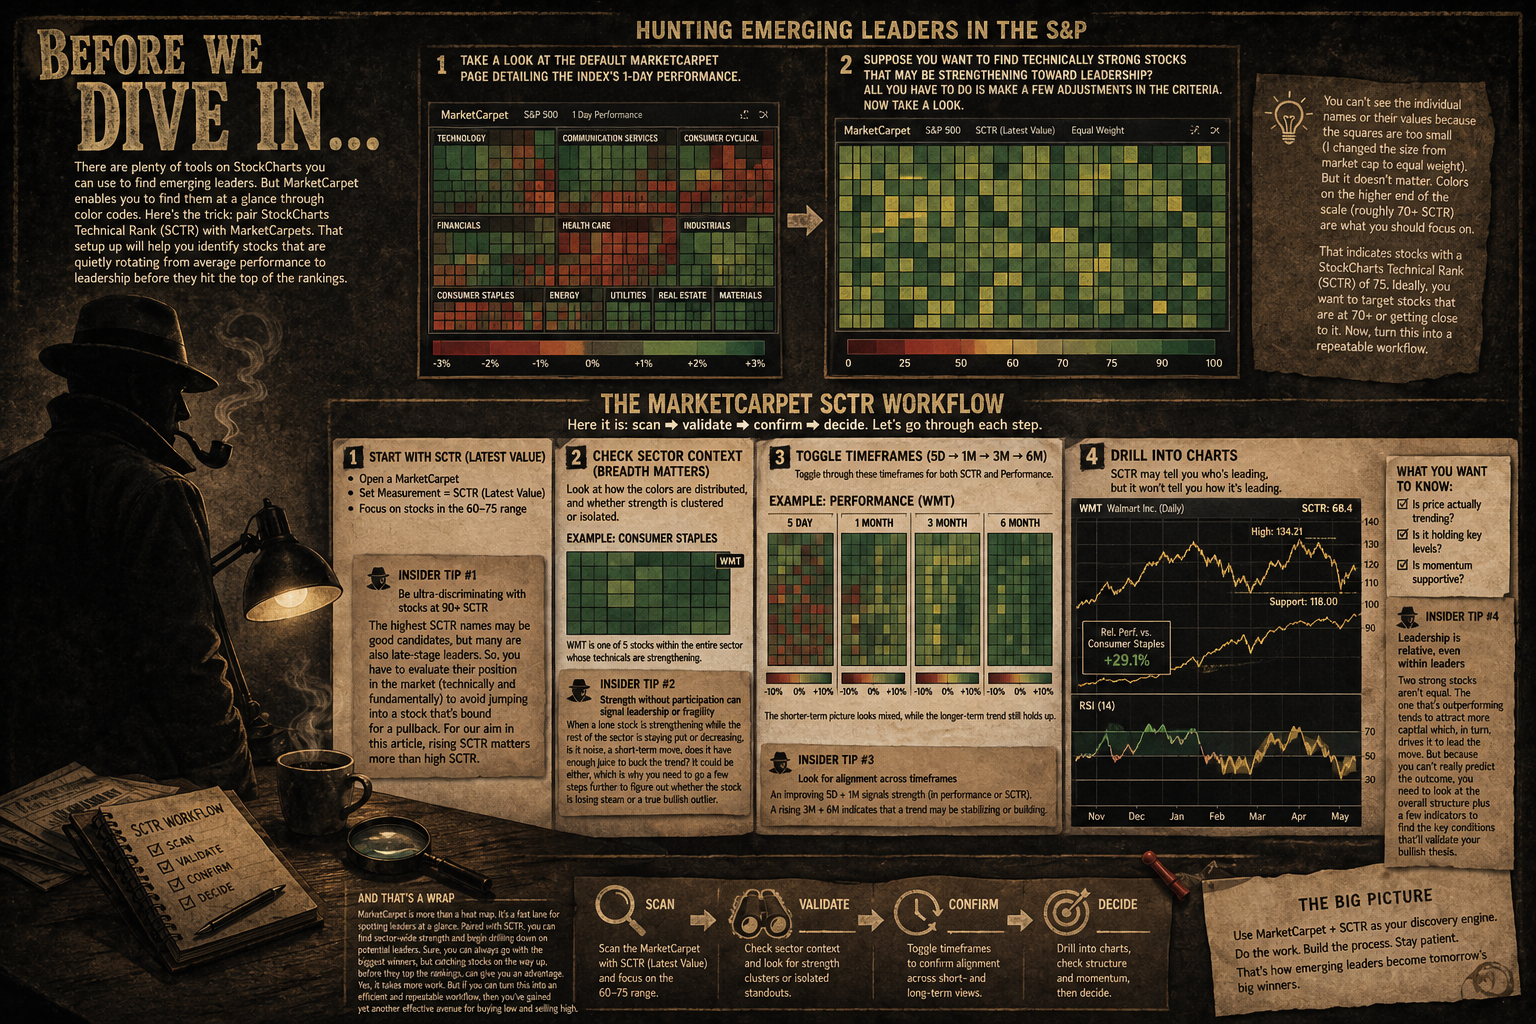
Before We Dive In… There are plenty of tools on StockCharts for tracking emerging leaders. But only one enables you to find them quickly through color codes. Here’s a simple method: pair StockCharts Technical Rank (SCTR) with MarketCarpets. Now you can identify stocks that are rotating from average performance...   READ MORE 

Featured Articles

MEMBERS ONLY

US dollar with price chart overlay

The Dollar Breakout Is Here. What It Means for Stocks, Bonds, and Commodities

Mike Zaccardi
by Mike Zaccardi,

The US dollar broke through a resistance level after Fed Chair Kevin Warsh's first meeting. Find out what this means for international stocks, homebuilders, and commodities....   READ MORE 

MEMBERS ONLY

Chart of stocks bouncing back

Stocks Bounce Back After Warsh’s Hawkish Fed Debut: What the Charts Say Now

Jayanthi Gopalakrishnan
by Jayanthi Gopalakrishnan,
Director of Site Content, StockCharts.com

Stocks rebound after a hawkish Fed meeting as Technology leads, the U.S. dollar strengthens, gold weakens, and oil tests key support level....   READ MORE 

MEMBERS ONLY

Finger pointing at chart on screen

Mixed Performance Weighs on the MAG7 ETF as it Hits Moment of Truth; Apple Pulls Back

Arthur Hill
by Arthur Hill,
Chief Technical Strategist, TrendInvestorPro.com

Relative weakness in three Mag 7 stocks is hurting the strength of this group. Arthur Hill analyzes the performance of the Mag 7 stocks and one of the stocks in the group....   READ MORE 

All Articles Follow Greg Morris

Experts


Arthur Hill Arthur Hill Bruce Fraser Bruce Fraser Carl Swenlin Carl Swenlin David Keller David Keller Frank Cappelleri Frank Cappelleri Grayson Roze Grayson Roze Jayanthi Gopalakrishnan Jayanthi Gopalakrishnan Joe Rabil Joe Rabil Julius de Kempenaer Julius de Kempenaer Karl Montevirgen Karl Montevirgen Larry Williams Larry Williams Martin Pring Martin Pring Mary Ellen McGonagle Mary Ellen McGonagle Mike Zaccardi Mike Zaccardi Milan Vaishnav Milan Vaishnav Tom Bowley Tom Bowley Tony Zhang Tony Zhang

Topics


Bonds Breadth Chart Patterns China stocks Commodities Crypto Earnings Equities ETFs FOMC Forex How To Indicators Interest Rates Market Analysis Members Only Options Precious Metals Sectors Tips & Tricks Tools Trading Strategies Volatility

Featured Articles


MEMBERS ONLY

US dollar with price chart overlay

The Dollar Breakout Is Here. What It Means for Stocks, Bonds, and Commodities

Mike Zaccardi
by Mike Zaccardi,

The US dollar broke through a resistance level after Fed Chair Kevin Warsh's first meeting. Find out what this means for international stocks, homebuilders, and commodities....   READ MORE 


MEMBERS ONLY

Chart of stocks bouncing back

Stocks Bounce Back After Warsh’s Hawkish Fed Debut: What the Charts Say Now

Jayanthi Gopalakrishnan
by Jayanthi Gopalakrishnan,
Director of Site Content, StockCharts.com

Stocks rebound after a hawkish Fed meeting as Technology leads, the U.S. dollar strengthens, gold weakens, and oil tests key support level....   READ MORE 


MEMBERS ONLY

Finger pointing at chart on screen

Mixed Performance Weighs on the MAG7 ETF as it Hits Moment of Truth; Apple Pulls Back

Arthur Hill
by Arthur Hill,
Chief Technical Strategist, TrendInvestorPro.com

Relative weakness in three Mag 7 stocks is hurting the strength of this group. Arthur Hill analyzes the performance of the Mag 7 stocks and one of the stocks in the group....   READ MORE 

Premium Content


MEMBERS ONLY

Chart with up arrow and down arrow: stock market breaking out or breaking down

Breakout or Breakdown? Why Last Week’s Rally Raises Red Flags

Martin Pring
by Martin Pring,
President, Pring Research

As false breakouts take place in some of the major indexes, Martin Pring reviews breakouts in the Dow Jones Industrial Average and Value Line Geometric Average and identifies key areas to monitor....   READ MORE 


MEMBERS ONLY

Crude oil barrels with price chart in background: will crude oil price fall

Will Crude Oil Fall Back to Where It Began?

Martin Pring
by Martin Pring,
President, Pring Research

During a business cycle, gold tends to lead copper, which leads crude oil. Martin Pring analyzes the intermarket relationships between the three and shows that crude oil prices are at a crucial level....   READ MORE 


MEMBERS ONLY

Man stopping domino effect: Did stock market first domino fall

Did the Stock Market's First Domino Just Fall?

Martin Pring
by Martin Pring,
President, Pring Research

Inflation, weakening breadth, and buyer exhaustion in technology stocks raise warning signs as key stock market indicators point to growing risk....   READ MORE 

ChartWatchers The StockCharts Newsletter

Get expert technical commentary delivered straight to your inbox! Sign up for our FREE weekly ChartWatchers Newsletter. Learn More

Marketplace


Explore our full collection of exclusive plug-ins and premium add-ons, designed to instantly enhance your investing, trading and charting experience with powerful indicators, data, market insights and other technical capabilities.

 Add-Ons  Plug-Ins  ChartPacks
Explore More

Expert market commentary delivered right to your inbox, for free.

Sign up for our weekly ChartWatchers Newsletter

Learn More  

On StockCharts

  • Charts & Tools
  • Articles
  • StockCharts TV
  • ChartSchool

Members

  • Your Dashboard
  • Your ChartLists
  • Advanced Scans
  • Technical Alerts

Help

  • Support Center
  • FAQs
  • Contact Us
  • Symbol Catalog
  • Pricing

Company

  • About Us
  • What's New
  • Careers
StockCharts.com Logo
Download StockCharts On The App Store Download StockCharts On The App Store Download StockCharts On The Google Play Store Download StockCharts On The Google Play Store

© StockCharts.com, Inc. All Rights Reserved.

  • Terms of Service
  • Privacy Statement
  • Site Map

Market data provided by Xignite, Inc. Commodity and historical index data provided by Pinnacle Data Corporation. Cryptocurrency data provided by CryptoCompare. Unless otherwise indicated, all data is delayed by 15 minutes. The information provided by StockCharts.com, Inc. is not investment advice. Trading and investing in financial markets involves risk. You are responsible for your own investment decisions.