S&P 500 Breaks Out as Mega-Cap Tech Roars Back: Here’s What to Watch Now

Key Takeaways
- Global stocks notched new highs as US large-caps fueled a powerful rally at the start of August.
- Semiconductors and international stocks remain just below key breakout levels.
- Healthy sector rotation and broadening participation continue to support the bull market.
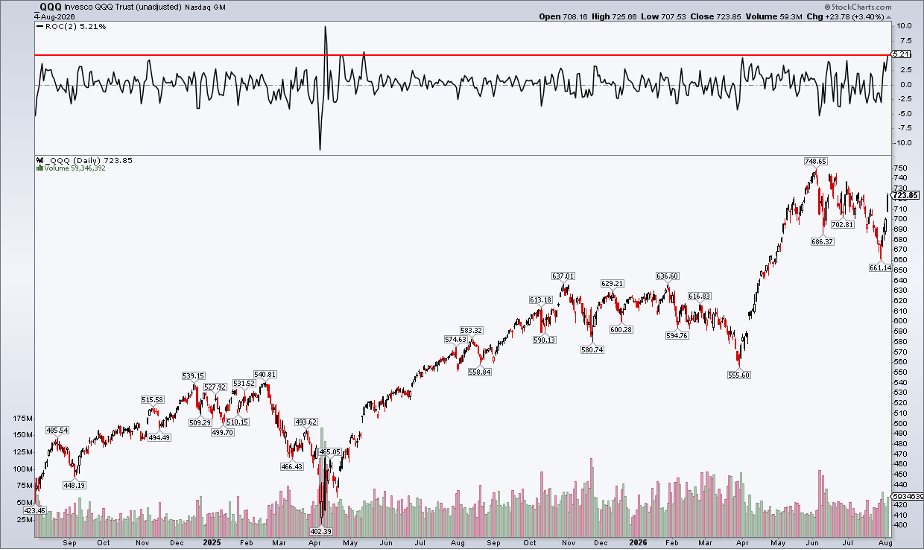
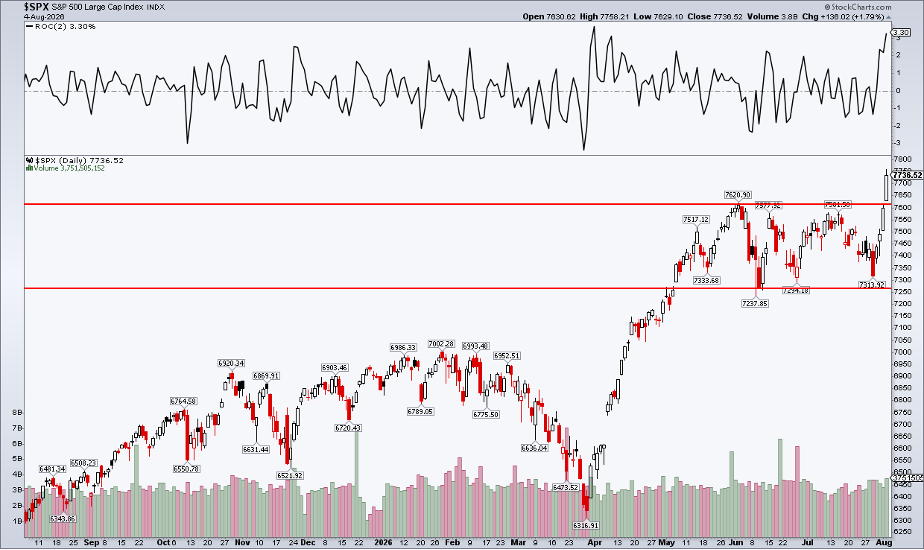
The August scaries are nowhere to be found in early-month trading. The S&P 500 ($SPX) reached an all-time high on Tuesday, its 25th of the year, carried by mega-cap tech after last week’s host of clearing events. The July Fed meeting, earnings season’s crescendo, a hedge fund blowup, recent USD/JPY intervention (with broad dollar weakness), and plunging oil all contributed to a 3.3% Monday-Tuesday thrust. The Nasdaq 100 ETF (QQQ) jumped 5.2% over August’s first two sessions, its best rally since May 2025.
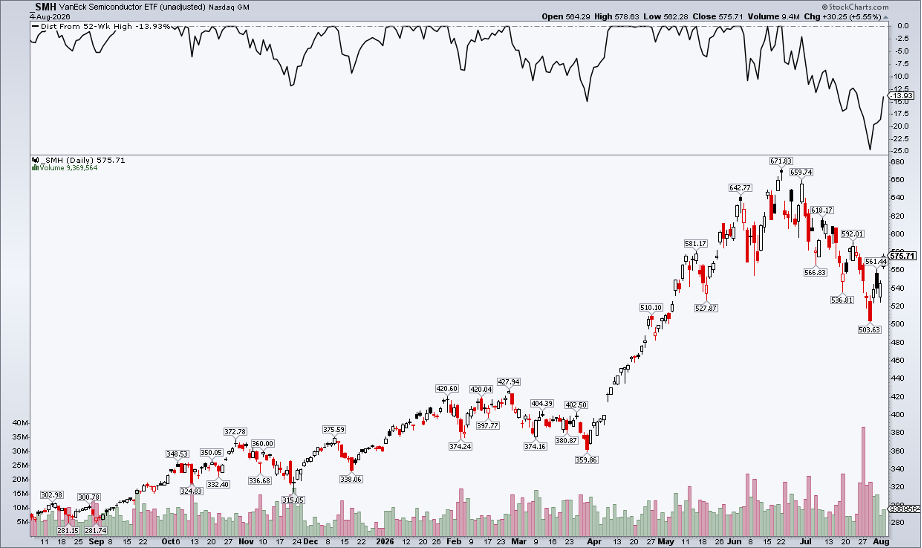
For the SPX, it’s a clean upside breakout. The classic technical pattern augurs well for the balance of the year, with new support now in the 7580 to 7620 range. The Qs still have work to do, however, as the semiconductor space remains far below its June 22 peak. In fact, the VanEck Semiconductor ETF (SMH) is still in a 13.9% drawdown from its June 22 record close.
Rotation Remains the Story
The leading sectors since summer’s beginning include Energy, Health Care, and Financials. This week, though, Technology, Industrials, and Communication Services are the only areas outperforming the S&P 500.
The upshot? Sector rotation is alive and well, acting as fuel for equity gains during what is often a tough calendar stretch. We can see that in the new 52-week high list, which is rather sparse considering global equities' breakout.
The U.S. is Closing the Gap
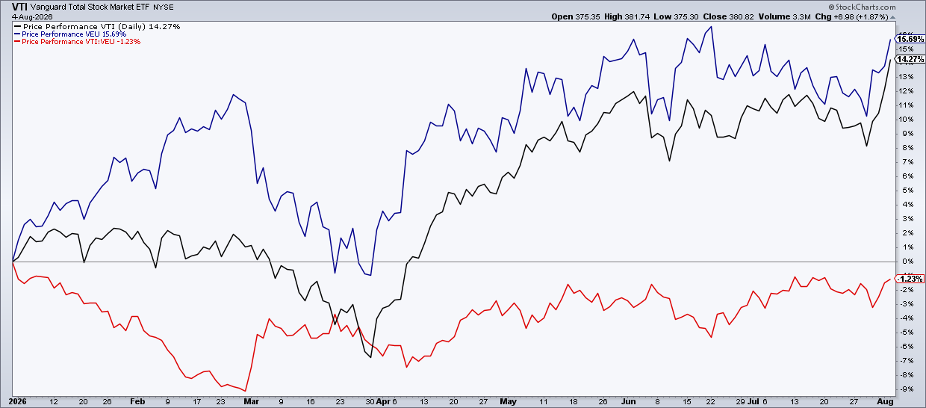
There’s another trend that diversified investors might notice but haven’t given much thought to lately, and that's that the U.S. vs. international performance gap has closed significantly over the last handful of months. Earlier this week, I detailed a US Dollar Index ($USD) breakdown below the 100.3 to 100.6 level. While that was a risk-on catalyst, it didn’t provide the relative rocket fuel to, say, the Vanguard FTSE All-World ex-US ETF (VEU) that traders would have expected.
With key US jobs data on tap, the Vanguard Total Stock Market ETF (VTI) is close to its YTD high versus VEU. The two index funds are easily up double digits on the year, with a narrow return spread of only 1.4 percentage points. So, increasingly, the global rally is being led by domestic names, which contrasts with 2025’s internationally-led advance.
VEU Still Has Work to Do
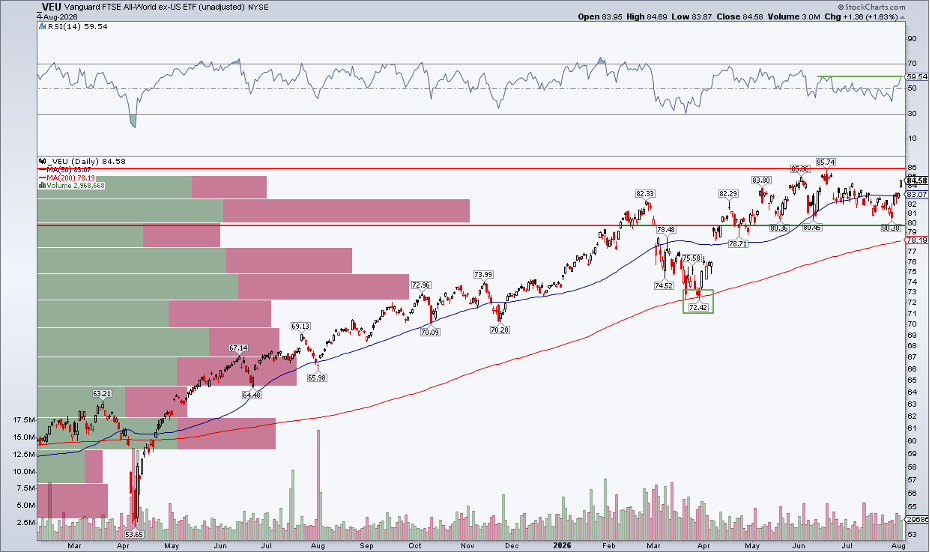
Like SMH, VEU has yet to eclipse its Q2 peak. Notice in the chart below that ex-US equities are not a whole lot higher than where they traded before the conflict in Iran. VEU is up a few percent over the last six months and is still more than 1% below its mid-June intraday zenith. The ETF jumped 5% off last week’s low, gapping up on Tuesday with an all-time high in sight. For geographic confirmation, I’d like to see VEU reach new records. That looks quite doable, despite what the calendar says.
VEU’s long-term 200-day moving average remains on the rise, with price holding that trend indicator line during the March correction. And while there wasn’t much oomph late in Q2 as it notched marginal highs, the theme has generally been one of higher lows since April 2025. What’s more, look at the RSI momentum oscillator at the top of the SharpChart. It's at a second-half peak. I’d like to see the RSI scale 70, along with price ascending above $86, to confirm the rally.
AI Holds the Key Overseas
International markets’ X-factor is the AI trade right now. Pull up the International Country ETFs Market Carpet on a day when SMH is down 5%, and the screen will probably be painted blood red. South Korea (EWY) and Taiwan (EWT) seem to dominate relative performance within VEU. Europe and Japan, by contrast, play supporting roles these days. Indeed, the aforementioned pair of AI-driven country funds are up more than 50% YTD, with the No. 3-ranked market, Thailand (THD), up 25%.
What to Watch Next
Overall, I expect the rotation trade to persist; that goes for both within US borders and globally. The ultimate breadth achievement would be for SMH and VEU to tag new records, along with the recently outperforming S&P 500. I assert that the setup is there, following last week’s series of fundamental and technical resets.
NVIDIA (NVDA) and its Q2 earnings report on Wednesday, August 26, might prove to be the near-term chip catalyst. For VEU, a sub-100 handle on the USD would be a tailwind, along with a cooling of volatility in shares of Samsung, SK Hynix (SKHY), and Taiwan Semi (TSM).
For now, US stocks are likely poised to sneak past internationals on the YTD performance chart. Momentum is with the Magnificent Seven names, while the S&P 500 Equal Weight ETF (RSP) climbed to a record of its own.
The Bottom Line
The bulls stormed out of the August gates, ripping the S&P 500 higher by more than 3% over August's first two trading days. Technically, it’s a clean upside breakout, with the presumption that former resistance becomes new support. Mega-cap US tech has been the recent winner, while SMH and VEU still look up to their June peaks. While some back-and-fill is possible in the weeks ahead, the May-through-July consolidation looks like yet another pause in the larger-degree... higher.
Disclaimer: This blog is for educational purposes only and should not be construed as financial advice. The ideas and strategies should never be used without first assessing your own personal and financial situation, or without consulting a financial professional.