Jobs Week Playbook: Reading the Market’s Inflation Signals

Key Takeaways
- The unemployment rate might finally break lower as stocks rise, snapping a years-long relationship.
- Inflationary pressures persist, and I spotlight one key market-based barometer.
- Energy stocks are also in focus following an April retreat.
It’s jobs week on Wall Street. With the bulk of the Q1 earnings season now in the books (and what a reporting stretch it has been), the focus turns back to the state of the labor market. The first full week of May is also an opportune time to revisit one of my year-end 2025 charts that bears watching into 2026.
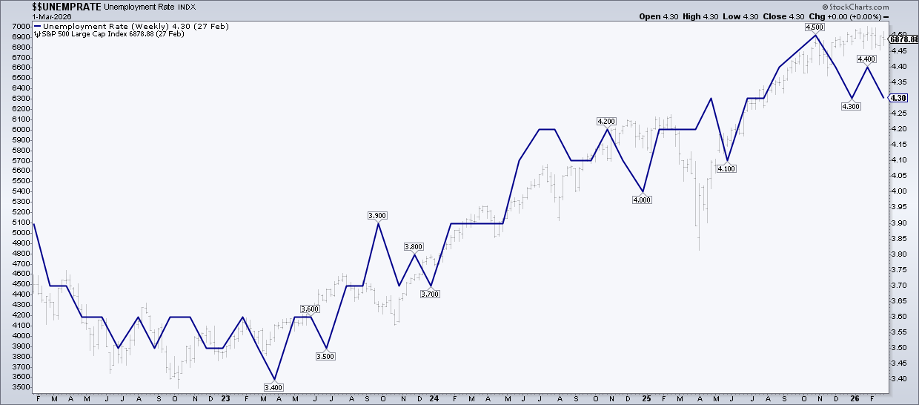
A Once-Reliable Relationship Breaks Down
Last December, I called out the remarkable relationship between the S&P 500 and the unemployment rate. Back then, the two series had moved in lockstep for the better part of the previous four years. It seemed counterintuitive (an increasing jobless rate with rising stock prices doesn’t seem to be the ideal macro and stock market condition), but traders must remember that the global economy remains in an inflationary regime. Hence, a cooler employment backdrop is a welcome development, as it usually means less pressure on wage growth.
As we venture further into 2026, we find that the SPX and the jobless rate have diverged. U.S. large caps are up a solid 5.6% on the year ahead of a busy week of labor market clues, while the unemployment rate could tick down to its lowest level since last June. Just last week, the Chicago Fed released its April 2026 (Advance) estimate of what the Bureau of Labor Statistics will reveal this coming Friday morning. At 4.23%, the unemployment rate would be down from its 4.564% cycle high logged last November.
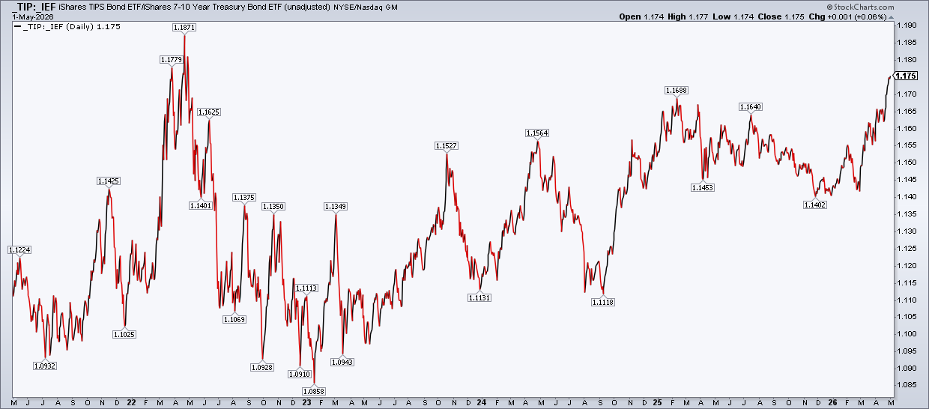
The Inflation Regime Remains Intact
The inflationary intermarket regime that began in earnest five years ago remains in place. For top-down technical traders, the implications are significant.
Look no further than the chart of the iShares TIPS Bond ETF (TIP) compared to the iShares 7–10 Year Treasury Bond ETF (IEF). TIP:IEF is the classic market inflation gauge. While CPI and the PCE Price Index can be revised and skewed by one-time shocks, tradable ETFs offer the purest look, as they reflect all available information. The wisdom of the crowd is at work. What does it point to? An inflation bugaboo.
Notice in the chart below that TIP:IEF has broken out to its highest level in four years. For a price relationship like this, I use unadjusted charts by placing underscores before both tickers. In short, when this ratio line is on the rise, inflation expectations are increasing.
Oil Prices Reinforce Inflation Pressures
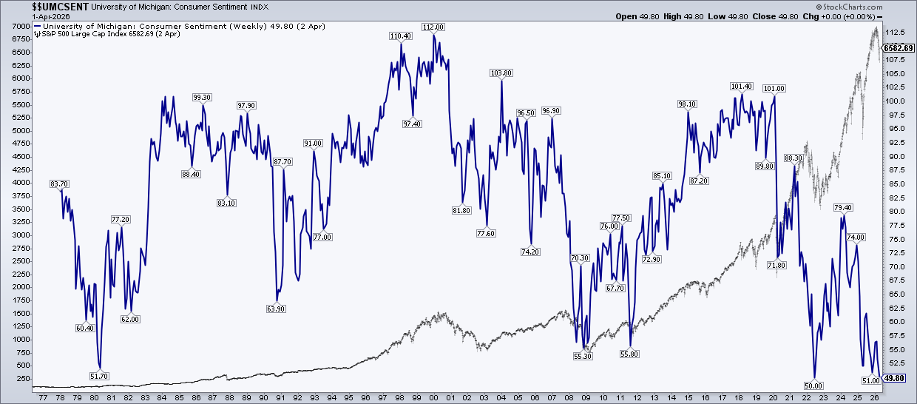
Market-based inflation expectations are heavily impacted by oil prices. With WTI and Brent crude oil stubbornly above $100 per barrel and U.S. retail gasoline poised to scale $4.50 per gallon this week, investors and consumers are well aware of the situation.
Speaking of Main Street vibes, the University of Michigan Consumer Sentiment versus the S&P 500 is another telling comparative chart. The former plunged to a record low in April, just as stocks tagged an all-time high. We’ve never seen that before, and it goes to show that “first times” happen all the time in markets. There’s never a definitive playbook for a specific regime.
Intermarket Analysis 101
So, what’s the right portfolio play heading into mid-year? Based on what the market tells us, inflationary relationships should persist. That means a positive beta between bonds and stocks, with bonds typically changing direction ahead of stocks; an inverse relationship between bonds and commodities; and a soft negative correlation between the U.S. dollar and commodities (unlike previous inflationary periods, the greenback has played a small role in macro price dynamics in the past year).
Energy Stocks: Don’t Count Them Out Yet
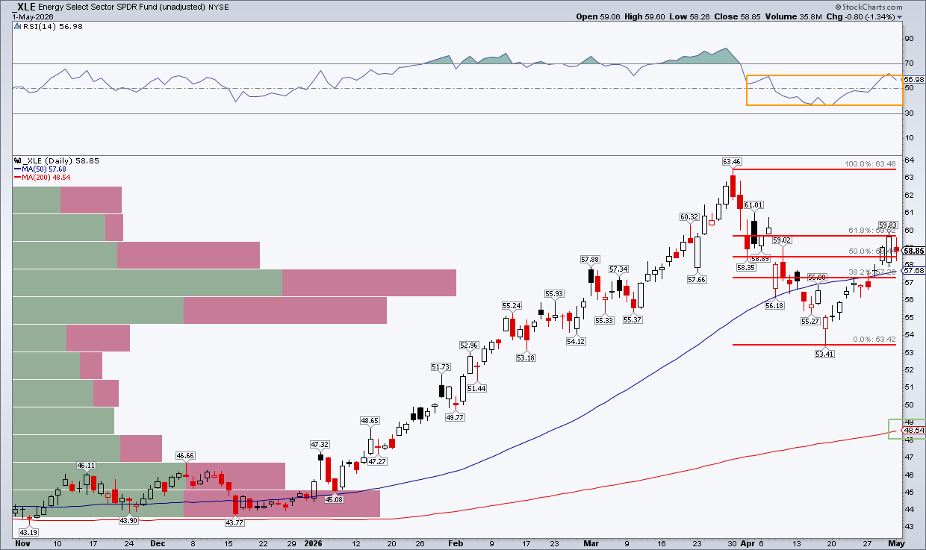
Equity traders may then seek diversification in the Energy sector. The Energy Select Sector SPDR Fund (XLE) fell 16% from its March 30 peak to a low on April 17. Recall that the S&P 500 bottomed on March 30, so XLE has certainly been zigging while the market zags. The correction retraced half of the December-to-March rally.
It’s important to note that Energy stocks were in a clear uptrend well before the conflict in Iran began (the market often has a way of sniffing out major geopolitical events before they unfold). Fast forward to today and XLE initially paused at the 61.8% Fibonacci retracement of the March 30–April 17 decline. A jump above $60 could quickly lead to a test of the $63.46 all-time high.
Zooming out, XLE may have broken its rate of trend from late last year, but its long-term 200-day moving average remains on the rise, suggesting that the bulls control the primary trend. What’s more, the RSI momentum oscillator at the top of the chart is in a mixed zone... not quite in the bearish 20 to 60 range, but well under the sustained 60 to 90 zone from Q1. I would still err on the side of XLE being in an uptrend.
Valuations Reset, Opportunity Emerges
And for all the fundamental analysts out there, the S&P 500 Energy sector has re-rated sharply lower just this quarter. Its price-to-earnings ratio climbed from 16x to 21x earlier this year but has since declined to near 15x. Now among the cheapest areas in the market (with strong EPS growth), XLE may have something to offer as the U.S.–Iran conflict drags on.
The Bottom Line
Jobs week on Wall Street calls for a fresh look at the macro. The unemployment rate could dip to multi-month lows, while inflationary indicators light up in the background. I’m watching intermarket trends, and Energy sector stocks specifically. XLE should be on the radars of top-down analysts, technical traders, and perhaps even value investors.
Disclaimer: This blog is for educational purposes only and should not be construed as financial advice. The ideas and strategies should never be used without first assessing your own personal and financial situation, or without consulting a financial professional.